


‘I find it oppressive when a piece of writing has a single thesis that is stated early and is then continuously and predictably amplified and repeated.’ The opening sentence of the 1996 best-seller A Mathematician Reads the Newspaper by John Allen Paulos, seems to reverberate as one turns the pages of Economic Survey 2020-21.
We, who teach data analysis in social sciences for a living, now have a classic reference of perverse interpretation and manipulation of data, which may euphemistically be called ‘confirmation bias’—the tendency to look for information that supports, rather than rejects, one’s preconceptions.
It is apparent that such manipulation has been resorted to in an attempt to validate the ideological position behind the framing of public policy. The ideological stance, be it vouching for fiscal conservatism, pushing for structural reforms, claiming that economic inequality is unimportant in India, or even showing the performance of a particular state in poor light, is backed by weak logic, misinterpretation of numbers, and selective citation of literature with favourable conclusions.
Discounting the importance of a stimulus
The Survey, for instance, acknowledges the importance of a demand stimulus during a crisis but speaks of the limitations of a stimulus in boosting economic recovery by citing a study by Coibion et al (2020), which shows that more than a half of the Americans used direct cash transfers to repay old debts, instead of spending it on consumption. The use of such benchmarks, which are in no way relevant to the Indian context, was probably prompted by the anticipation of criticism of the government’s fiscal conservatism. Indeed, the year 2020-21 saw an increase in the central government’s spending by a meagre 13% over the amount that had been budgeted for before the pandemic struck. This stubborn conservative approach to fiscal spending may perhaps be explained by the government’s inability to improve its fiscal health in the years preceding the pandemic.
India entered the pandemic not only with an already slowing economy but also with a weak fiscal situation because of the government’s past inability to raise revenues. Yet, in a situation of significant contraction in the gross domestic product (GDP), fiscal austerity is the last thing that should have come to the policymaker’s mind.
The Survey boasts of India as ‘the only country to have undertaken structural reforms on the supply-side at the initial stages of the pandemic’ (p. 35). One wonders why no other country even contemplated such a ‘far-sighted policy response’ which would ‘generate productivity gains in the medium to long term’. While the Survey advocates structural reforms in order to achieve productivity gains, it fails to acknowledge that unemployment rose sharply during the pandemic and real wages in India fell by 3.6% for formal workers and 22.6% for informal workers (ILO 2020). The country’s unemployment rate (the proportion of job-seekers who did not find employment), which traditionally remained between 2% and 3%, rose to 6% in 2017-18 and then to 7.5% in 2018-19, according to the Periodic Labour Force Surveys. The CMIE (Centre for Monitoring Indian Economy) estimates show that these rose to an alarming 23.5% during the Covid-19 lockdown. Over and above this, there was a decline in the number of people seeking work. The CMIE survey has shown that 20 million people of the working age have withdrawn from the labour market during the pandemic year. Experts have repeatedly stressed the need for a long-term public plan for boosting labour force participation and employment. Yet, the 335-page Survey does not contain any discussion of the problem of unemployment in these Covid times. It uses the word ‘unemployment’ only twice, that too while citing two studies, one a purely theoretical paper and the other a historical one.
Ignoring inequality
The Survey seems to be rather oblivious of the existence of a huge body of both theoretical and empirical literature on the complex connection between growth and inequality, and of how inequality influences the relationship between growth and poverty in particular. The seminal paper by Ravallion (2005), for example, showed rigorously that growth tends to be less pro-poor if inequality is high. Indeed, Ravallion found that among the countries with the highest inequality, the incidence of poverty incidence was quite unresponsive to economic growth.
‘India’s unique vulnerabilities to the pandemic’, according to the Survey, are primarily demographic in nature (the presence of a high and dense population, a large number of aged individuals, p.1). The Survey does not address the much-discussed structural vulnerabilities of Indian society, which have rendered the poor very vulnerable to the pandemic.

Many studies have shown how inequalities in India have sharpened during the pandemic. To quote the Oxfam International report The Inequality Virus, “During that period, the average increase in Ambani’s wealth in just over four days represented more than the combined annual wages of all of Reliance Industries’ 195,000 employees” (Oxfam 2021). It seems that the Indian government is no longer content falsely negating or ignoring these figures. The Survey goes a step further and builds a counter-narrative that seeks to legitimize rising inequality in India. Chapter 4 makes a very strong claim that unlike in advanced countries, in India, economic growth and inequality converge in terms of their effect on human development indicators. Based on scatterplots and fitted lines (often with visually glaring poor fits), it draws causal connections between growth and human development outcomes on the one hand, and between inequality and human development outcomes on the other. On page 122, it concludes that ‘economic growth has a far greater impact on poverty alleviation than inequality’, thereby hopelessly mixing up poverty and indicators of human development.
Furthermore, any student of Economics would know that it would be outright wrong to ascribe causality and make such an involved comparison of impacts from a simple bivariate analysis using a state-level cross-section dataset. Economic inequality is measured by the Gini coefficient of consumption expenditure in each state. Rather strangely, the states’ Gini values are plotted against their Net State Domestic Product (NSDP) per capita, instead of against their NSDP growth rates. A positive correlation between NSDP per capita and inequality does not automatically imply that a similar correlation exists between growth in NSDP and inequality. To further strengthen its point about the unimportance of rising inequality, the Survey adds Box 1 on China’s so-called trade-off between rising inequality and the rapid growth that reduced poverty (p. 45). China is often cited as an example of the growth-inequality trade-off. However, the evidence is contrary to this interpretation. In China, periods of more rapid growth did not bring more rapid increases in inequality. Indeed, the periods of falling inequality (1981–85 and 1995–98) had the highest growth in average household income, and the provinces that started the reform with relatively high inequality had both lower subsequent growth and less sharing by the poor in the gains from that growth (Ravallion, 2005).
Assessing PM-JAY
Chapter 9 eulogizes the Pradhan Mantri Jan Arogya Yojana (PM-JAY)—the healthcare programme, launched by the government of India in 2018. The chapter aims to proclaim the supremacy of the PM-JAY by making before-after comparisons using data from two rounds of the National Family Health Survey (NFHS): Round 4 of 2015-16 and Round 5 of 2019-20. That the fact-sheets for some of the major states of NFHS 2019-20 have not yet been released does not seem to hinder the exercise. West Bengal is considered the benchmark state that has chosen to refrain from implementing the PM-JAY. The temporal change in its performance in terms of various health indicators is compared to that in three neighboring states with PM-JAY, namely Assam, Bihar and Sikkim. What seems most surprising is that instead of conducting a state-level comparative exercise, which is the standard practice in empirical work, the Survey gives composite figures for the three states on each of the indicators. Providing a bizarre defence, the Survey states that ‘all these states being contiguous to each other’ are ‘therefore similar on socio-economic dimensions’(p 288). It even claims that ‘the baseline characteristics of these two groups of states were similar’ (p 288). The two groups of states being (a) West Bengal and (b) the adjoining PM-JAY states, Assam, Bihar and Sikkim. These characteristics, it spells out, are ‘key demographic and household characteristics’ (p. 295), such as the proportion of female population above six years of age who attended school, the sex ratio, and household-level access to certain facilities such as clean fuel, improved drinking water and sanitation.
However, any practitioner of social science research would know that it is fundamentally wrong to combine states that are so disparate in terms of attributes. The three PM-JAY states include Sikkim, a high human development state, and Bihar, an Empowered Action Group (EAG) state, arguably the most backward in terms of human development indicators.
Let us visit some of the ‘demographic and household characteristics’ that the Survey claims are similar for these states. While in Sikkim, 87% of the households have access to improved sanitation, in Bihar the corresponding figure is 49%. The child sex ratio (the number of females for every 1000 males, born in the last five years) varies between 969 in Sikkim and a very low 908 in Bihar. West Bengal now has a child sex ratio of 973. Obliterating these patterns, the Survey provides a simple average of 947 as the child sex ratio in the three states combined together.
Demographers would shudder to realize that the Survey does not even bother to calculate the population-weighted averages for these states. The econometric technique that the Survey uses to make an appraisal of the PM-JAY programme in the states is also problematic. It uses the ‘difference-in-difference’ technique. This is a technique commonly used in applied work for the evaluation of impacts of programmes. It compares the outcomes in the control group (one without the programme) with those in the treatment group (one with the programme). However, any undergraduate student of econometrics would know that the exercise would be flawed if the ‘treatment group’ itself is so heterogeneously composed.
The annual appraisal of the economy claims that the performance of the PM-JAY states has been better than West Bengal in terms of health indicators such as infant and child mortality, birth-spacing, access to health insurance, and ‘various metrics for mother and childcare’ (p. 296). However, the bar graphs presented may seem to be counter-intuitive at first glance. Take infant and child mortality rates, for instance (Chapter 9, p. 297). West Bengal still has much lower levels of infant and child mortality compared to the combined average of the PM-JAY states. The under-5 mortality rate in West Bengal is 25 per 1000 live births compared to the average of 36 in Assam, Bihar, and Sikkim (in Bihar it exceeds 56). Similarly, the proportion of households covered by a health insurance scheme in West Bengal is almost twice that in Bihar.
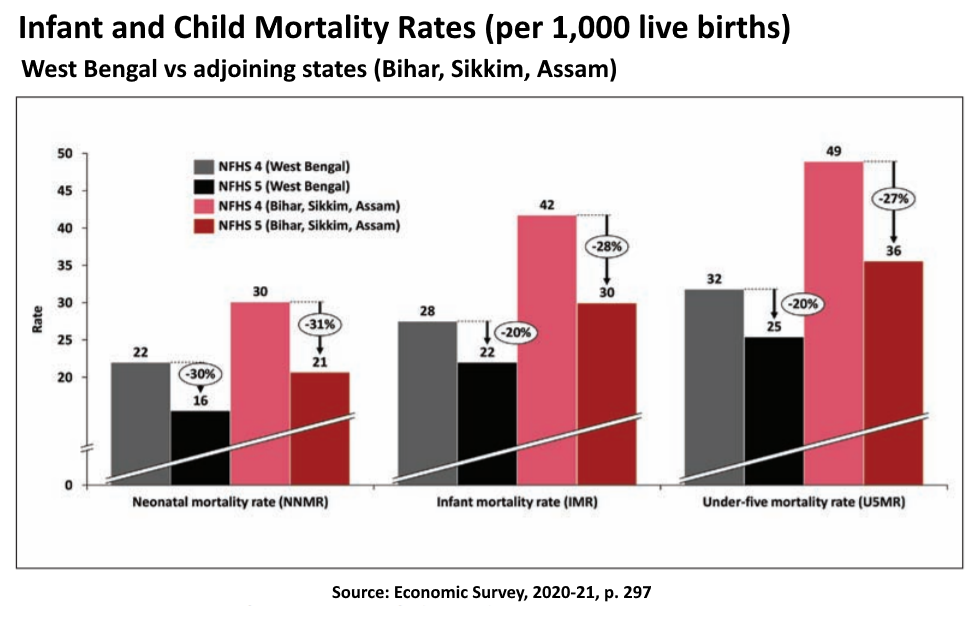
On probing, one realizes that the Survey intends to evaluate the performance of states not in terms of the levels but of the change between NFHS-4 and NFHS-5. Nevertheless, the crucial question one should ask is how it chooses to interpret change. The Survey chooses to report the percentage change to measure progress for all the indicators. However, Sen (1981) pointed out the limitations of using percentage change to monitor progress and formulated an alternative measure, the improvement index to measure change in certain cases. Chakraborty (2011) drew on this idea and showed that the same absolute change may be reflected as a greater percentage change when the initial levels are low. Since it is often more difficult to make further improvements once a certain level of human development is reached, using percentage changes to monitor change would perversely reward the state with poor initial figures. The proportion of mothers who received postnatal care within two days of delivery improved from 61% to 68% in West Bengal. The corresponding change in the adjoining PM-JAY states was from 57% to 64%. The Survey reports the same change of seven percentage points as an improvement by 11% in West Bengal and 13% in the adjoining states and claims that the change has been ‘slightly higher’ in the latter (p. 300).
Like most other policy documents of the current regime, the Survey has a fetish for making up sensational acronyms. Titled ‘JAY Ho: Ayushman Bharat's Jan Arogya Yojana (JAY) and Health Outcomes’, Chapter 9 selectively reports figures and sketchily ascribes a causal role to PM-JAY in boosting health outcomes in states that have introduced the scheme. It does not mention that something as critical as average out-of-pocket expenditure per delivery in a public health facility has come down from Rs. 7,919 to Rs. 2,683 in West Bengal between 2015-16 and 2019-20. Irrespective of the way we choose to measure change, there has been an absolute increase in these figures in the PM-JAY states: by Rs. 1,064 in Bihar, Rs. 1,594 in Assam and Rs. 4,341 in Sikkim (IIPS 2020).
This can go on and on. In sum, the Economic Survey 2020-21 hardly achieves one of its main objectives, which is to persuade its readers about the importance of pursuing growth and structural reforms by all means. The failure is due to its poor rhetorical strategy. Bad economic and statistical arguments are poor rhetoric if the intended audience is moderately well-versed in economic and statistical arguments.
Decline in quality
The Economic Surveys of the earlier years were criticized for being ‘bland and dense’, which Kaushik Basu ‘jazzed up’ between 2009-10 and 2012-12, both in content and presentation. These were lucidly written documents, combining rich theoretical and empirical insights drawn from frontier research in development economics. His successor, Raghuram Rajan added his own touch to the Survey. Arvind Subramanian, in the Preface to the 2016-17 Survey, paraphrased Keynes and listed the qualities expected from the Economic Survey.
It must possess a rare combination of gifts .... It must draw upon mathematics, history, statesmanship, and philosophy-in some degree. It must understand symbols and speak in words. …It must be purposeful and disinterested in a simultaneous mood, its authors as aloof and incorruptible as artists, yet sometimes as near to earth as politicians.
Subramanian acknowledged that the Survey failed to attain those high standards during his tenure as Chief Economic Advisor. One wonders what compels K.V. Subramanian, a student of Raghuram Rajan, to discard those ideals and engage in such apparent petty campaigning for the present government. Indeed, in the Preface, he compares India’s growth rate to the resilient ‘rebound from 36 all out to winning the Test series’ in Australia’ (p.ix). One wonders if the compulsion of playing to the gallery supersedes serious analysis of the economy and policy in this year’s Economic Survey.