
Predicting stock prices, day-to-day or month-to-month, is hazardous business, reserved only for geniuses or fools. The markets are volatile enough to take both in their stride, making it difficult to tell one from the other. Nevertheless, there is deep method in the madness and chaos of the market, in much the same way as well-defined laws of physics produce the tumultuous tohubohu in our lives. Our lives are rendered chaotic, as are markets, by these laws, but the chaos does not mean we have no control over how to negotiate both safely.
We are at one of those unfortunate junctures, where the link between corporate profits and the level of prosperity in the economy is dislocated, thanks to a combination of corporate tax cuts, enhanced indirect taxes on consumers, and other factors.
Corporate profits have been robust, thanks to corporates tax rate cuts and the rapid pace of the so-called 'formalisation' of the economy which has decimated the micro, small and medium enterprises (MSMEs) while fattening the coffers of the organised sector.
As a rough guide, the Narendra Modi government has increased indirect taxes by 1% of GDP annually (that is Rs 3 trillion per annum) while cutting direct taxes by a like amount, mainly for corporates. So the flow of cash towards the corporate sector is mind-boggling. It is raising corporate profits and price-earnings (PE) ratios across the board.
The markets...look to determine the collective value of the profits of the corporates listed on the bourses, and not the level of prosperity in the economy.
The carnage in the MSME sector is destroying jobs and eroding incomes at a faster rate than growth in corporate sector can create new jobs. Lost incomes at MSMEs and amongst wage earners will pull down the future growth of the economy.
It is also true that lost consumption demand due to job losses is not being replaced by corporate investment demand, further pulling down future growth. But corporate profits are growing at a humongous rate within a slowing economy, due to the sales of MSMEs being diverted to the organized sector. This basic trend is reinforced by growing commodity exports and a revival in demand abroad for software services. All-in-all, while the economic outlook is less than robust, corporate profits will continue to gallop for at least another two years, giving markets a fundamental resilience on the downside. Joblessness and growing poverty will however strain the social fabric and we need to keep a wary eye on the political temperature.
The markets, however, look to determine the collective value of the profits of the corporates listed on the bourses, and not the level of prosperity in the economy.
In these days of Artificial Intelligence-driven algorithmic trading, the preservation of capital without sacrificing returns should be the objective of investors in the the medium-to-long term time frame. By wisely choosing our objective, as well as our time horizon, combined with some trading discipline, we can avoid competing with the 'algos' in their area of strength, since most of them are momentum-based, short-term players in terms of their logic and objectives. This is most important. Without clarity in one’s objectives and time horizons, one can be sucked into a vortex of cash-flow-driven contrived volatility, that is used to entice the unwary into bull and bear traps.
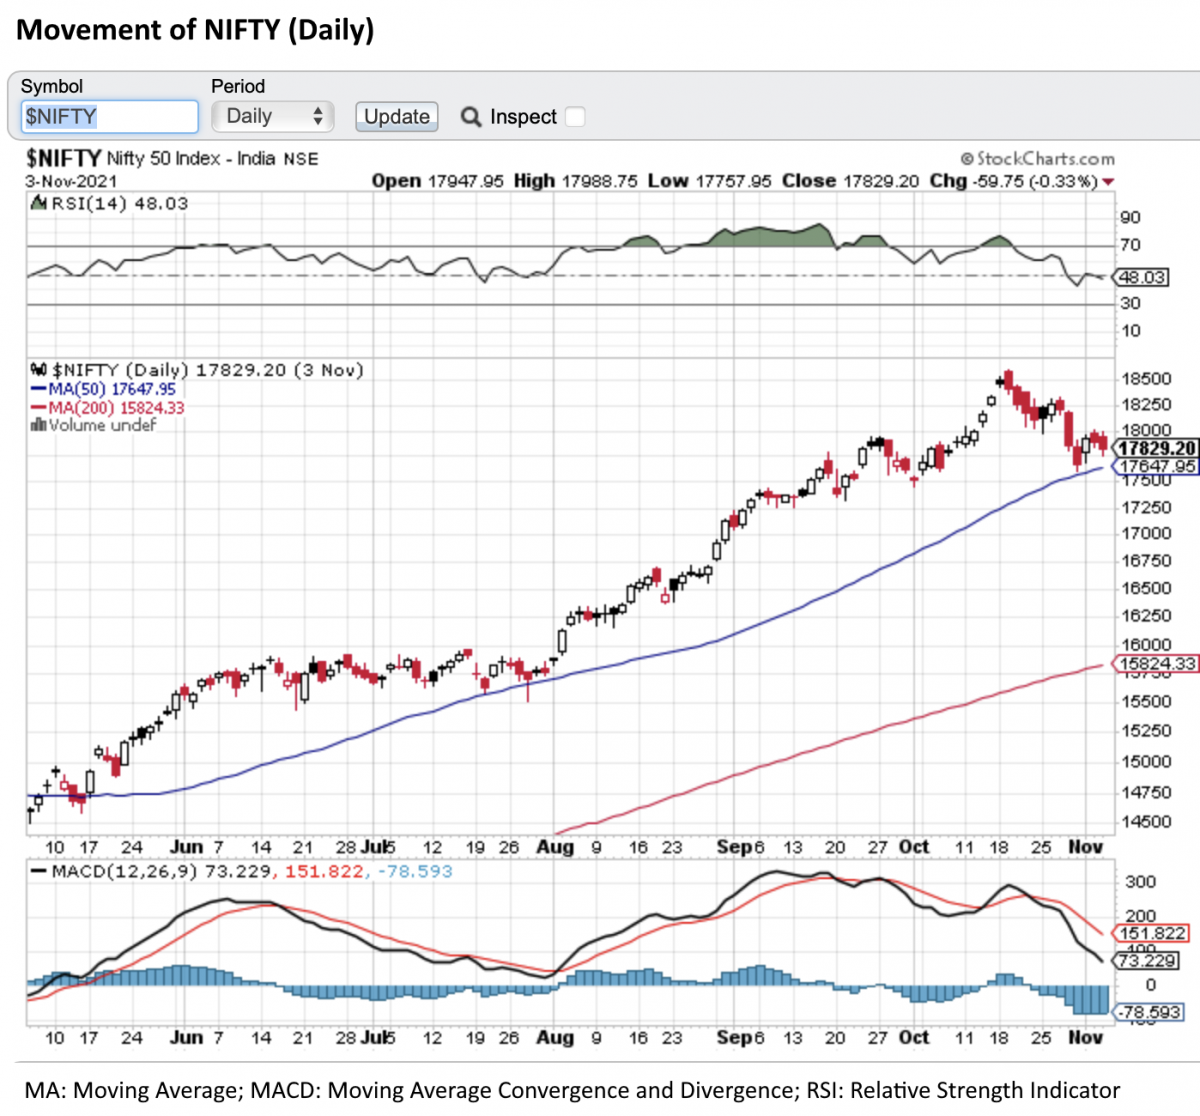
Is the correction in the NIFTY, that began on 19 October, 2021, a major correction..or just a corrective pause...?
So with this cautionary background, I shall attempt to answer a very limited question: Is the correction in the benchmark NIFTY 50 stock index that began on 19 October, a major correction that heralds the end of the bull market that started on 25 March 2020, or just a corrective pause in the bull cycle to validate the slope of the uptrend in prices that began in March 2020? Or is it to find a new trend-line with a less steeper slope?
That is all one needs to know if one is the kind of medium to long-term investor I have in mind, with a three-to-five year time frame, who wishes to preserve her capital, but without losing potential long-term returns that come from equity investments.
One takes action to preserve capital only if (a) the correction is likely to exceed some reasonable limit, say 20% of current value, and (b) the time the correction may last exceeds say, six months to a year, where one could profitably switch to short-term debt. If neither is the case, you just sit tight, and avoid giving away your capital to your broker and the government . Remember, transaction costs are killing: 20% capital gains tax and 1 to 2% of the transaction as intermediation fee.
So back to the market. The first thing one notes about the markets is that they are cyclical, and creatures of habit. Why? Because contrary to all that they teach us as “investing dharma”, the fact is there is no way to tell the price of a stock, or even an ensemble of stocks, as in an index. The market exists to discover such a price precisely because neither we nor the market know what the true price is. What one sees on the screen every day is the “traded price” and it represents a balance of investor demand/supply, the deficit/surplus in the market makers’ inventory, and institutional investors in queue, waiting to accumulate or distribute the stock at their “reserve” price. At best it is the day’s marginal price of a stock.
It is all very practical, and the price that prints is the only hard fact of reality on any given day. The rest is marketing gloss.
I have deliberately avoided the mumbo-jumbo of daily auctions, open out-cry, price, and demand/supply, because they are simply theoretical constructs with limited applicability to markets. What I have laid out here is the institutional mechanism in the market by which day-to-day price is set but not yet discovered. In other words, this is just a part of price discovery process, and a fairly minor part of it.
One is often told markets are 'one-way' discounting mechanisms. What does this mean? It simply means that prices trend up for a while, say for two weeks, then suddenly reverse for another two weeks, and then resume their upturn along the same old trend line. All the while they react to news flow, make little moves up or down to take the price impact of the news into account. But the trend is usually one way.
What is happening here? Well, this is the part where the market as a whole — the professional market — slowly takes the price up for, say, two weeks, and then trends it down for two weeks, usually in very small increments to see how demand and supply varies with each increment or decrement in price. (Note that this is not to make a profit by selling you high and buying low,) The investor demand and supply for each price point in the period is totted up, and it becomes the basis of price discovery for the next period. It is a sort of price vs volume map for professional market makers.
The rally has rightly concentrated on the visible money spinners, be they software services or metals.
Markets on the uptrend are different from markets on the downtrend. The demand for a stock increases with price, and the supply of stock increases with a fall in price, quite contrary to demand-supply curves for a commodity. Nor is a rise or fall in demand symmetrical with respect to price. So a robust trial and error method is at the heart of this process to discover price. Nobody trusts theory. It is all very practical, and the price that prints is the only hard fact of reality on any given day. The rest is marketing gloss.
But what this complete four-week cycle, two up, two down, (or whatever the time period in the market is) does is to give the professional side of the market a fair picture of demand and supply around a price point in the uptrend and downtrend. They use this information to test and set the price in the next cycle.
Every six months or so, the whole four-week cycle itself is disrupted. This is to say, you take six months of the uptrend, in cycles of four weeks, which you then disrupt with six months of a downtrend cycle — what we call a correction. The same process of testing for price daily, weekly, cyclically continues, but this time with the major trend down.
The volume of demand and supply at each price point then becomes the basis of price discovery in the next major trend up. All these cycles, within cycles, within cycles, combine to produce the random looking prices one sees on charts. But these little jiggles are usually not random at all. They are at the heart of price discovery that makes a two-way market possible in a very methodical way. There is no other known way of making a two-way market.
I have simplified the process to make it understandable, while giving one enough to understand how price discovery works, and how it is possible to use an understanding of this process, to limit the market-imposed risks on your portfolio of stocks.
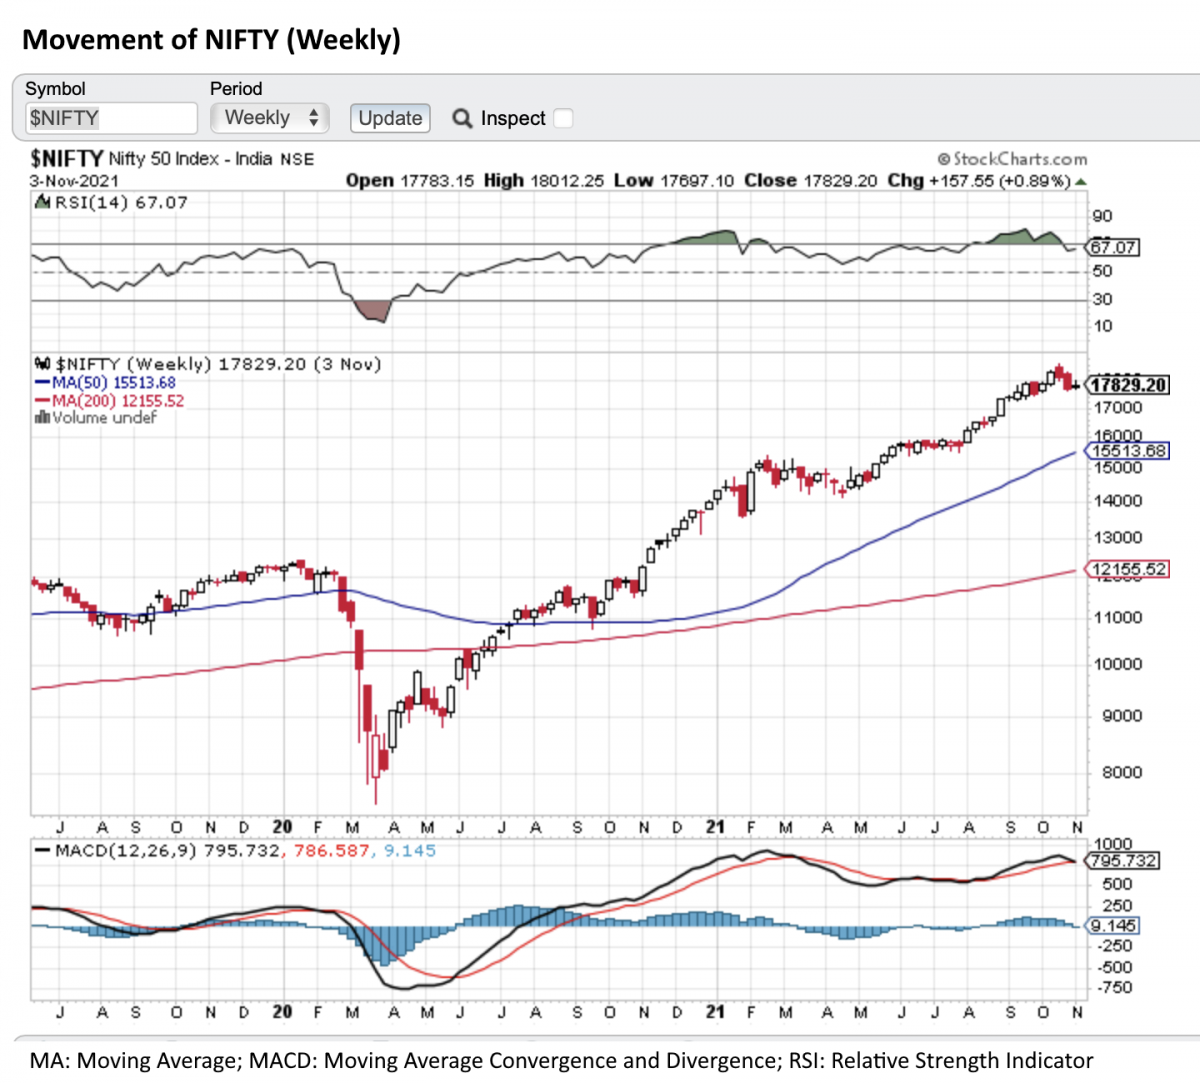
Getting back to the NIFTY chart, what began as a downtrend on 19 October is most probably the beginning of a corrective wave that is unlikely to breach the 50 day Moving Average (MA) in any significant way. A breach of 16,500 is unlikely in my view. So in terms of the length of this correction, you are looking at a fairly short period of sideways movement. Does that mean you sell? Not really. You wait to see if market breaches 16,500 significantly before taking any action.
Note that the corrections in indices have grown shallower, with the advent of algorithmic trading, as well as SEBI mandated buy-and-hold regulations for equity mutual funds. Save for the usual crop of exuberant, and over-leveraged traders, who trade market momentum from Starbucks cafes, there is little nourishment for bears on the downside. Another feature of this rally from March 2020 is the unusually high number of laggards. The rally has rightly concentrated on the visible money spinners, be they software services or metals. The spread of stocks will expand going forward, and we may well see heretofore laggards outperform the market. That is another argument for staying invested.
So I conclude this by saying wait to see if the index hits 16,500 or nearby, around November end. If it does, watch subsequent behaviour at that support to determine your next move. A serious violation is defined as a breach by at least 2% of price. On the other hand, the market may turn up even before any of this happens.