

India’s financial year 2020-21 has had a disastrous start with the first quarter gross domestic product (GDP) plummeting by (-)23.9% over the first quarter of the previous year, the steepest fall amongst major economies.
The severity of the fall in growth is attributed to a combination of one of the most stringent lockdowns globally in response to the Covid-19 pandemic, and the absence of a fiscal stimulus to counteract the consequential sharp fall in the incomes of individuals and businesses. There is a consensus amongst economists that the 10% stimulus announced by the central government in May translates into a budgetary additionality of no more than 1.5%-2% of the GDP. Stimulus 2.0, announced in October, has done little to add substantially to this. This is in sharp contrast to the fiscal support of 10%-20% of GDP provided in several major economies, where central banks have not hesitated to intervene to buy large amounts of government debt to keep interest rates low.
As in the case of Covid-19, the recovery of an economy is contingent on its condition at the time of contracting the virus. Those with comorbidities are in greater danger.
With the Indian economy in intensive care, there is continuing speculation amongst economists and in the financial media as to the nature and timeline of the patient’s recovery. Various alphabet shaped recoveries -- most notably V, U, and K -- are debated. The last refers to a very different pace of recovery across sectors, which is consistent with both a strong recovery and a weak one.
As in the case of Covid-19, the recovery of an economy is contingent on its condition at the time of contracting the virus. Those with comorbidities are in greater danger. The question that arises therefore is: what was the state of the Indian economy at the time it contracted the Covid-19 downturn?
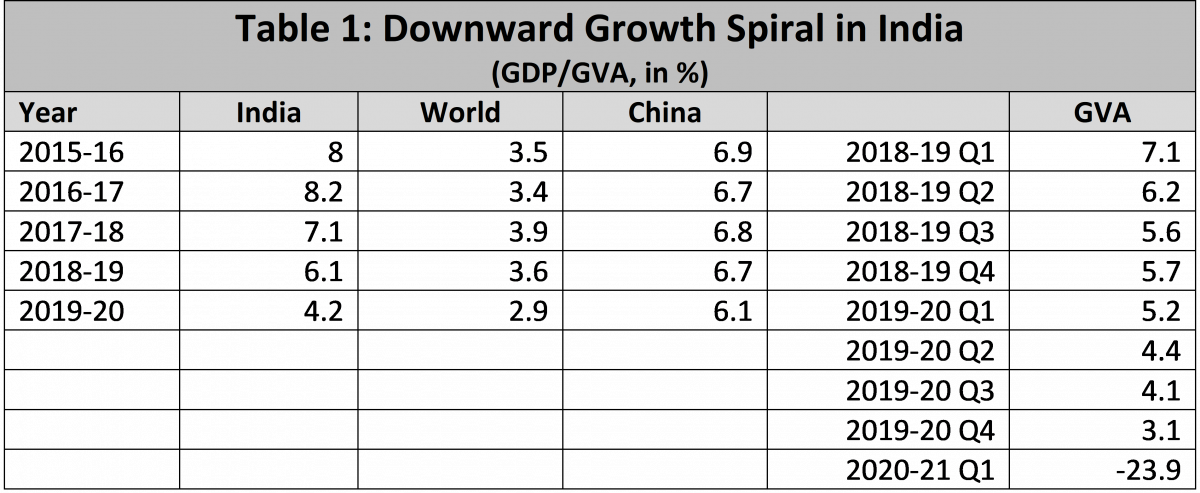
The Indian economy has been on a continuous downward growth spiral each year since 2015-16, with growth (gross value added or GVA) in the last quarter of 2019-20 coming in at the old ‘Hindu’ rate of 3.1% (Table 1).
The structural reforms of the early 1990s put the Indian economy on a high growth track at over twice the ‘Hindu rate of growth’ of 3%-4% at which it was stuck for decades. This growth rate peaked between 2003-4 and 2007-08, as part of a global boom, growing at an average of 8.8% (old GDP series)/7.9% (new GDP series), but more likely at 9.2% according to estimations by the National Statistical Commission (NSC), especially if other indicators are taken into account.
This boom was followed by a sharp fall on account of the global financial crisis (GFC) to 3.9 % in 2008-09 (old GDP series), followed by a robust recovery in 2009-10 (8.5%) and 2010-11 (10.3%), before settling into secular stagnation. The strong recovery of 2009-10 and 2010-11 was followed by the growth crisis of 2011-12 and 2012-13 that contributed to the downfall of the UPA-2 government.
Revised data based on the new GDP series and the estimations of the NSC, however, show that growth had begun to stabilize and recover from 2013-14, i.e., towards the end of UPA-2. This recovery was strengthened briefly with the firing of animal spirits sparked by the installation of a new government at the centre on a mandate of growth and economic reform. GDP growth quickened continuously from 5.5 % in 2013-14 to peak at 8.2% in 2016-17. High frequency indicators, however, lead one to suspect that the extent of recovery is overestimated under the revised GDP series, as this is not supported by a host of alternative indicators that are strongly correlated with growth.
Table 2 has aggregated several data sets all of which are strongly correlated with economic growth. The first column is the high growth years of 2003-04 to 2007-08. The second column aggregates data for the period after the global financial crisis, omitting the year of sharp decline (2008-09) and sharp recovery (2009-10 and 2010-11) that distort underlying trends. The third column aggregates data for the years characterized by extreme growth instability: a sharp fall in 2008-09, a sharp recovery during the next two years, followed by the growth crisis from 2011-12 to 2013-14. The fourth column aggregates the data from the beginning of the recovery in 2014-15 right up to 2019-20.
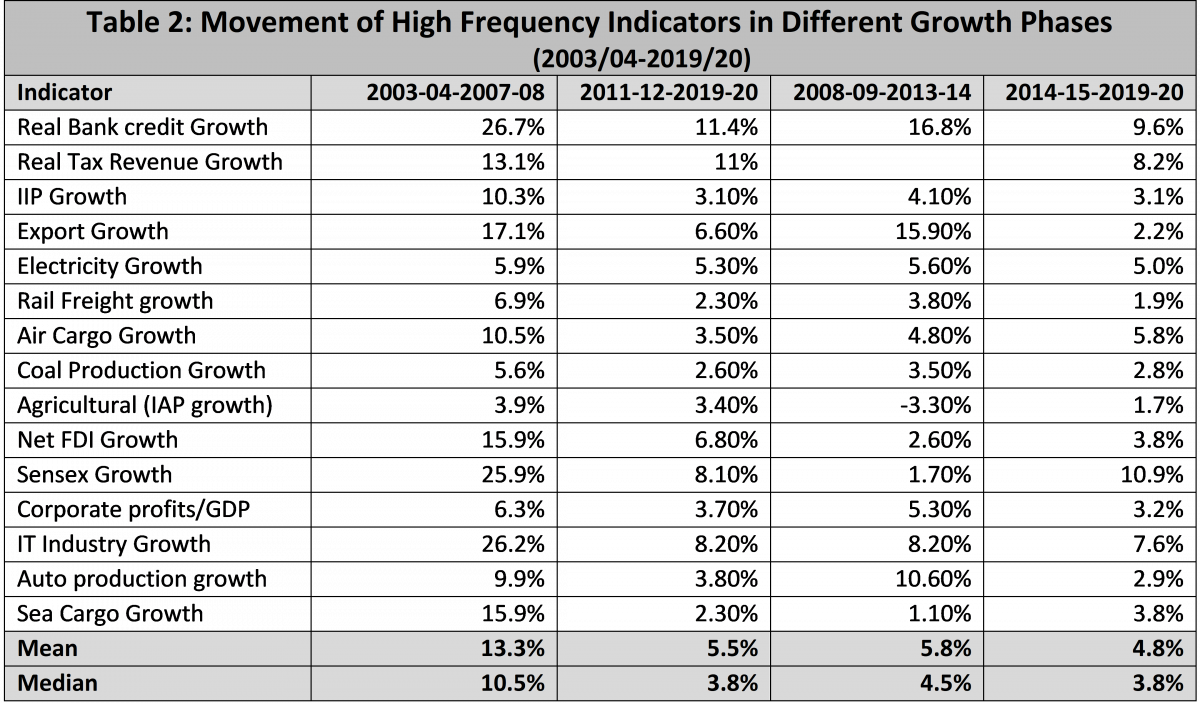
Howsoever you splice and slice the data, Table 2 shows that the Indian economy never returned to the high growth trajectory of 2003-04 to 2007-08. Either the Indian economy grew above its potential during this period, or, more likely, this potential has declined. The Indian economy was clearly afflicted by serious comorbidities at the time it was struck by Covid-19. We need to understand what these were.
The causes of India’s growth acceleration and then slowdown during the past decade are primarily domestic.
Historically, Indian growth rates have moved in the same direction as global growth, except in years of domestic crises. The slight acceleration of Indian growth from 2013-14 occurred at a time at a time global growth, including that in China was stagnant (Table 1). India then overtook China as the world’s fastest growing major economy. But Indian growth started declining sharply thereafter, even as global growth was stabilizing, and by 2018-19 China overtook Indian growth again, and the differential has widened each year since. The causes of India’s growth acceleration and then slowdown during the past decade are, therefore, primarily domestic.
The two big comorbidities afflicting the Indian economy till recently were the collapse of private investment and exports. The major difference in growth during the first and second decades was in the growth engines.
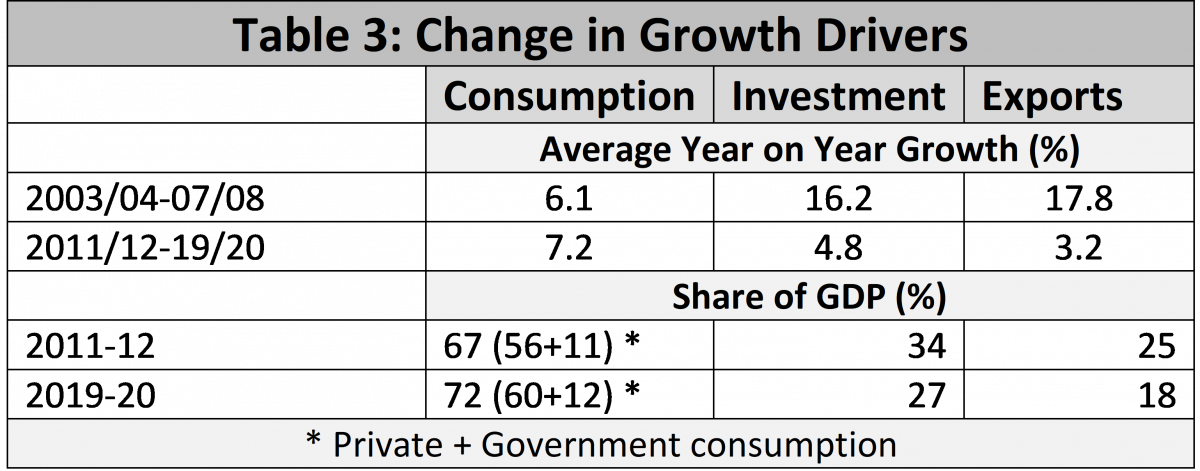
Aggregate economic growth is fired by three engines: consumption, investment, and exports, derived from the equation Y (national income, or GDP) = consumption + investment + (exports-imports). During the period 2003-04—2007-08, all three engines were firing, especially investment and exports (Table 3). Growth in the recent period, however, was driven by just one engine, namely consumption. As a result, the relative shares of these drivers as a proportion of GDP shifted sharply.
Exports were initially hit by the decline in global trade from around 2013-14. While the initial decline can be partly attributed to global factors, the inability of exports to revive possibly reflects a loss of relative global competitiveness, which is a domestic issue. Exports from Vietnam, Myanmar, and even Bangladesh grew at a double-digit average between 2015 and 2019, compared with India’s 3%.
The decline in investment is an entirely domestic matter. This coincided with the increase of non-performing assets (NPAs) in the banking system that began to rise sharply from 2011-12. During this period, gross NPAs of the scheduled commercial banks rose to 8.5% of gross advances in 2019-20 from 2.5%, and the Reserve Bank of India (RBI) expects these to rise sharply to 12.5%-14.7% in 2020-21. This has affected both the demand for credit from over-leveraged businesses, and also its supply by risk-averse banks. It is not just investment that has fallen but also the productivity of capital that is invested, the incremental capital output ratio (ICOR). This was around 3.5 during the high growth period of 2003-04—2007-08 but has averaged around 5 since 2011/12. The productivity of capital has a bearing on international competitiveness.
Demonetization and a flawed GST, which has further complicated rather than simplified the indirect tax regime, also destroyed a large section of the vibrant informal sector of the economy that was a major contributor to both employment and growth. This has also queered the pitch for private investment, along with a general loss of confidence in the predictability and trajectory of economic policy (with interventions inconsistent with the consensus on the long-term roadmap) and in its enforcement by independent institutions at arms-length from the executive.
Large-scale job and income destruction in the wake of the policy response to the Covid-19 pandemic and the absence of a significant fiscal response led to a collapse in consumption growth...
Economic growth firing on just one engine was always unsustainable. Growth in consumption in the absence of robust income growth leads to a draw-down of savings and/or higher debt. The job and income destruction in the informal sector and exports had a lagged impact on the remaining engine, which also started to sputter. The growth rate of consumption at constant prices declined continuously from 8.4% in 2016-17, to 7.7% in 2017-18, 7.6% in 2018-19, and to 6.3% in 2019-20. Private consumption during this period fell even more sharply, to 5.3% from 8.7%.
Large-scale job and income destruction in the wake of the policy response to the Covid-19 pandemic and the absence of a significant fiscal response led to a collapse in consumption growth, to a (-)19.2% in the first quarter of financial year 2020-21 from 5.6% in the first quarter of the financial year 2019-20. Private consumption fell even more steeply, by (-)26.7%. This has sent growth deep into negative territory.
The sharp fall in consumption in the first quarter of financial year 2020-21 is largely attributable to the lockdown of economic activities on account of the nature of actions taken by the government to contain the Covid-19 pandemic. When the pandemic runs its course and economic activity resumes, much of this demand could be expected to return. The IMF’s projection in its WEO of October 2020 of a strong rebound to 8.8% growth in 2021 after (-)10.3 contraction in 2020 is based on this assumption. A return to the status quo ante is, however, unlikely because of pre-existing comorbidities, as the all the three drivers of growth were already sputtering in the pre-Covid-19 period.
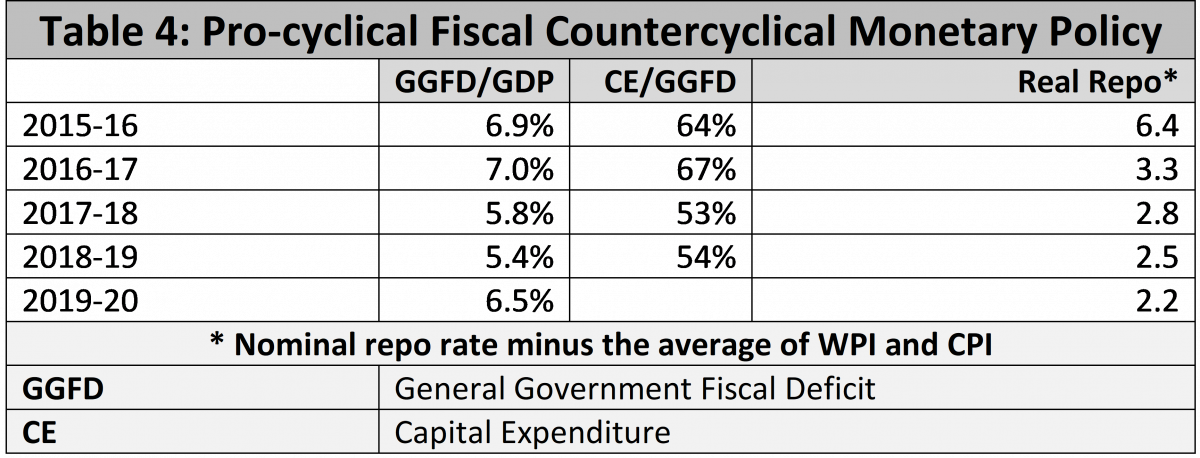
One of the chief reasons for the downward growth spiral was the absence of an effective macroeconomic policy response, in particular the absence of any significant fiscal response. Macroeconomic policy relied almost entirely on monetary policy, with fiscal policy remaining pro-cyclical (Table 4).
While fiscal and monetary policies are alternative tools to attain the same objective, the latter is dependent on effective transmission. These channels were clogged on account of the overhang of bad loans that constrained both the supply of and demand for credit, making monetary policy largely ineffectual. The demand for credit was also constrained by other structural hurdles as observed above.
In these circumstances fiscal policy has a critical role to play to raise incomes to boost consumption, and also to crowd in private investment. Even a highly reputed conservative economist like C. Rangarajan, who has several decades of policy experience in government and the RBI, has argued that in the current circumstances monetization of the deficit is unavoidable.
Table 4 indicates that not only did the fiscal deficit decline along with growth, but that the share of capital expenditure in the GFD also declined. Fiscal compression has also been done at the cost of the states, where much of the social sector expenditure takes place, by holding back their full GST compensation. The recent increase in the deficit is attributable to a decline in revenue rather than to expenditure expansion.
Under a business as usual scenario, the recovery is likely to resemble the Nike swoosh logo, where the recovery is protracted and tends to flatten out instead of returning to the baseline.
The future trajectory of the Covid-19 epidemic is still unclear. But with declining potential growth and all three engines of growth struggling, once the pandemic recedes the recovery is likely to be very weak. The recovery might well be K-shaped, with some sectors recovering before others, but aggregate growth is unlikely to be either V-shaped or even U-shaped. Under a business as usual scenario, the recovery is likely to resemble the Nike swoosh logo, where the recovery is protracted and tends to flatten out instead of returning to the baseline.