The Consumer Pyramids Household Surveys (CPHS) conducted by the private agency, Centre for Monitoring Indian Economy (CMIE), are high-frequency large-scale surveys that have come to be used widely, particularly to assess the short-term changes in the economic conditions of households. They have been often referred to since last year to assess the impact of Covid-19 pandemic policies on the economy. The CPHS first gained popularity after demonetisation in 2016 when its data were used to report on the impact on employment and incomes of people.
The popularity of the CPHS is also on account of the fact that in recent years data from the official surveys have not been released regularly. The Ministry of Statistics and Programme Implementation (MoSPI) tried to withhold the release of Periodic Labour Force Survey (PLFS) data for 2017-18 and was forced to release it only after the report was leaked in the media in early 2019. Data from the 2017-18 survey of consumption expenditure were not released at all. While hardly any data have been released by the National Statistical Survey Office (NSSO) or any official agency that capture the impact of the Covid-19 pandemic on the economic conditions of households, the CPHS data have become available regularly throughout the pandemic. Consequently, data from the CPHS have been used to study a wide range of socio-economic issues including unemployment, household incomes, the slowdown and revival of demand for different kinds of goods and services, and the differential impact across gender and social groups during the period of the pandemic.
Given the popularity of the CPHS, it is important to examine the quality of data being produced.
Another attractive feature of the CPHS surveys is that while the NSSO conducts a survey on a particular subject only once in a few years and releases the data after a long delay, the CPHS surveys are conducted continuously, with households being revisited once every four months. The full CPHS dataset with information on each survey household, is made available to subscribers a few days after the completion of a four-monthly cycle (or “Wave”, as the CMIE calls it). The CMIE also makes available some monthly estimates while a particular Wave of the survey is still underway. These are typically released to address burning issues and are widely cited in the media.
Given the popularity of the CPHS, it is important to examine the quality of data being produced. In this article, we look at the methodology of the CPHS and examine the data from the surveys. In particular, we focus on the collection of data on employment, which is the most widely used part of the CPHS.
1. The CPHS
The CPHS comprises surveys of households living in about 174,000 sample houses (about 111,000 rural and 63,400 urban) spread across most states in India. The sample is surveyed repeatedly in four monthly Waves. Within a Wave, a roughly equal number of households are surveyed every month. Unit-level data from the surveys are provided by CMIE for a fee. The data are divided into four modules that can be subscribed to separately. These include a module on basic demographic and employment-related data (“People of India”), a module on consumption expenditure of households (“Consumption Pyramids”), a module on household incomes (“Income Pyramids”) and a module on assets, investment, debt and consumer sentiments (“Aspirational India”). We use here data from the People of India module, for which we had a subscription.
Our assessment...is that there are serious problems with the sample design and survey implementation of the CPHS.
The CPHS website is the primary source of information on survey methodology for the CPHS. The website has a section called “How we do it” that contains four documents related to survey design, three documents related to survey execution and several documents on questions, indicators and classifications. All these are available to all registered users irrespective of whether they have a subscription to the data or not. In addition, CMIE maintains a website to especially disseminate statistical estimates related to the unemployment situation in the country. This website has daily, weekly and monthly estimates on the employment situation and a brief discussion of the survey methodology. CMIE organises regular seminars to explain the various methodological issues. These are an important resource and can be accessed on CMIE’s YouTube Channel.
Our assessment – based on a detailed review of the survey documents and analysis of data from the People of India module—is that there are serious problems with the sample design and survey implementation of the CPHS. The data on some of the key variables produced through these surveys have glaring anomalies. In particular, we find that the survey design and its implementation is such that it tends to exclude households that are poor, mobile and belong to marginalised communities. 1 Similarly, other scholars have argued that the CPHS is biased towards better-off households (Dreze and Somanchi, 2021a; 2021b). We also find reasons to believe that the canvassing of the survey lacks rigour. At the end we highlight the areas in which the design and implementation of the CPHS needs to be improved if these surveys are to become a credible source of data on socio-economic conditions of households in India.
2. Survey Design and Implementation
Poor, incomplete and ever-changing documentation
Any large-scale survey requires a structured questionnaire, a schedule or format for recording the data obtained through replies to questions, and an instruction manual for investigators that explains different concepts and provides clear instructions about how to carry out the survey. The surveys that are conducted repeatedly should have these documents for every individual round—even if in digital format—so that changes that are made in different rounds are recorded and made clear to investigators as well as users of the data.
None of this is available for the CPHS. The CPHS use a smartphone-based application for conducting the survey. But the application is not accompanied by any survey schedules, questionnaires or instruction manuals (See Vyas 2020b). The documentation on the website is not Wave-specific and changes made between Waves are not properly documented. The documentation also keeps changing, with additional explanations provided whenever a gap is pointed out. It is usually implied that these explanations apply to all the past data.
“Description of indicators” is the most important part of this documentation. Under this section on the CPHS website, all the variables on which data are collected are listed and a detailed discussion of the concepts used for each variable is provided. It also provides the classification schemes used in the data. This documentation is written for the users of the data and explains what the investigators have done. It is not addressed to the investigators and is not written as instructions meant to be used in the field.
In this section, for each item, a “Question construct” is also provided, which is supposed to be the question that the investigators use to solicit the required information. However, for many items for which data are collected, these questions are vague and are likely to be meaningless for respondents. For example, the question construct for “employment status” is simply, “What is the employment status of the member as of today?” This is surely not a question that can be asked of a respondent who is not aware of what the term “employment status” means. The CPHS website has a 1400-word description explaining the meaning of each of four categories of the employment status: “employed”, “unemployed, willing to work and actively looking for a job”, “unemployed, willing to work and not actively looking for a job”, and “unemployed, not willing to work and not actively looking for a job”.
The CPHS use a smartphone-based application for conducting the survey. But the application is not accompanied by any survey schedules, questionnaires or instruction manuals...
If we go by the description, finding out which of the four employment status categories is applicable to a member of a household would require asking the respondent about the main activities in which the person was engaged on the day of the survey or on the preceding day and deciding whether any of the activities the person was engaged in constituted an economic activity. For persons who were not engaged in any economic activity, it would also require asking whether they were on leave but had the option of returning to work and whether they went looking for work. Further, for those who did not work and did not go looking for work, the respondent would have to be asked whether they were willing to work on the previous day. The question construct provided on the website does not cover any of these aspects on the basis of which employment status is supposed to be determined.
Instead of the survey schedule, subscribers are provided images of the data capture screens of the survey application that is used by the surveyors for recording the information. It should be noted that neither the full description of variables being recorded nor the questions are displayed on the data capture screens (presumably because of the limited screen space available on smartphones). Many data capture screens contain an empty table with some notes about how the information should be entered and what kind of information is accepted by the application. In only a few of the simplest screens is a specific question (for example, “Does the household have access to electricity?”) spelt out. In more complex screens that have a table in which several items of data are to be entered, no specific question is mentioned. It seems likely that in the absence of full documentation, the survey investigators take their own decisions in the field or make do with ad hoc advice from their supervisors.
Confusing households with houses
Although referred to as household surveys in the documentation, the CPHS are surveys of people living in sampled houses. The sample is designed to create a panel, with the same houses selected for repeated surveys. The entire CPHS documentation incorrectly uses the word household to refer to houses. This is the cause of much confusion. In CPHS Waves since 2016, even if all persons living in a house change, the sampled house is treated as the same household, though it is marked that all the members have changed.
The definition of a household used in the CPHS is very different from the way households are defined in official surveys like those conducted by the NSSO. In the NSSO surveys (and in the Census and many other large-scale surveys in India), a household refers to a group of people who normally live together and eat their meals together (commonly formulated as “eating from a common kitchen”). It may be noted that while this definition uses eating from a common kitchen as a key condition, the existence of a physical structure that is used solely as a kitchen is not a requirement.
The CPHS documentation does not provide a clear method for identifying houses. In a presentation that is available on YouTube, Mahesh Vyas, the CEO of CMIE and one of the most prominent faces behind CPHS, stated that in the CPHS a household is defined by the existence of a physical structure in which a group of people live and there exist physical structures and facilities (such as a kitchen, a verandah or an electricity connection) that are shared by this group of people. He stated that households that did not have such shared physical structures like a kitchen, for example “nomadic households”, were not included in CPHS.
The method of selection of sample houses
A sample survey requires the identification of a definite sampling frame from which a randomised selection of a sample is done. Randomisation has a specific meaning in statistics and does not mean arbitrary selection. A random sample can be used to make estimations for the population defined by the sampling frame with a measurable level of accuracy.
In large-scale household surveys in India, it is common to use multi-stage sampling. Typically, in these surveys, a set of villages/urban blocks (first stage sampling units) are first selected through a process of randomisation from a list of all villages/urban blocks in different parts of India. Then, a list of households is prepared in the sampled villages and urban blocks. This forms the sampling frame for the second stage from which sample households are selected through a properly designed process of randomisation. Unless the sample selection at each stage is based on a definite sampling frame and is conducted using a properly designed process of randomisation, the estimates would have an unmeasurable level of accuracy.
The CPHS also use multistage sampling for selecting sample houses. When the original sample for CPHS was selected in 2014, the country was divided into what CMIE called “Homogeneous Regions”. Within each Homogeneous Region, villages and census enumeration blocks in urban areas—the first stage units—were randomly selected from the list of villages and census enumeration blocks taken from the 2011 census (Vyas 2020d).
Unless the sample selection at each stage is based on a definite sampling frame and is conducted using a properly designed process of randomisation, the estimates would have an unmeasurable level of accuracy.
However, in the second stage, for selection of a sample of houses in these sampled villages and urban blocks, the CMIE used a method in which the sampling frame was undefined and the process of selection of houses was not randomised in the sense of every house in a given village/block having an equal probability of selection. Instead of first creating a list of households and then selecting a sample from the list, the team picked a random number (say, n) between 5 and 15 and then, starting from one end of the main street of the village/urban block, selected every nth house until 16 houses (the sample size in each village/urban block) were selected. It is only if the main street was exhausted before 16 houses were selected that the sampling was continued in the “inner streets” (ibid.).
Such a method of sampling is likely to result in three sets of problems.
First, habitations in most villages and small towns in India typically have haphazard clusters of houses rather than sequential clusters of houses created according to a municipal plan. It is common for villages to have multiple clusters with each cluster having a predominance of some castes. In such villages, what is referred to as a “systematic random sampling process” in the CPHS documentation would inevitably become a process of arbitrary selection of houses based on an arbitrary imposition of a sequence at the time of sample selection.
Second, even if a uniform method of establishing a sequential order can be created, it can be shown that applying the CPHS method for selection of houses would mean that the probability of a selection of houses within a village/urban enumeration block will not be equal for all the houses. 2 The method of selection used in the CPHS is such that a house is selected only if it is among the first 16 multiples of at least one of the 11 numbers between 5 and 15. Given this condition, among house numbers 1 to 240, 148 numbers are such that they are not among the first 16 multiples of any of these numbers. Thus 61.67% out of first 240 houses will have no chance of being selected in the sample. Among house numbers 1 to 240, 33 numbers are among the first 16 multiples of only one number between 5 and 15. These houses, therefore, will have a probability of selection equal to 1/11. Similarly, the probability of selection will be 2/11 for 42 houses, 3/11 for 10 houses, 4/11 for 6 houses and 5/11 for 1 house. Finally, houses beyond number 240 would have a zero probability of selection. The method of selection of sample houses in CPHS is therefore such that even if a sequential order can be created to list the houses, only a small percentage of houses have any chance of selection in the sample, and even among them, the probability of selection is unequal among different houses.
Given that it is common that the main/central parts of villages comprise houses of upper caste/wealthier households, such a sample would have an over-representation of houses in which such households live. Households belonging to marginalised social groups, because of historical practices of exclusion and discrimination, typically have their houses on the fringes of the villages or in settlements that are separated from the central/main habitation of the villages. Such households are likely to be under-represented in the sample (See also Dreze and Somanchi (2021) about this).
The method of selection of sample houses in CPHS is such that ... only a small percentage of houses have any chance of selection in the sample.
Furthermore, the method of conducting the survey is such that households that are mobile are likely to be missed and dropped. The CPHS is conducted in a village in a single day. If members of a sample household are not available on that day, the house is missed. If a household is not available in three consecutive Waves, it is dropped from the sample. This is likely to result in much greater attrition among rural households, households that are more mobile and households in which all adult members go out to work. In 2017, the entire town of Singrauli was dropped from the sample because the sample primarily comprised houses that faced frequent transfers, migrant workers and truck drivers on the move (Vyas, 2020a, p. 7).
Finally, the CPHS documentation is silent about how new households are selected for addition to the sample to compensate for the attrition over the years. A significant number of households—about 30% of the total sample in the latest Wave (Jan-Apr 2021)—have been added after the original selection in the first wave. Of these additional households, 19.3% were selected in villages/urban enumeration blocks that have been part of the survey since the first Wave and 10.7% were selected from villages/urban blocks that were added later to the survey.
Computation of sample weights
Despite the fact that the households are selected with different probabilities (and some households are excluded at the time of sample selection, missed at the time of conducting a survey or dropped from the sample because of being too mobile), all households covered in a stratum (the “Homogeneous Region” for the rural sample and a town for the urban sample) are pooled and given an equal weight (Vyas 2020c). As a result of this practice, the usual statistical estimators based on the weights provided with the CPHS data (equal for all households in a stratum) are biased.
In addition, in the absence of a definitive sampling frame the weights are based on crude projections of a population for rural areas of each district and for each town. 3 A sampling frame gives an actual count of all households. Since the CPHS do not create a sampling frame at the second stage, they have to rely on projections. These projections are likely to be crude because given the lack of availability of data at such a high level of disaggregation, changes in fertility and migration rates are not accounted for.
When some households are missed during the survey, the weights of other households in the stratum (which are more likely to be available for surveying) are increased to compensate for the fall in the response rate. As we have discussed, since the process of conducting the survey is such that rural households, mobile households and households with all working members are likely to be missed more than others, such a process would further contribute to distorting the weights.
In May-August 2020, the response rate dropped sharply due to the Covid-19 lockdown. The CPHS had to be conducted as a telephonic survey. During this period and particularly for the May-August 2020 Wave, the weights of households covered were increased significantly to account for low response rates. In many cases, this increase in weights for all-India estimates was done across Homogenous Regions and states. In other words, a low response rate in some states was compensated by increasing the weight of the sample in other states.
Finally, in computing the weights for all-India estimations, regions that are not covered in the survey are compensated by increasing the weights of households in some other regions. This is done in an arbitrary manner and the documentation gives explanations like this one for doing so:
all the strata of Andaman & Nicobar Islands, Arunachal Pradesh, Manipur, Mizoram and Nagaland are mapped to the Darjiling-Koch Bihar strata of West Bengal. This northern tip of the state is similar to the states that are not surveyed (Vyas, 2020c, p. 25).
Similarly, parts of Delhi that are outside the Municipal Corporation boundaries and account for 32% of Delhi’s population are not covered under CPHS. These areas are mapped to Allahabad and Lucknow because, according to the CMIE,
The Lucknow-Allahabad Homogeneous Region has a similar north Indian culture, it is urban and its medium and small towns are expected to have considerable similarity with the medium and small towns of Delhi (Ibid., p27)
The sampling weights for urban households in Allahabad and Lucknow have been increased for the all-India estimates and the weights of households from Delhi’s municipal area are increased for the state-level estimates to account for areas in the outskirts that are not covered in the survey.
Such arbitrary manipulation of sample weights to blow up the estimates to cover parts of the country that are excluded from the survey does not make sense.
Survey implementation
The CPHS are conducted by a team of about 200 investigators (Krishnan 2021). Given the sample size of about 174,000 households covered in each Wave of four months, this implies that each investigator, working 25 days a month, would have to interview over eight households every day and a team of two investigators would have to cover a village/urban enumeration block in a single day. The CPHS involves collecting information on about 300 variables from each household. This includes very detailed information on occupations and employment for each household, time use data for all household members, consumption expenditure, incomes from different sources, assets, investments, debt and consumer sentiments. Even if the investigators work non-stop for eight hours every day (excluding the time spent on travel to the location, going from one sampled house to the other, and finding the respondents and getting them to sit for an interview), it would mean that the investigators obtain answers to five questions every minute.
There are also other questions about the implementation of such surveys. How is it that respondents are willing to participate in the survey, and give time for it once every four months, year after year? Isn’t there an exhaustion among sample households? What incentive do they have to give so much time repeatedly for a survey like this?
Even if the investigators work non-stop for eight hours every day ... it would mean that the investigators obtain answers to five questions every minute.
Since last year, because of the Covid-19 lockdown, several Waves of the CPHS have been implemented by conducting the interviews telephonically. Despite this, data on all the variables are reported from each household. How is it possible to conduct a telephonic interview in which information is collected on about 300 variables covering topics that require such in-depth interviewing? How long does each telephone call take? Are the respondents willing and able to engage in long telephone calls that would be required for such interviewing? Are the respondents willing to provide details of their income, assets, borrowings, consumption and employment to telephone callers from a private company?
3. Some observations on the data on employment and occupations
How do the data on employment from the CPHS compare with the data from the Periodic Labour Force Survey (PLFS) conducted by the NSSO? Before we present the comparison of occupational structures from the two surveys, it is important to note the methodological differences between the two in the way data on occupations are collected.
First, the CPHS use a conceptual framework that is markedly different from the PLFS. In part, this is because the CPHS involve repeated surveys of the same households every four months year after year, unlike the PLFS which is conducted annually in rural areas and quarterly in urban areas, and does not involve repeatedly surveying the same households beyond one year.
Second, the reference period for which data on employment are collected in the CPHS and in the PLFS are not comparable. In the CPHS, a person is considered employed if she was employed the day before the survey (with the exception that persons who may be on leave from work on that day but have secure employment to go back to are considered employed). The CPHS record only one occupation for each person — the occupation that accounted for the highest amount of time allocation. The PLFS uses multiple measures of employment status. These are based on information on multiple activities that members of a household are engaged in over a whole year before the survey and on each day during the week preceding the survey. To maintain broad consistency between the two surveys, we use only the "usual principal activity" status from the PLFS and disregard the subsidiary activities. Since the PLFS data are for a whole year, to deal with seasonality in the CPHS data we pooled the data from three Waves of the CPHS to cover a year.
The CPHS data are a rather poor source of information on women’s employment...
Third, the two surveys use different schemes of classification of industries and occupations. While the PLFS uses the National Classification of Occupations to classify occupations and the National Industrial Classification to classify sectors of economic activities, the CPHS has its own schemes of classification that are not as granular. The comparison of occupation between CPHS and PLHS requires that the occupations be aggregated into broad occupational groups.
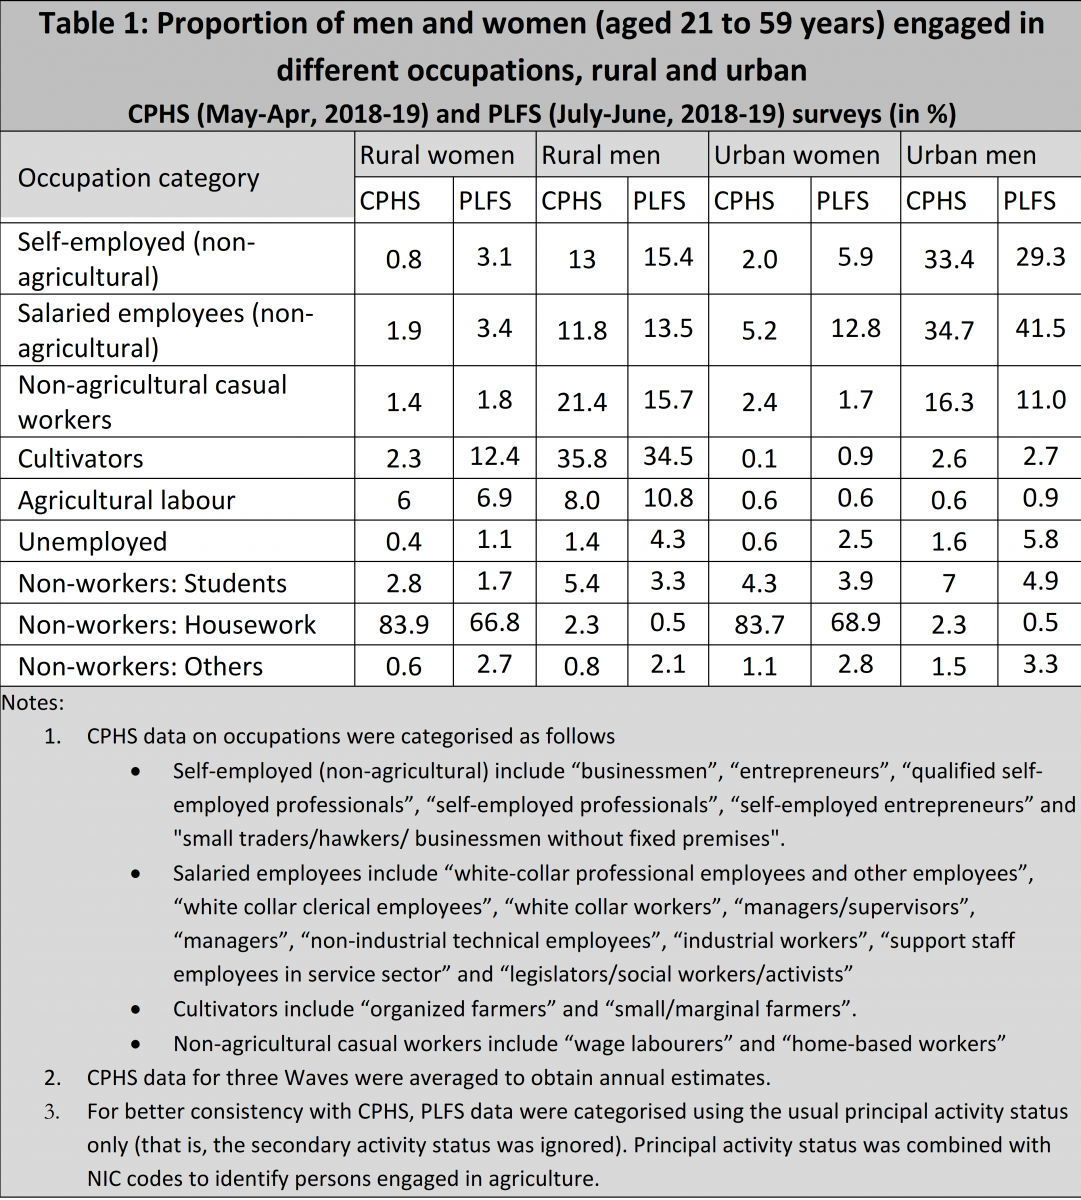
Table 1 shows broadly comparable estimates of occupational structures for rural and urban men and women in the age group 21 to 59 from the CPHS (May 2018-April 2019) and PLFS for 2018-19. The most important point that emerges is that the CPHS underestimate women’s participation in economic activities. 4 See also Abraham and Shrivastava (2019) for a comparison of employment data from PLFS and CPHS and discrepancies in respect of women’s employment. In the CPHS data, housework is recorded as the only activity for 84% of rural women and 84% of urban women in the age group 21 to 59 years. In comparison, in the PLFS housework was the usual principal activity status for 67% for rural women and 69% for urban women. Far fewer rural women were identified as cultivators in the CPHS (2.3%) than they were in the PLFS (14.2%).
There has been a long debate in India on the difficulty of capturing women’s work, the need for extra probing and direct interviewing of women for an accurate recording of their work status. In fact, the Census and NSSO surveys have been criticised for under-estimating women’s contribution to household enterprises including agriculture. The CPHS estimates are even lower than the NSSO estimates. This is very likely to be a result of poor probing by investigators who are required to survey about eight households every day and collect information on more than 300 variables from each one. Under-representation of poor and marginalised sections in the sample could also be a factor that contributes to low coverage of women workers as work participation rates of women are likely to be higher among such households. CPHS data have been used specifically to look at the impact of the Covid-19 lockdown on women’s employment and earnings (see, for example, Deshpande, 2020a; b). The CPHS data are a rather poor source of information on women’s employment and related aspects.
The trends in the CPHS of occupations of men between 2014 and 2021 are very counter-intuitive and are not consistent with what other data show about the trends in the Indian economy.
Occupational structure for men captured by the two surveys is more comparable though some differences are seen here too. Compared to the PLFS, the CPHS under-estimates the proportion of agricultural workers in the rural workforce and over-states the proportion of non-agricultural casual workers among rural and urban men. Some of the differences in the proportion of workers in different types of non-agricultural occupations could be on account of differences in the classification between the two surveys.
We also explored the CPHS data on occupations of working-age men by looking at the trends in the proportion of men in the age-group 21-59 years who are engaged in different types of occupations. These trends, presented in Figure 1, suggest serious anomalies in the CPHS data on employment.
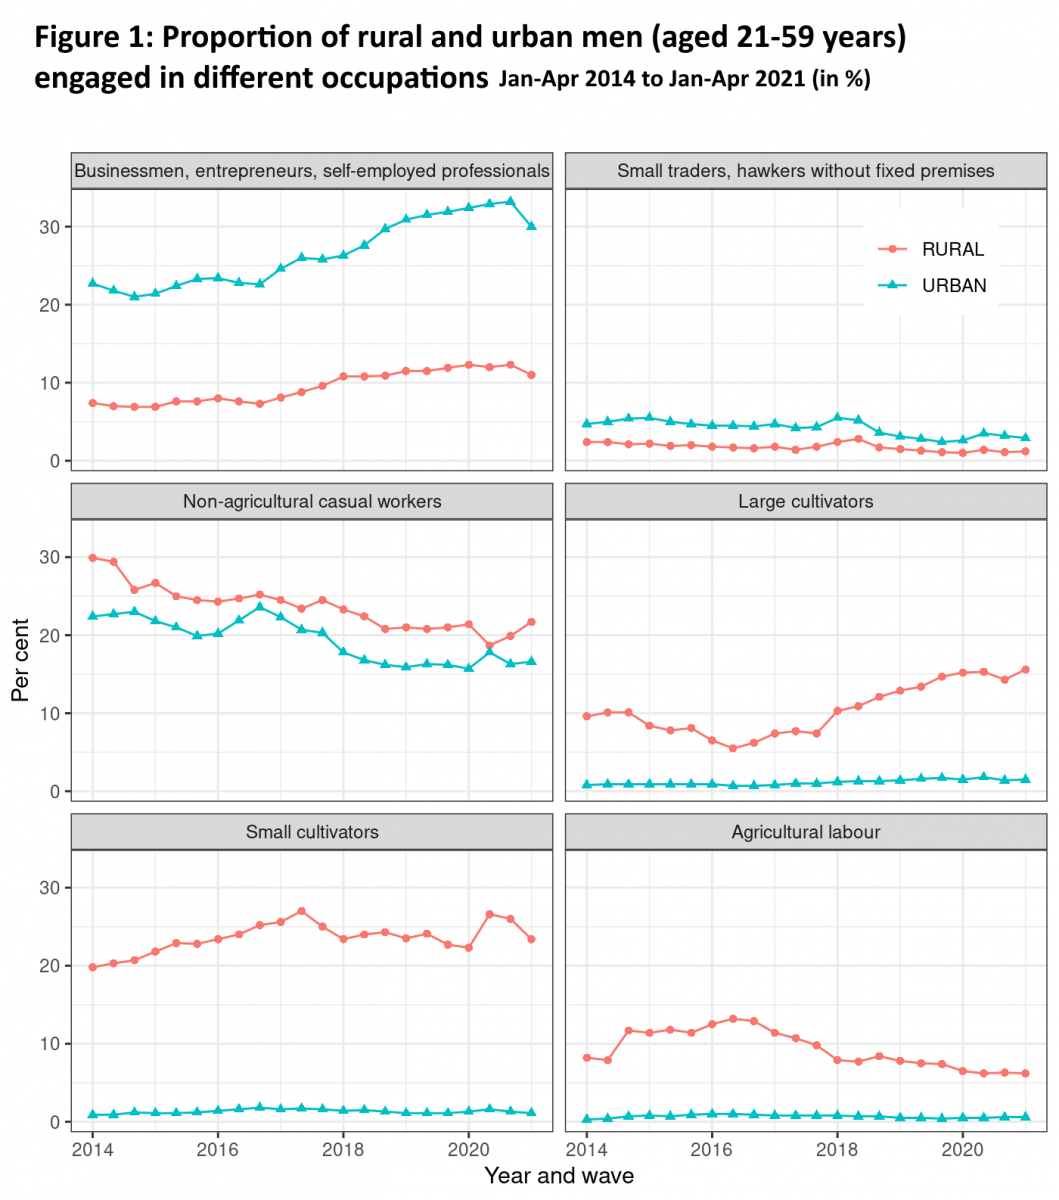
The CPHS data suggest that between 2014 and 2021, there was a significant rise in the proportion of businessmen, professionals and entrepreneurs among urban men and of large/market-oriented farmers (organized farmers, in the CPHS terminology) among rural men. On the other hand, the proportion of urban men engaged in their own informal businesses (hawkers, traders without any premises) and in casual wage employment saw a sharp decline. Similarly, in rural areas, the proportion of small farmers did not rise while the proportion of agricultural workers and non-agricultural casual workers saw a sharp decline.
The trends in the CPHS of occupations of men between 2014 and 2021 are counter-intuitive and are not consistent with what other data show about the trends in the Indian economy. For example, both the Census and NSS data show that there has been a long-term trend of an increase in the proportion of hired manual workers/agricultural workers in the rural workforce and a decline in the proportion of cultivators. There is a vast amount of evidence about the increased casualisation of employment in urban labour markets. The past few years have seen a considerable rise in economic distress, which is likely to have pushed workers into more casual/informal activities. None of this is seen in the CPHS data.
In fact, if the CPHS trends were to be believed, a vast growth in the proportion of urban entrepreneurs and professionals would be the biggest story of economic change in India over the last few years. In comparison, demonetisation and the Covid-19 lockdowns were nothing more than minor blips.
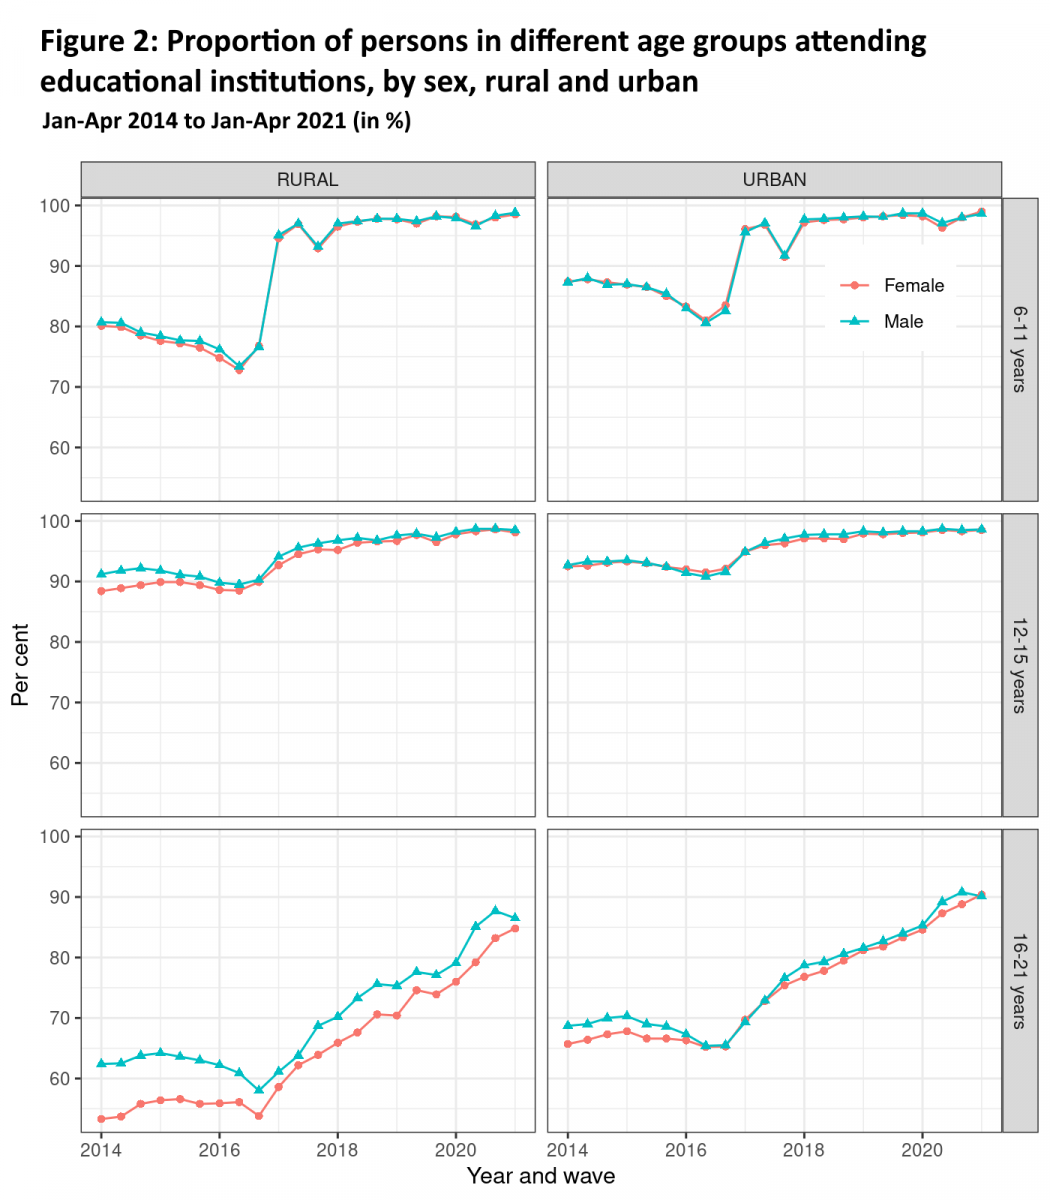
Figure 2, which shows the proportion of students among children and young adults in different age groups, brings out further anomalies in the CPHS data. First, it shows that there was a jump in the school attendance rates of children in the age-group 6-11 years towards the end of 2017. Nothing significant happened during that short period to have caused such a sharp rise in school attendance rates of children except that many new households were added to the CPHS sample during the Waves at the time. Even more strikingly, after this change of sample, the data started showing a steep rise in the proportion of students among men and women, in both rural and urban households, in the age groups 16-21 years and 22-25 years. In fact, in the recent Waves, almost 90% of persons in the age group 16-21 years are said to be studying. If the CPHS data were to be believed, almost everyone aged from 6 to 21 years is a student. While we wish this would be true, unfortunately the reality is very different from what the CPHS are showing.
4. Concluding remarks
The Consumer Pyramids Household Surveys of the CMIE are large-scale longitudinal surveys of people living in sampled houses. These surveys have been covering the same sample of houses thrice a year, every year since 2014. The data from these surveys are released within days of completion of a Wave. In recent years, the regularity and high frequency of data releases have made these surveys very popular for assessing the economic impact of shocks such as the demonetisation and the Covid-19 lockdowns.
While these data have been widely reported in the media and used in many scholarly studies, some concerns have also been raised about the quality of the data and representativeness of these surveys. In this article, we have attempted to present a detailed assessment of the survey design and implementation, and an assessment of the quality of data on some key variables.
Our assessment shows that there are glaring problems in the sample design. The most significant among them are:
- the lack of a definite sampling frame at the second stage of sampling,
- the poorly designed process of selection of houses resulting in likely exclusion of poor, mobile and homeless households, and households belonging to the marginalised social groups, and
- a problematic procedure for computing sample weights, including arbitrary adjustments to cover for the regions where the survey is not conducted and compensate for households that are missed in a round
As a result of these problems of sampling and the method used to compute sample weights, statistical estimators that use these weights are expected to be biased.
The CPHS are conducted by a very small team of investigators. The available documentation does not include enough details about the questions that are used by investigators to obtain the required information, nor about how the complex conceptual framework used for many questions is communicated to the investigators. The documentation does not maintain a Wave-specific record of how the survey was conducted. In such a situation, as investigators seek to cover a large number of households in a single day, it is likely that the interviews do not involve very detailed probing, the investigators fill in information based on past data, and that there are recording errors.
Our assessment of the data on occupational distribution from CPHS shows wide differences from the patterns seen in PLFS data. Given that investigators have little time for probing, the CPHS are very poor in capturing women’s participation in economic activities. Since 2017, the data show a high and increasing representation of businessmen, professionals and entrepreneurs among urban male workers and of large/market-oriented farmers among rural male workers. These trends are more likely to be a result of poor sampling than of real changes in the employment conditions.
If the CPHS has to become a credible survey for obtaining data on the economic conditions of households, its sample design and survey methodology need an overhaul. There is no substitute for using a definite sampling frame at each stage of sampling. All conceptual deficiencies and survey practices that result in the exclusion of poor, mobile and marginalised sections of the population have to be identified and corrected. The implementation of the survey has to be such that investigators have sufficient time to collect the information. All arbitrary adjustments in survey weights to expand coverage beyond what the survey covers have to be dropped. Rigorous documentation has to be prepared for each round and made public. Also, the survey design must incorporate a method of skipping some sample households in each Wave or of systematically replacing households with new ones after a certain number of Waves to avoid survey fatigue among households.
If the CPHS has to become a credible survey for obtaining data on the economic conditions of households, its sample design and survey methodology need an overhaul.
It is important to note that despite all the problems, the CPHS have shown very large increases in unemployment and declines in consumption due to the Covid-19 lockdowns. According to the CPHS, unemployment increased to 23.52% after the national lockdown was announced in March 2020. Similarly, in April and May 2021, when the country was battling the second wave of the pandemic, the CPHS showed that unemployment increased to 11.9%. The head count ratio of population having a per capita monthly consumption expenditure below Rs. 2400 increased by 10 percentage points between December 2019 and December 2020 (Dhingra and Ghatak, 2021).
The sharp increase in economic distress shown by the CPHS data despite an under-representation of the most vulnerable sections of the population in the sample points to the urgent need for the official agencies like the NSSO to undertake properly designed surveys on employment, consumption and other socio-economic aspects, and release the data transparently and promptly. A comprehensive policy response for relief and recovery can only be based on a valid and comprehensive assessment of the impact of the Covid-19 pandemic, which, in turn, requires data collected through properly designed and representative surveys.
In writing this paper, we have benefitted from comments by Abhijit Sen, Chandan Mukherjee and C. Rammanohar Reddy. We are thankful to the Economic Research Foundation for subscription to the CMIE-CPHS data. The authors alone remain responsible for the analysis and views expressed in the paper.
Readers may be interested in seeing the response of Mahesh Vyas of CMIE to this article as also a rejoinder by theauthors, both are published here.