

The gross domestic product (GDP) is widely acknowledged to be the most important measure of a nation’s economic performance. For this reason, a lot of attention has been paid in the recent years to the size of India’s GDP as well as to the rate of growth of the GDP. The media and policymakers have frequently emphasised that (i) India is the fifth largest economy in the world and will soon become the fourth largest, overtaking Japan; and that (ii) India is the fastest growing large economy in the world. From these facts, it seems a simple matter of logic that India will become an advanced (that is, high-income) economy in the next 25 years. But does this conclusion really follow?
Unfortunately, no.
The reality is that an exclusive focus on the size of the GDP and the current rate of growth can be misleading. In this essay, we attempt to understand why that might be the case.
We ask three specific questions:
• What can we infer about India’s economic performance from the size of its GDP?
• What can we infer from India’s rate of GDP growth?
• And what picture is conveyed by India’s GDP per capita?
For our analysis we use data from the World Development Indicators, the Maddison Project Database, and the Penn World Tables.
Size of India’s GDP
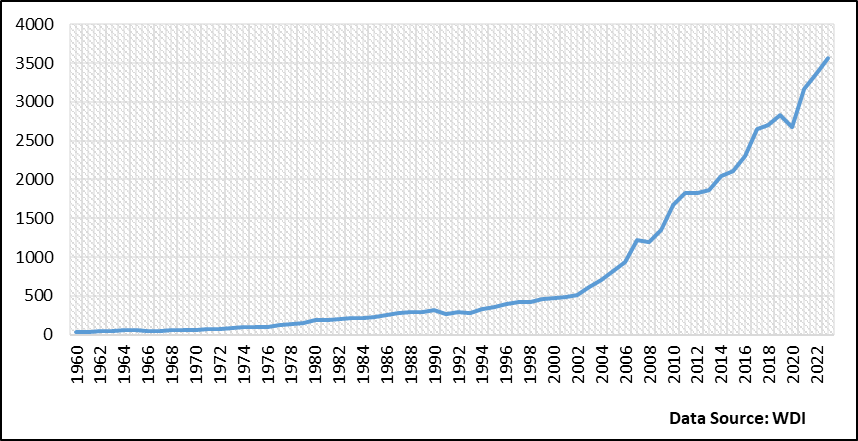
We start by looking at the long time-series of India’s GDP data, both in nominal (that is, current prices) and real terms (that is, constant prices). Consistent data is available from 1960 onwards. Between 1960 and 2023, India experienced a staggering increase in its nominal GDP from less than US$40 billion to US$3.5 trillion. This, in and of itself, is a significant achievement, given the modest beginnings in the immediate post-Independence period.
Consider Figure 1 which shows that India’s GDP (the size of the Indian economy) exhibited a very moderate increase in the first three decades after Independence. Between 1960 and 1990, nominal GDP increased from roughly $40 billion to only $320 billion. However, from then onwards, the economy took -off dramatically, especially from the early 2000s onward.
Figure 1: India’s Nominal GDP, 1960–2023 ($ billion)
While Figure 1 shows how far India has come compared to its own past, it is also insightful to understand how it has performed relative to other emerging market economies (EMEs). Figure 2 compares India’s nominal GDP to a few major emerging market economies such as Argentina, Brazil, Indonesia, Malaysia, Mexico, Russia, South Africa, Thailand, and Turkey, all in US dollars. 1The data for Russia starts only in 1989 i.e. on the eve of the fall of the USSR. Compared to these countries, India has performed astoundingly well. We have excluded China to keep the magnitude of GDP on a similar scale for all countries—its inclusion would massively skew the scale.
Figure 2: Nominal GDP of India and other Emerging Market Economies, 1960–2023 ($ billion)
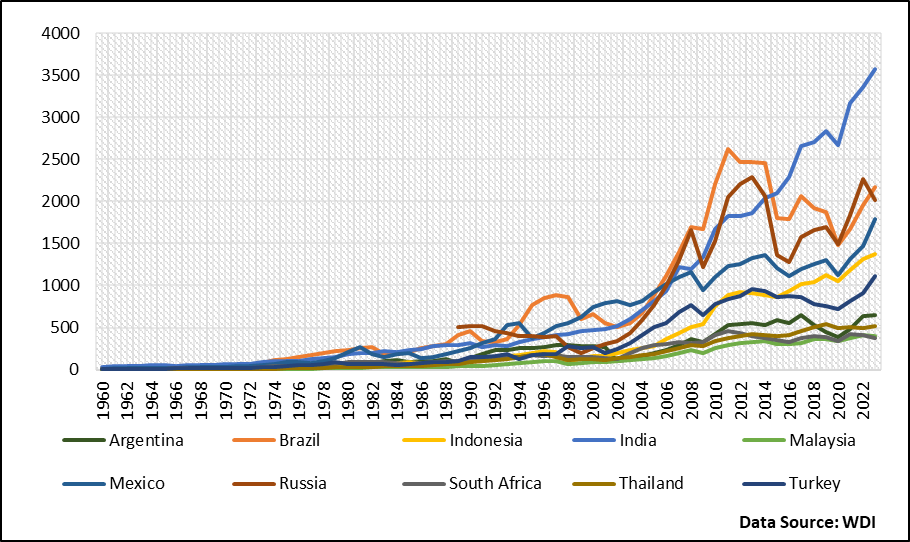
Figure 2 shows that while almost all these countries were at similar levels of GDP in the first few decades of the sample, from the early 2000s, India’s GDP took off sharply, surpassing all the other emerging market economies. While countries like Brazil, Russia, Mexico, and Indonesia also witnessed rapid increases in nominal GDP, India overtook all of them, roughly by 2016.
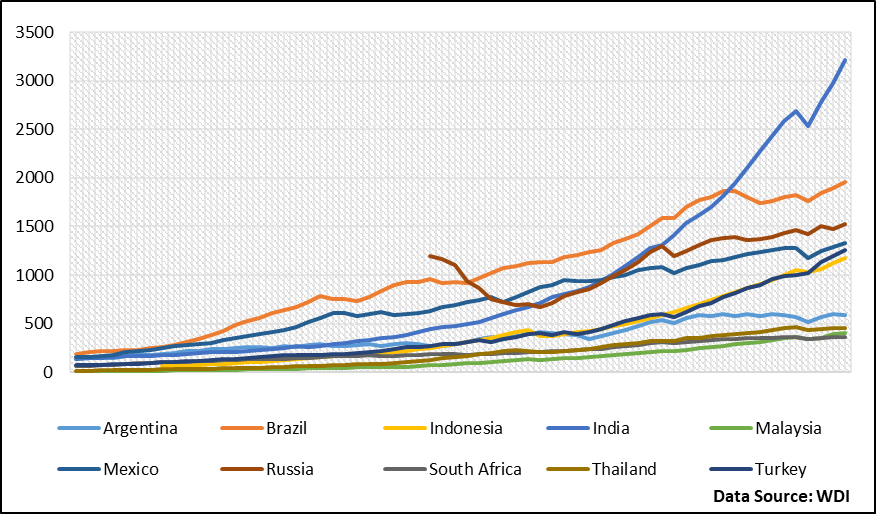
Of course, nominal GDP data is influenced by rates of inflation. So, to understand the movement over time in actual output, we plot real GDP (in constant 2015 dollars) in Figure 3. A similar pictures emerges—all these emerging market economies, including India, start at low levels of real GDP in the 1960s and 1970s but from the early 2000s onward, India’s real GDP grows much faster than the others. By 2014 or so, India surpassed all these emerging market economies.
Figure 3: Real GDP of India and other Emerging Market Economies, 1960–2023 (Constant 2015 $ billion)
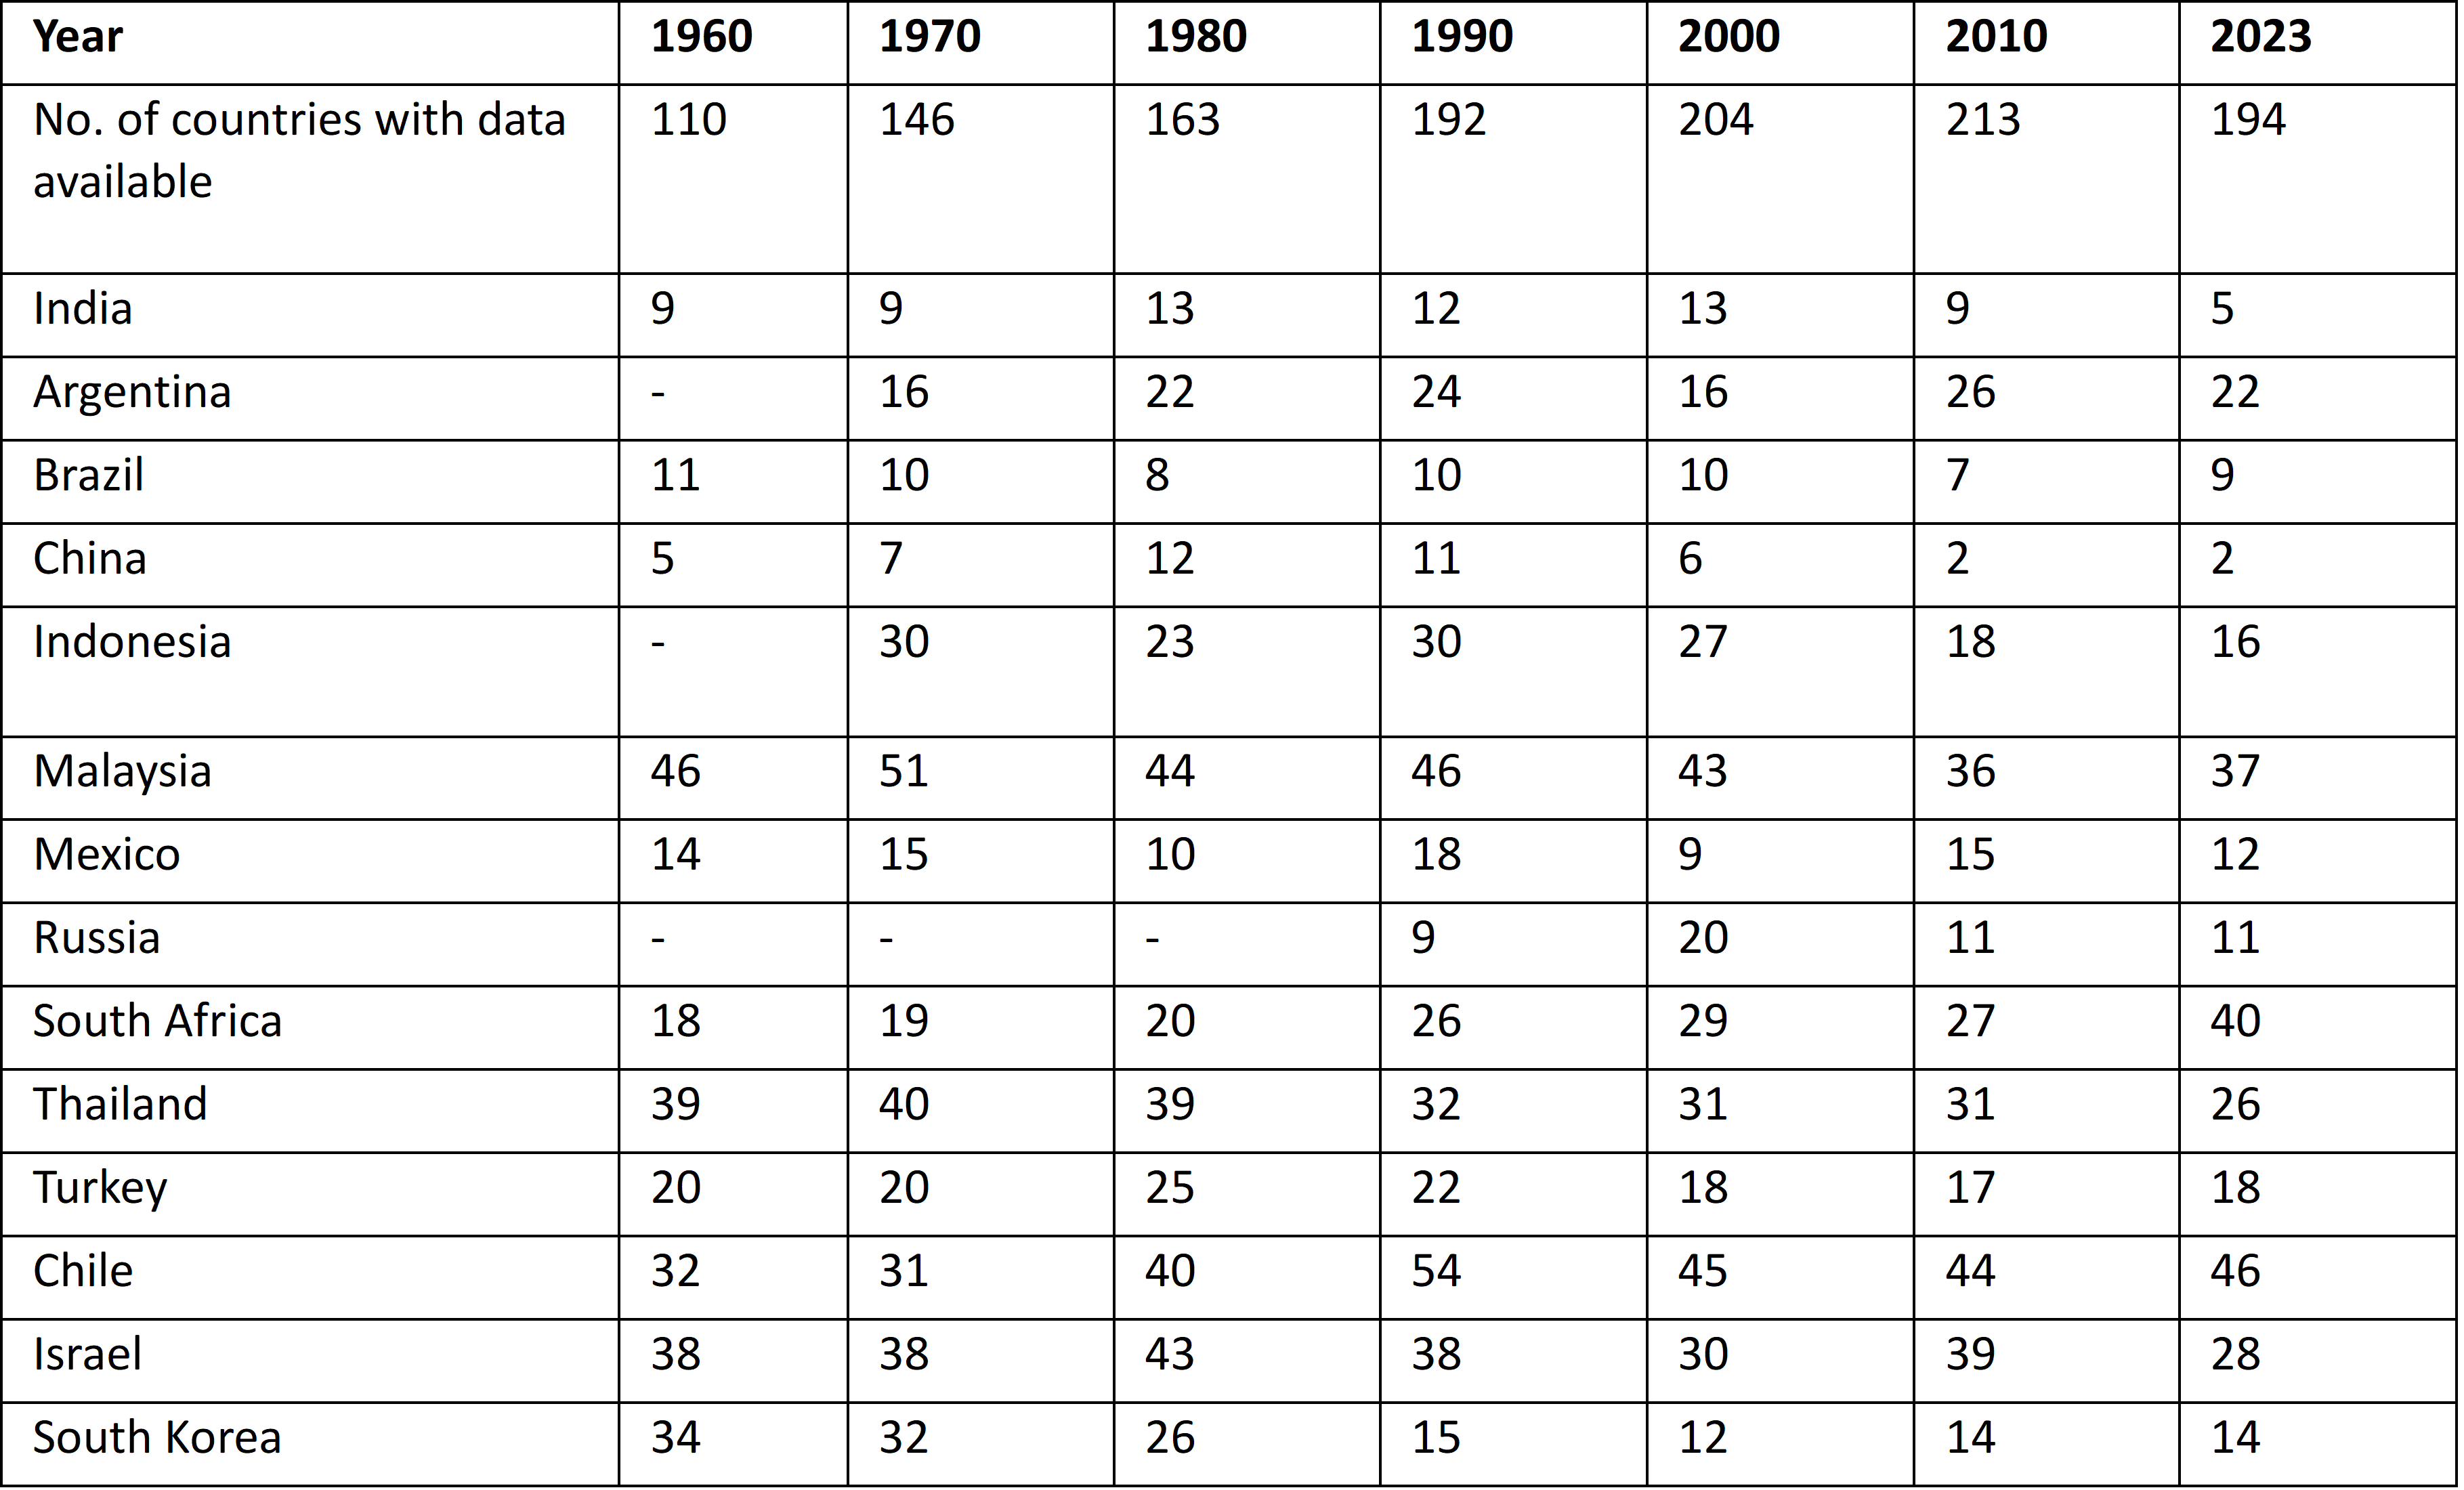
In Table 1 we have provide the rankings for India and other countries based on nominal GDP from 1960 onwards. In addition to the emerging market economies included in these figures, the table also includes Chile, Israel, and South Korea—three countries that started off as emerging market economies and subsequently joined the ranks of high-income countries.
We see that India was ranked ninth in terms of nominal GDP among the countries for which data was available in the 1960s and 1970s. Its position worsened during the 1980–2000 period, but then India switched lanes, leaving behind all the other emerging market economies (except China) and becoming the fifth largest economy in the world by 2023.
Table 1: Ranking of Select Countries Based on Nominal GDP
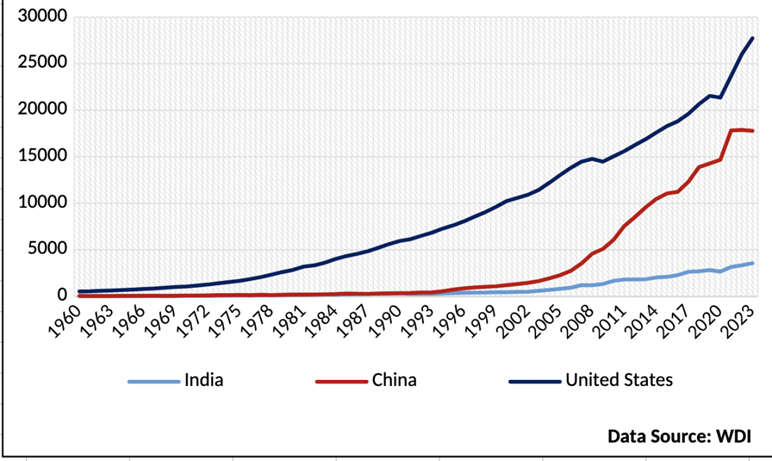
Thus, the increase in the size of the Indian economy has been truly remarkable, especially from 2000 onwards. That said, India remains far behind China, whose GDP exhibited the most dramatic growth during this period among all emerging market economies (see Figure 4). China’s nominal GDP increased from $60 billion in 1960 to almost $18 trillion in 2023. The difference with India in terms of real GDP is equally stark. India also has a long way to go to catch up with the level of nominal GDP of the US. India’s GDP in 2023 was what the US’s was in the early 1980s and China’s was in 2007.
Figure 4: Nominal GDP of India, US and China, 1960–2023 ($ billion)
Rate of Growth of GDP
We now turn to the rate at which India’s GDP has grown over the decades. Whenever we analyse GDP growth rates, we refer to growth rates of real GDP to avoid the impact from inflation. Figure 5 below shows the evolution of India’s real GDP growth rate from 1960.
Figure 5: India’s Real GDP Growth Rate Over Time, 1960–2023 (in per cent)
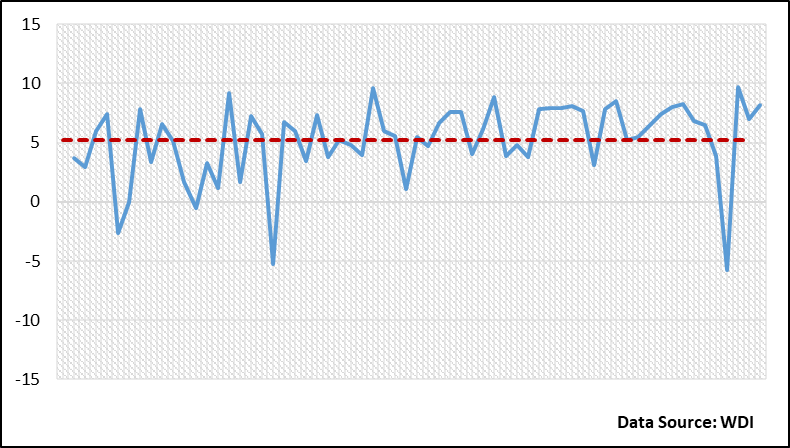
Between 1960 and 2023, the Indian economy grew at an average real rate of 5%. If we focus only on the post-reform period (1990-2023), the average growth rate increases to 6%. Table 2a shows the average growth rates of real GDP for India and other emerging market economies for each decade since 1960. India’s growth was on the lower side (3-4%) in the 1960s and 1970s, and began going up from 1980 onwards. The economy experienced the highest decadal growth in the 2000–2010 period (average 6.8%), which, however, declined after that.
When compared with other emerging market economies, India had one of the lowest growth rates in the 1960s and 1970s. In the 1980s, while its growth rate picked up, it was still behind several other countries such as Malaysia, South Korea, and Thailand. In a comparative sense, the Indian economy started performing much better from the 1990s onward, in part because some of these other countries slowed down. Barring China, India has been the fastest growing economy among the select group of emerging market economies as well as advanced economies (AE) from 1990 onwards (Table 2b). This is a remarkable achievement.
Table 2a: Decadal Real GDP Growth Rate (%) of India and Other EMEs, 1960-2023
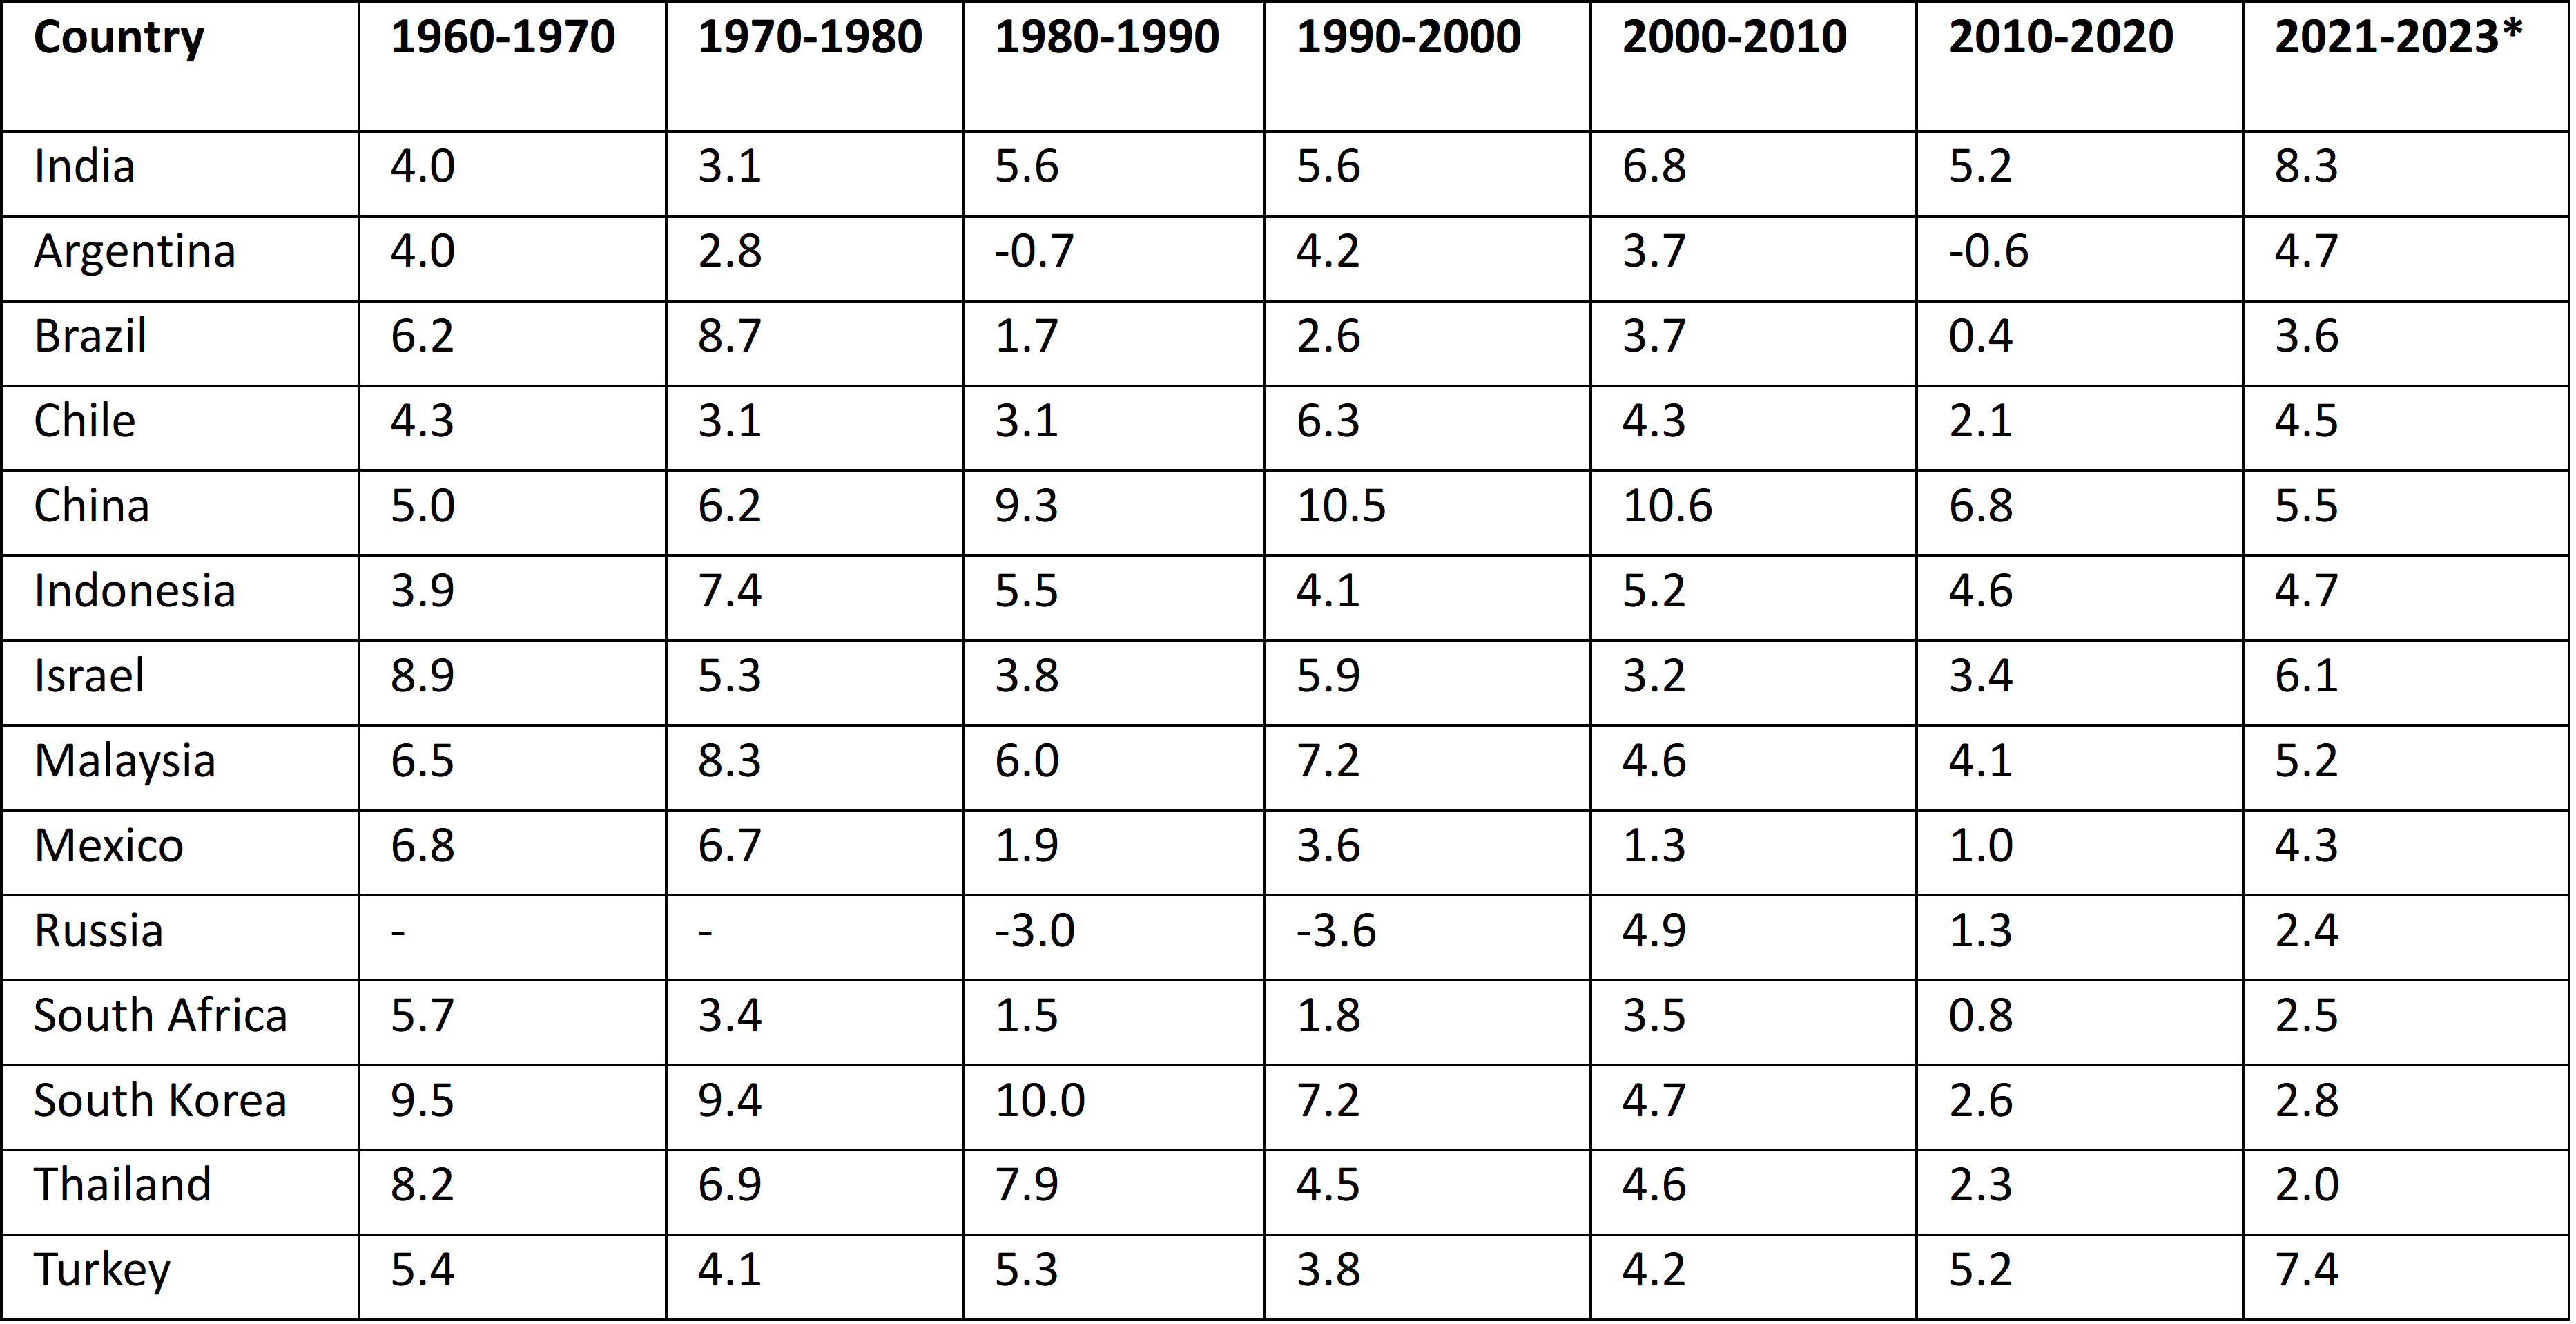
Table 2b: Decadal real GDP growth rate (%) of India and AEs, 1960-2023
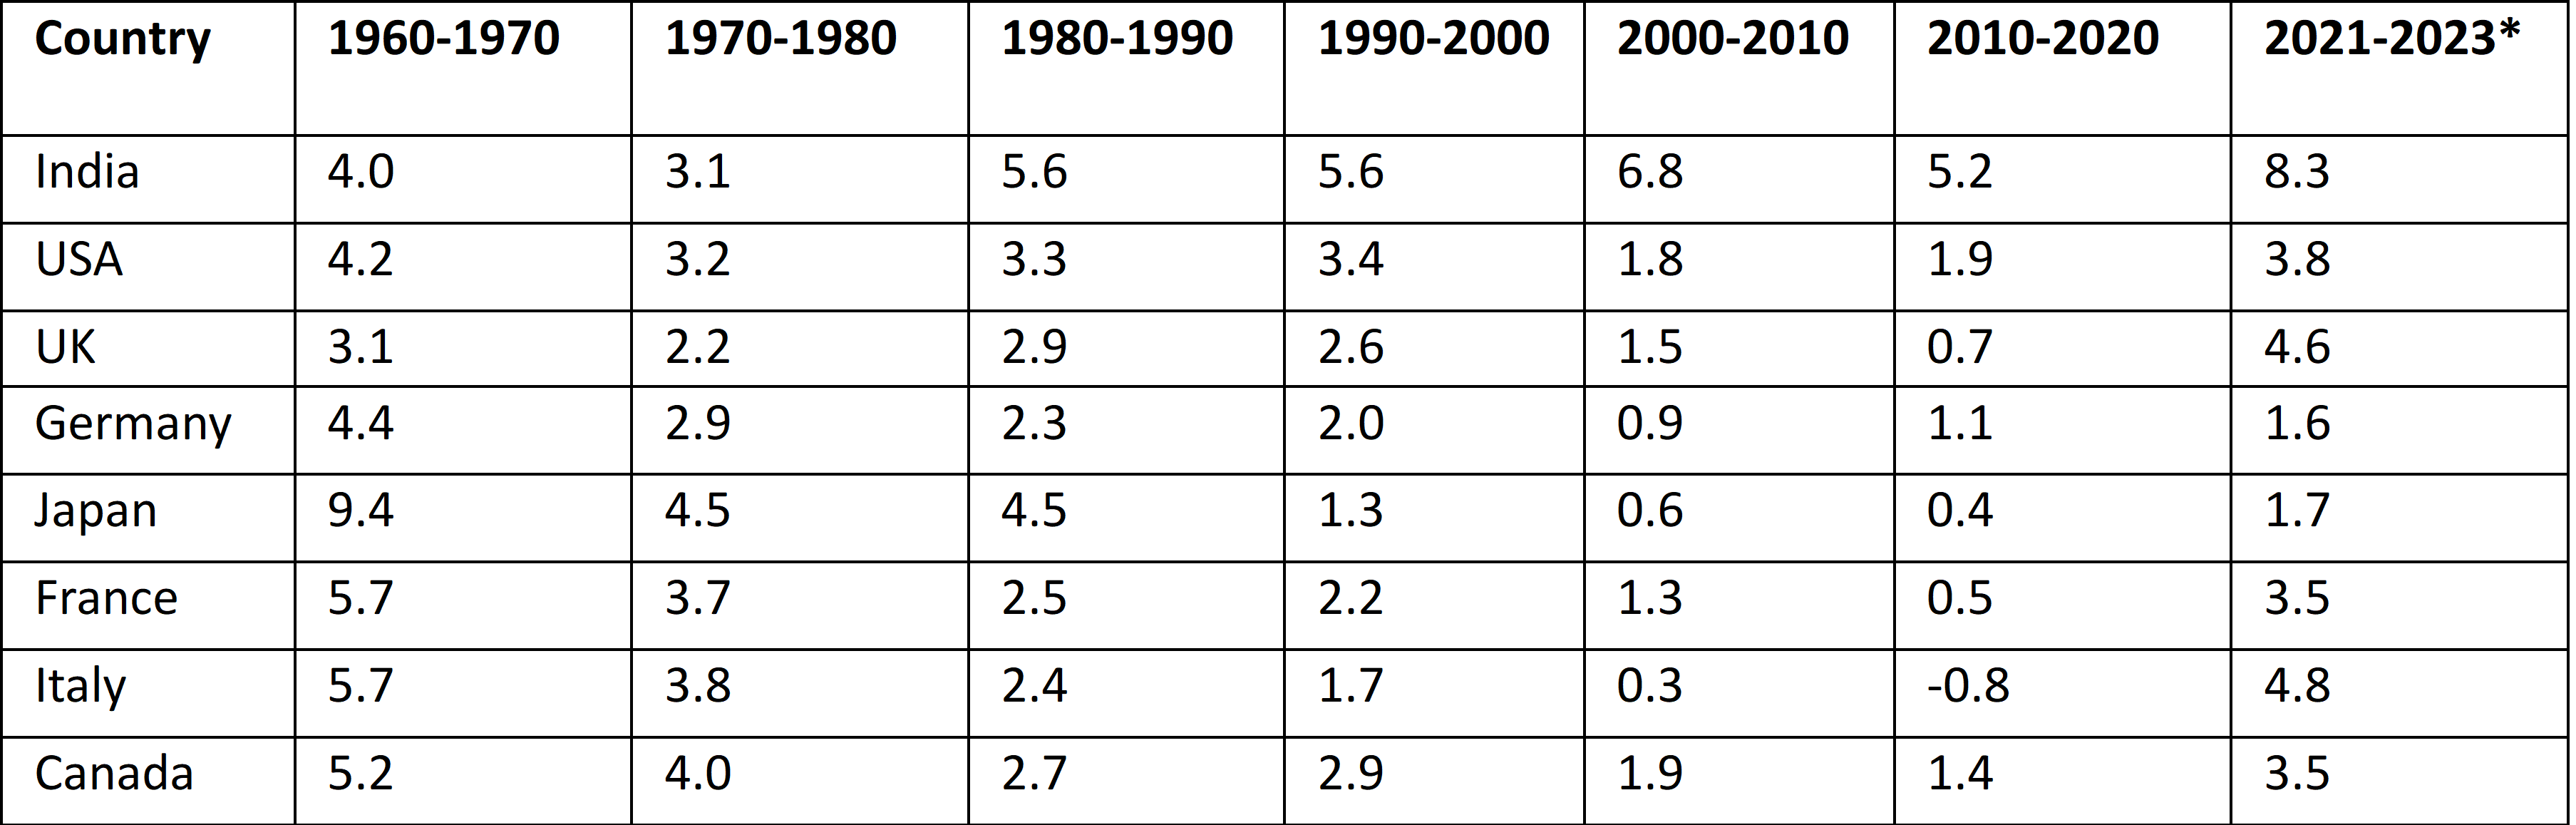
Between 1990 and 2020, while India grew at close to 6%, China grew at an average rate of 9%. From 1960 to 2020, China’s real GDP growth rate consistently surpassed that of India’s. The only period when the Indian economy grew faster than China’s was during the post-Covid years from 2021 to 2023. This is also when India became the fastest growing large economy in the world.
Per Capita GDP
While analysis of the size or growth rate of the GDP helps us understand how big the Indian economy has become over the years or how fast the economy has been growing, it does not say anything about how much the living standards of the people of the country have improved. This is best captured using per capita GDP.
This matters for India because it has the largest population in the world, which means that its output is getting divided among a much larger population than most other countries. In this context, it is important to note that for comparing per capita GDP across countries, we use a measure that is adjusted for purchasing power parity (PPP). 2PPP adjusted data is typically used to compare living standards across countries and hence it makes more sense to use this adjustment for analysing per capita GDP or income data as opposed to the aggregate GDP data. We obtain this data from the Maddison Project Database; which in its latest iteration gives this data till 2022.
The picture that emerges from analysing the evolution of India’s per capita GDP over the last 70 years is much less rosy compared to what we have discussed and it is also more worrying. Between 1960 and 1989, India’s per capita real GDP (in PPP terms) grew at an average annual rate of only 2%. This more than doubled to 4.7% during the period from 1990 and 2022, the years when the Indian economy grew significantly in size.
In 1960, India’s per capita GDP was marginally higher than China’s. By 1970, China had caught up to India’s level. Since then, China’s per capita GDP has surpassed that of India’s in every decade. By 2022, China’s per capita GDP was more than double that of India. Viewed another way, India’s per capita GDP in 2022 was the same as China’s in 2007.
The picture gets worse when we compare India with the advanced economies. India’s per capita GDP in 2022 was what the US’s was in the 1890s, the UK’s was in the early 1900s, and Japan’s was in the 1960s.
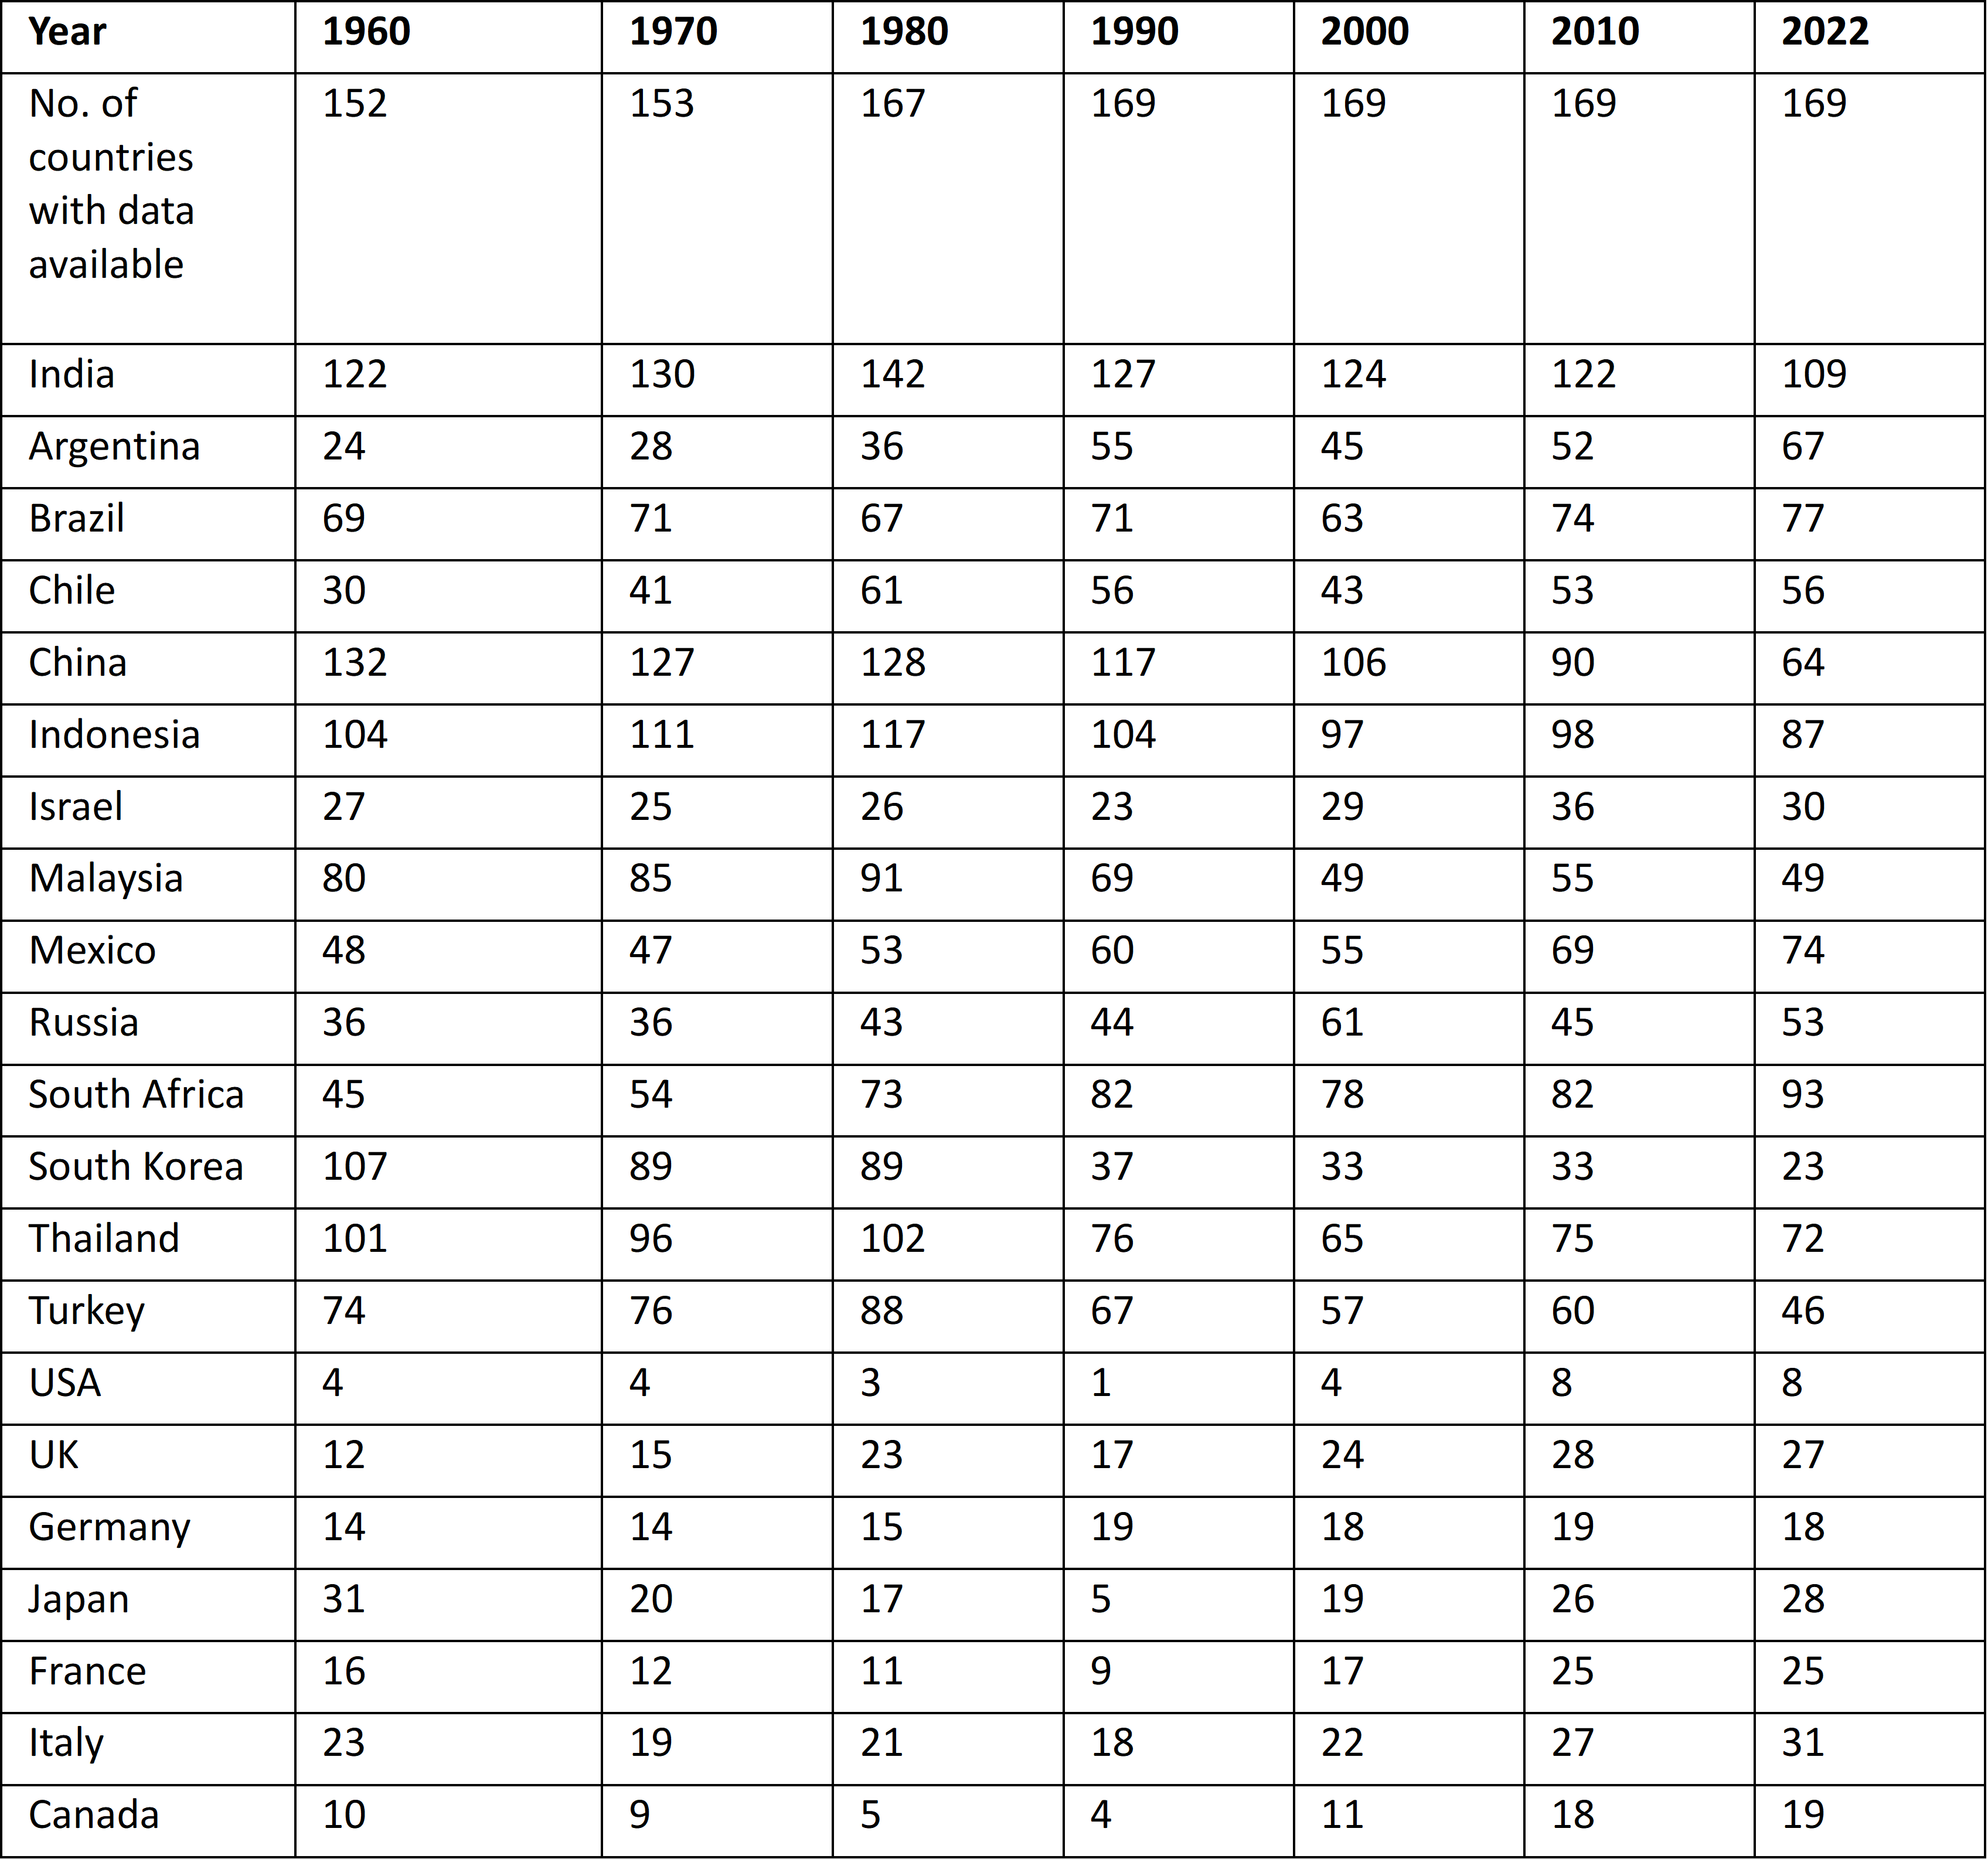
Table 3 gives India’s ranking in the world along with a select group of emerging market economies and advanced economies for per capita real GDP (in PPP terms). It shows that while India has indeed climbed up the ranking, progress has been rather slow.
In 1980, India ranked 142nd in real per capita GDP out of 167 countries. Twenty years later, it moved up to 124th, and another 20 years later, it reached 109th. However, India is significantly behind most other countries, including major emerging market economies like Brazil, China, Indonesia, Malaysia, Mexico, Russia, South Africa, Thailand, and Turkey, and, of course, far away from the advanced economies.
Table 3: Ranking of Select Countries Based on Per Capita GDP (Constant 2011 US$, PPP)
Transition in Growth Story
To throw some light on the different regimes in India’s long-term growth trajectory, we undertake a structural break test analysis using the procedure described in Bai and Perron (2003), and following Rodrik and Subramanian (2004). We compute the break points for two different series, per capita real GDP (constant 2011 US$, PPP adjusted) from the Maddison Project database and real GDP (constant 2015 US$)) from the World Development Indicator database. We also tried with data from the Penn World Tables. In all cases, we found four break points roughly during the following periods:
i) 1969–1972
ii) 1980–1984
iii) 1996–2001, and
iv) 2009–2012
Combining these results with all the other data we have analysed, we can infer that Indian economic performance improved significantly after the break in 1996–2001, but it began slowing down after the structural break in the 2009–2012 period. Since the analysis does not reveal any further breaks, it implies that the weakening of the economic performance has not reversed since 2012.
Conclusions
In summary, we find that while the size of the Indian economy has grown substantially over the last few decades, focusing on size or growth rate can be misleading. Even if India today is the fifth largest economy by size, it lags behind 108 countries of the world in per capita GDP, which is what truly matters for overall economic progress and prosperity. The policy and media discourse should focus more on how to improve the living standards of the Indian people rather than repeatedly emphasising the size of the economy.
It is also worth pointing out that while India’s economic performance has picked up, especially since the liberalisation reforms of the 1990s, the country is still far away from where it needs to be. Will India soon become an advanced economy?
This question is often asked these days. Achieving this status by 2047 requires a sustained increase in the growth rate of the economy, which does not seem to be happening right now. To better understand how long it would take India to close the income gap with advanced economies, we conduct a simple exercise using India’s per capita real GDP (constant 2011 US$, PPP adjusted) of 2022 and the US per capita GDP of 2022 as a benchmark.
We found that if the Indian economy grows at a real rate of 6 percent, it would take 34.6 years to reach the 2022 level of US per capita GDP. Whereas if the Indian economy grows at a real rate of 10 percent, it would take 21.2 years. This implies that theoretically it is possible for India to become a high-income country by 2047, but achieving and maintaining a 10 percent real growth rate (or even a 6 percent growth rate) for 2-3 decades would be an exceptional feat. Even if we assume that implementation of several long-pending structural reforms puts India back on the high growth path over the next few years, it is worth noting that growth rates tend to slow down as income increases, as can be seen from the examples of China, the US, and other high-income economies.