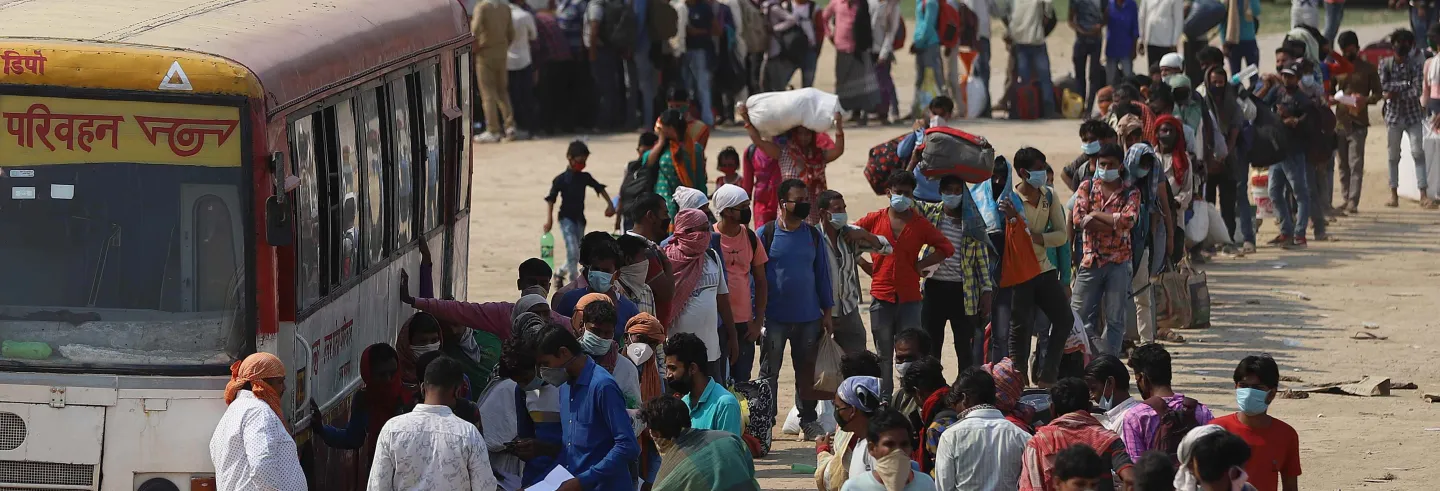
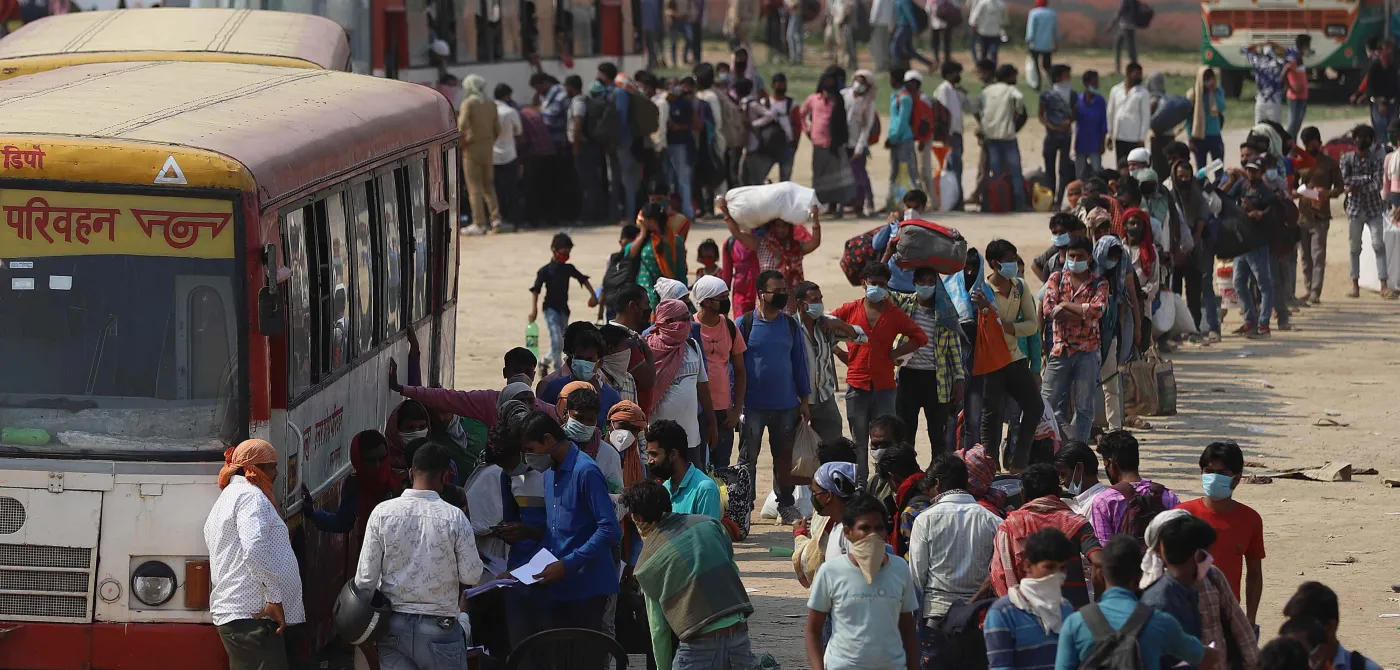
The public focus on ‘migrant labour’ emerged almost as soon as the Covid-19 lockdown was announced on 24 March. Many poor workers, who found they were without work and were very short of funds, took it upon themselves to walk to their villages: some with families, many more on their own.
Most of these persons began their journey on foot. Their miserable state was caught on camera, and there has been considerable discussion of their plight. It can be said without doubt that these persons were very poor urban workers who had lost their jobs.
However, how many of them were on the road, whether they represented the bulk of redundancies in urban areas, whether they were all migrants and, if so, of which kind—these questions began to stick to the images of workers walking out of the cities. The violence that some of these workers met with during their journey emotionally charged the issue further.
That they were going out of urban areas to the perceived safety of their non-urban destinations in itself does not mean that they are all or mostly short-term migrants. Similarly, the fact that most of these workers are very poor and had been dismissed from their jobs, tells us little about how much they represent others who had been made jobless in urban areas.
Loss of jobs
The scale of job losses at the all-India level and indeed in urban India from where these persons have been moving out are difficult to ascertain, as there are not many current surveys. The estimate of job losses is distinct from the estimate of persons who potentially may have incurred damage to livelihoods. This number can be inferred from the baseline data we do have of workers, as in the Periodic Labour Force Survey (PLFS) of 2017-18. The headcount of the poor or the self-employed and casual workers is an obvious upper limit. Some evidence that is emerging now suggests that very large sections of the working population have indeed lost jobs.
It is our view that in the first round of the lockdown, it is the casual workers who have been affected the most.
One survey that we must rely on is from CMIE, which estimates that 122 million workers lost their jobs in April. This is more than a quarter of all employed persons. Of these, it identifies 91.3 million as labourers and small traders—the corresponding category in standard employment data being casual workers and the self-employed.
While the scale of estimated job loss is huge according to CMIE, the survey does not give an urban-rural split. Researchers at Azim Premji University have done another, much smaller, purposive survey, which is very useful (the “APU Survey”). This survey gives a breakdown of jobs lost by location and employment type. We are, of course, interested here in the urban jobs loss. 1 The overall employment split between rural and urban in India is around 71.3% rural and 28.7% urban according to PLFS 2017–18. Thus, while it is true that a majority of the redundancies took place in urban areas, it is also the case that urban India has a minority of employment.
As far as urban jobs are concerned, the APU survey shows that by mid-May, 81% of casual workers, 84% of self-employed, and 76% of regular salaried workers had lost their jobs.
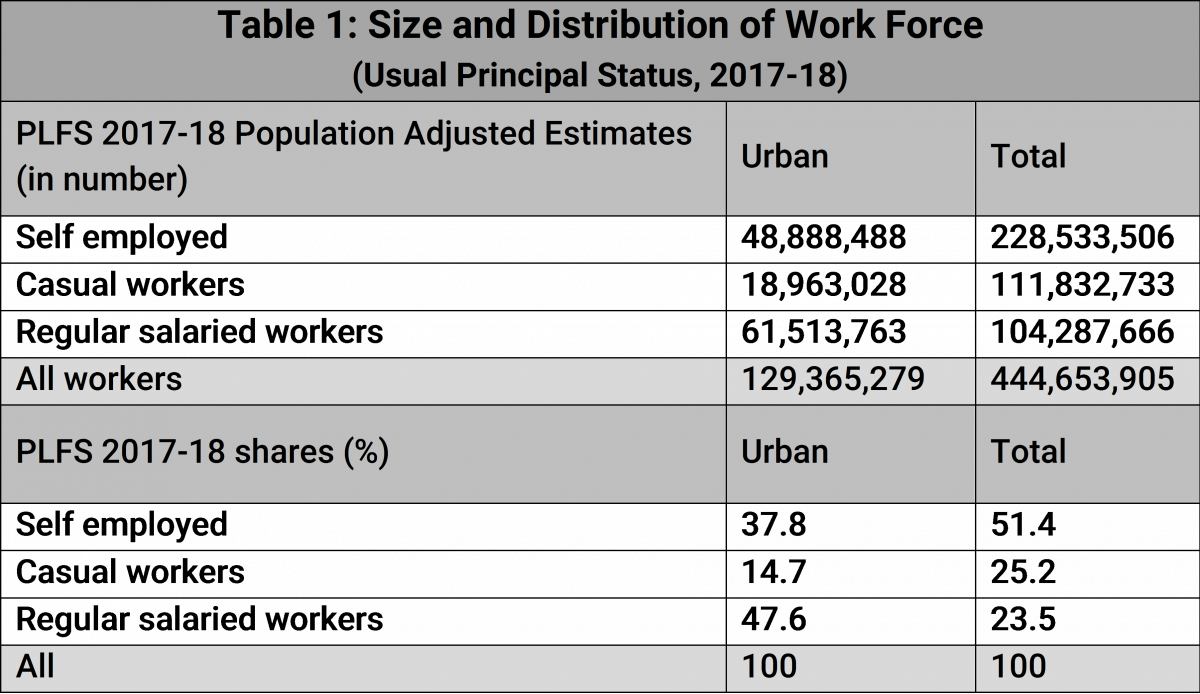
The PLFS urban shares and employment estimates and shares are given in Table 1. Therefore, if we apply APU’s 81% to the PLFS estimate of 18.96 million casual workers (Usual Principal Status or UPS), we get 15.35 million. This is the large number of casual workers in urban India who may have lost their jobs.
The figure is slightly higher if we take the Usual Principal + Subsidiary Status (UPSS) estimates of workers 2 We estimate total urban employment to be around 129.36 million on UPS and 131.43 million on UPSS in 2017–18. . The number is, of course, going to get slightly more higher if we take the 2020 adjusted population estimate as opposed to the estimate for 2017–18. The absolute number clearly depends on the population estimate we take, but the difference is not much.
The identity of urban workers who are leaving
There are many poor people living in urban areas. They include workers of many descriptions. Many self-employed are very poor, and almost all casual workers are poor 3 There are indeed short-term seasonal migrants to urban areas included in this group. It is likely that these persons also do casual work. Many short-term seasonal migrants were also due to go back at that time of the lockdown to attend to duties in the rabi harvest season. . There are also poor regularly employed persons without social security, who too are affected by the lockdown. It is our view that in the first round of the lockdown, it is the casual workers who have been affected the most.
The PLFS numbers suggest that in urban areas, casual workers were around 14.6% of total urban employment in 2017–18: the 18.96 million number. This would indeed be the count of the exodus if all casual workers were to leave, all 18.96 million. As we saw, applying the APU survey-based percentage of urban casual labour job loss (81%) to this number, would give us an affected casual worker population of 15.35 million.
Many casual workers are persons who either have accommodation arranged for them, for which they pay through contractors, or who live on work premises (as on construction sites), or rent rooms on an informal basis, or make do in temporary spaces for which they pay directly.
In any event, it is safe to assume that a considerable minority of casual labour in urban areas does not live either in premises that have properly written rent leases with emergency clauses, or in owned premises. Moreover, these casual workers who have such adverse accommodation arrangements are likely to be the poorest and must be amongst those who lost their jobs after the lockdown was imposed. After all it is most of the casual workers that we suspect have lost jobs.
The NSS Housing Survey of 2018 4 We call this the Housing Survey 2018. It is technically unit level data from the NSS 76th Round on Drinking Water, Sanitation, Hygiene and Housing Condition, July–December 2018. allows us to identify urban casual workers, their sectors of occupation, their duration of stay in residence on a premises, and their residential contractual arrangements. 5 There is likely to be a link between short-term residences, especially of less than one year, and short-run migrants, who are the poorest of casual workers. The last of these heads also allows us to distinguish between owned, owned-leased, and rented accommodation with written contracts. We term these non-adverse accommodation arrangement.
This is in contrast to less formal arrangements that are based on employer provided spaces (like construction sites, spaces near factory compounds, or makeshift quarters) and informal rentals without written contracts. We call these adverse accommodation arrangements.
While the bulk of urban casual workers in all sectors lives in non-adverse conditions of accommodation, a significant minority—around a quarter—lives in adverse accommodation arrangements (Table 2). We estimate that number to be 25.69% of the 18.96 million casual workers estimated by the PLFS 2017-18. This comes to about 4.87 million living under adverse accommodation arrangements. 6 This number would go up a little (4.94 million) if we included those with written accommodation contracts.
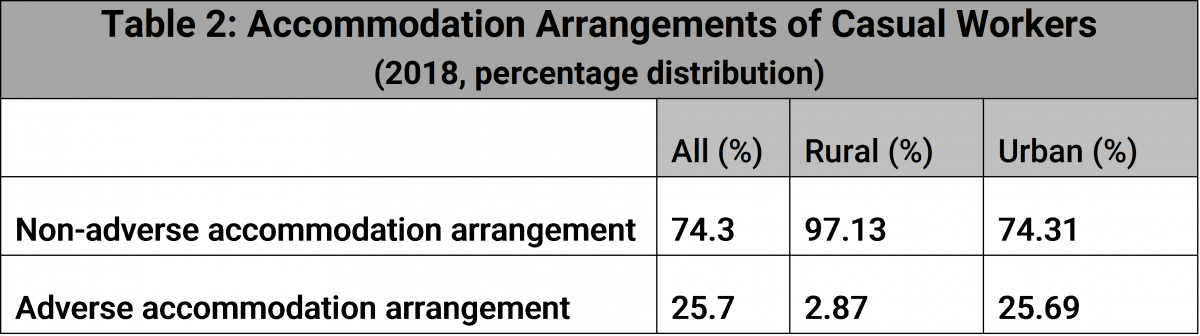
The other point to note here is that those who have non-adverse accommodation arrangements and who live in owned and leased abodes are in a majority. Around 74.3% of casual workers in urban areas live in owned and leased accommodation. It is inconceivable that these casual workers, who are long-term occupiers or quasi-owners of their urban abodes would immediately give up their foothold in urban areas, or immediately move out after they lose their jobs.
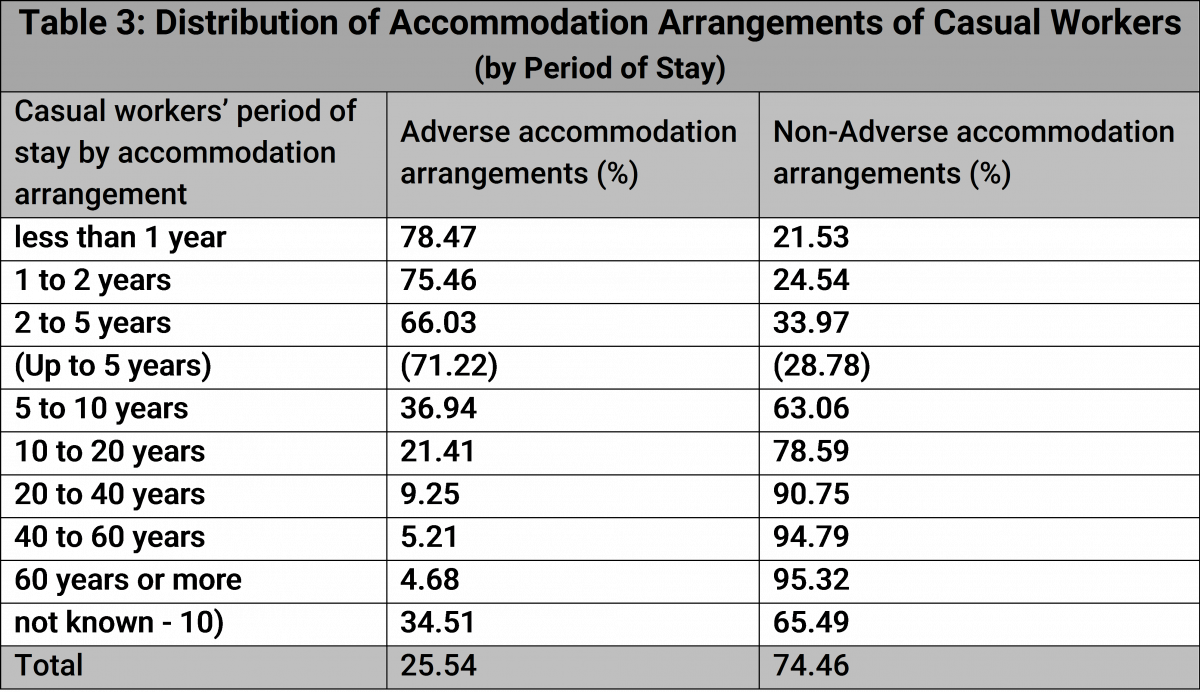
We can now look at the duration of stay in premises for casual workers. Tables 3–5 show three things.
First, Table 3 shows that as the duration of stay increases, there is a decrease in the share of casual labourers living in premises under adverse arrangements. Thus, as expected, shorter period rentals and stays correlate with less secure accommodation arrangements. Adverse accommodation arrangements decline as the period of stay by casual workers lengthens.
While this is not a guarantee for identifying short-term migrants, it is still plausible to infer that short-term migrants, under the Census definition, will be amongst those who are living in an accommodation for less than one year, and especially amongst those who are also living under adverse accommodation contractual arrangements.
The adverse contracts are clearly bunched in accommodation arrangements for stays of less than five years. They are not just located in the less than one-year category but can go up to the five-year group. Table 4 shows the distribution of adverse accommodation arrangements for casual workers by duration.
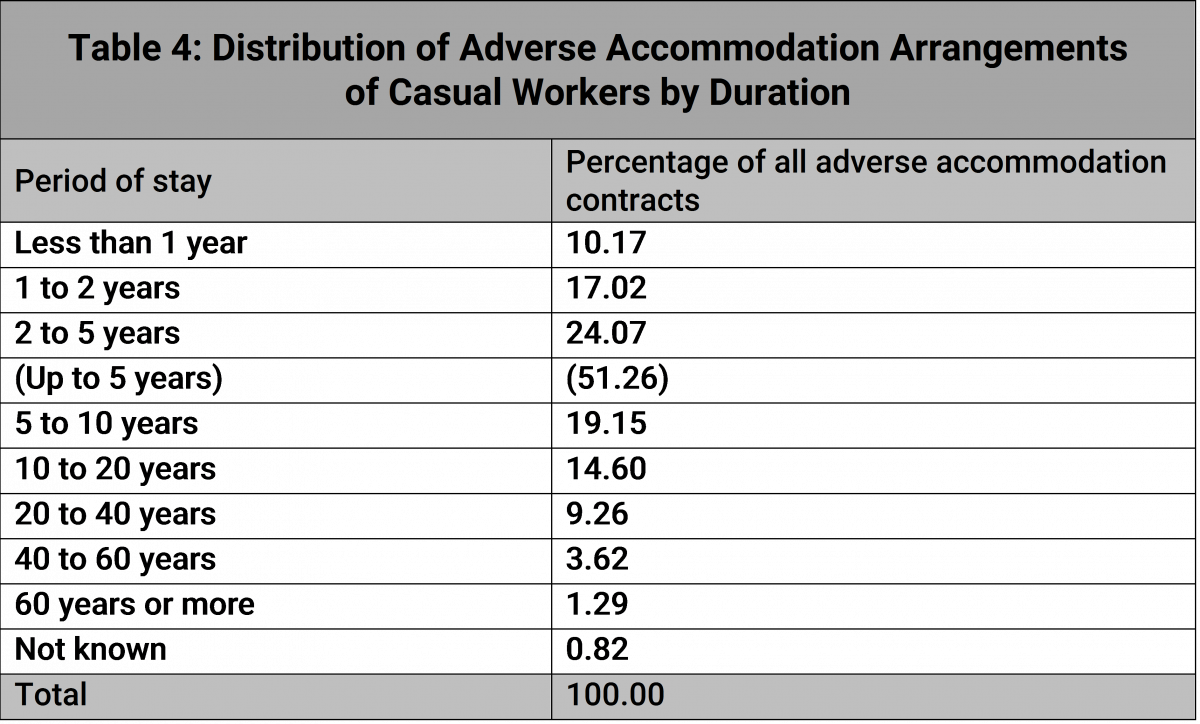
Table 5 shows us the shares of select classifications of casual workers in the 2018 Housing Survey and the inferred absolute numbers from the estimates of the casual labour population as in the 2017-18 PLFS.
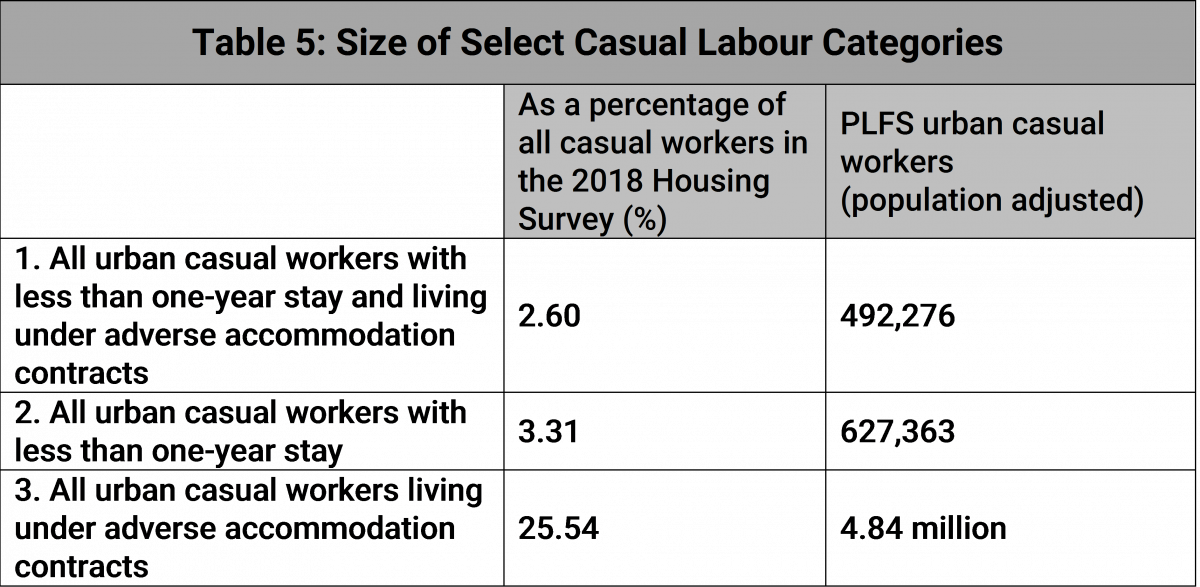
The worst-off group are casual labourers with less than one-year accommodation and adverse housing contracts. They are around 492,000, say half a million. According to our reasoning this is the category in which short-term migrants will most likely be.
The next category does not bind the group to adverse accommodation arrangements but retains the restriction of a stay of less than one year. This number is larger, around 627,000.
Finally, we have that category of urban casual workers that has adverse accommodation arrangements but without the restriction of period of stay. This is the 4.8 million number. If we use the estimates for population in 2020, the ball-park figure should be around 5 million.
These casual workers, numbering 4.8 million–5 million, are the ones who are likely to have found themselves without work post the lockdown and who, living on premises with adverse accommodation arrangements, would have been compelled to leave the cities in the first wave of movement home.
This estimate clearly looks conservative in the light of speculation that has been going on. It also suggests that the group of leaving workers is less likely to be of the very short-term workers but comprise a wider range of workers.
One extension to these estimates may be to examine all workers rather than just casual workers. This is tantamount to saying that we are not focussing on one worker type. After all, the APU Survey also says that 84% of self-employed and 76% of regular employed were also made redundant.
Our view in this context is that there is no exclusivity of worker group amongst those returning, but it is likely that casual workers dominate the first wave. The reason for this is that we think self-employed persons may have a slightly longer staying power than casual workers. On average their consumption levels are higher.
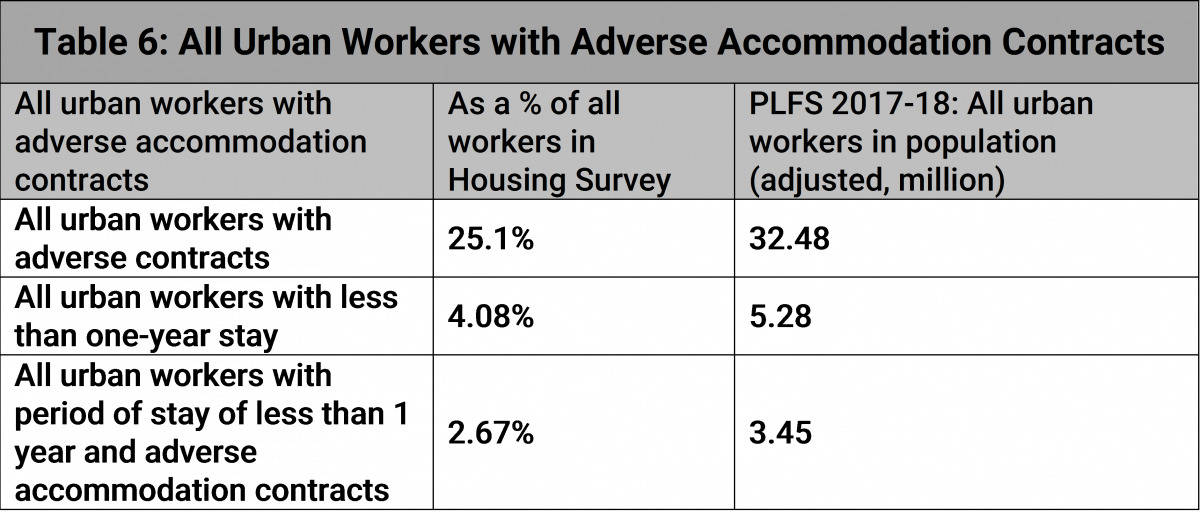
Keeping the restriction of short term of stay (less than one year) and those with adverse accommodation contracts, the number of all urban workers (casual, self-employed, and regular salaried) in this category is 3.45 million. The number of urban workers with less than one year stay and without adverse contracts increases to 5.28 million (Table 6, Row 2).
Of course, by removing the restriction of time of stay altogether, we get a higher number of 32.5 million workers who have adverse accommodation arrangements (Table 6, Row 1). It must be noted that because we have removed the time constraint, it would be difficult to argue that short-term migrants dominate the larger number even if it was close to the actual exodus number.
In our view, this is a large but plausible number of 32.5 million workers with adverse accommodation arrangements, which includes 3.45 million of short-term migrants with adverse contracts. This is because there is rampant urban poverty in India and there are many permanent residents in urban areas who are poor and who do not have secure accommodation arrangements, and yet stay put in urban areas. Needless to say, over time if there is a weak recovery, many amongst them too will be without shelter.
Some remarks
Our considered estimate of workers initially wanting to move out of urban areas is around 5 million. This would tend to include around a half million short-term migrants—the indicator being the interface between casual work, adverse accommodation arrangements, and a short period of stay. A further slowdown and the incapacity of the economy to restart may bring about a second wave with more self-employed and some regular workers (without security), some of whom will no doubt wish to leave urban areas.
Given that these numbers are based on many assumptions it is expected that they are not plausible to some researchers. This is natural in a situation of limited data. New data, especially the Census of 2021, will shed light on this issue when it comes out. There are, however, two distinct sources from which confusions can arise that can be addressed even at present.
The overall number [of those moving out] … is likely to be around 5 million in the first wave—persons who find themselves without shelter and have been mostly casually employed.
The first point we need to make is that one should recall that 81% of casual workers in urban areas have lost their jobs according to the APU Survey. This comes to roughly 15.3 million. If we assume that the proportion of these 15.3 million who are in adverse accommodation arrangements is the same as in the 2018 Housing Survey—25.1%—then the absolute number of workers in adverse accommodation arrangements who have lost their jobs comes to around 3.84 million. So, the number when extrapolated even from the APU survey is on the low side and is close to our estimate. This is despite the fact that the overall jobs loss percentages from the APU survey, if translated into absolute numbers, would be very high.
So a low estimate of casual workers with adverse accommodation arrangements (the proxy for those who are walking out of urban areas) is not inconsistent with estimates of very high job losses.
Inter-state and intra-state demarcations, in conjunction with alternative classifications and definitions of migrants, and data from independent surveys may well give different numbers. 7 For example, see Migrant Labour in the Shadow of the Pandemic. IHD-ISLE Webinar. 2 May 2020. https://www.youtube.com/watch?v=8y5MOaqN9SY. For concepts linked to short term circulatory migration see Jan Breman Footloose labour: Working in India’s Informal Economy. (New York: Cambridge University Press, 1996.) However, these will be different numbers and different categories. Moreover, to assume that those who are moving from urban areas towards rural areas at this present junction necessarily belong to these alternative migrant classifications needs more than just independent estimates of the circulatory and floating migrants.
Depending on the speed of recovery, other affected groups like the self-employed may increasingly join a second wave.
The issue was to ascertain the scale of persons moving out from urban areas. In the first wave, they are likely to have been casually employed, very poor, and living in adverse accommodation arrangements. Undoubtedly, many of these persons are also likely to be working in the urban areas on a short-term basis. Where would they go? Many must have relatives in other parts of the country. They do not have money. They are desperate, so they are walking. The overall number for this group is likely to be around 5 million in the first wave—persons who find themselves without shelter and have mostly been casually employed.
Depending on the speed of recovery, other affected groups like the self-employed may increasingly join a second wave. There is a possible confusion between the estimated scale of job losses, which are highly plausible, and alternative notions and estimates of migration. The two are not systematically linked.
The author would like to thank Abhishek Kumar for research assistance and Ajit Ghose and Radhicka Kapoor who discussed some aspects of the topic with him.
The views expressed in the text are the author’s and not of the organisation he works for.