

Across the world, cross-border migration of people is an issue that has come to occupy an important place in public discourse and, naturally, in political decision-making. Terms such as “illegal migration” or, worse, “infiltration” are often used inappropriately for people seeking refuge from war, looking for better economic opportunities, or even fleeing climate change. These undocumented migrants have become targets of government action from the United States to West Europe to India to Australia and now even in South Africa.
A mixture of fear of job losses, worries about the erasure of cultural identity, and concerns rooted in religion and racism underlie much of this politics against immigrants—both those with documents and the undocumented—in individual countries.
It is in the nature of this phenomenon that there is little hard evidence on the extent of undocumented migration. The absence of reliable data lends itself to a politics based on misinformation. It is of course also in the nature of the migration debate that the numbers alone will not change opinions. Yet it remains important to look closely at the evidence available, tease out trends from official data and other reliable independent data sources, and place the facts in the public domain to facilitate informed debate.
Public discourse on immigration into India in recent years has focused on the eastern borders, with little or no mention of the North or West. 1The migration of Tamils from Sri Lanka to Tamil Nadu has ceased and is not the issue it was in the 1980s and 1990s. The emphasis in particular has been on what is called the “changing demography” in the border districts of West Bengal and Assam, on account of a perceived large movement of undocumented migrants from Bangladesh.
The analysis here is both specific and narrow. What is the evidence on a changing demography in the first two decades of the 21st century in the border areas of West Bengal and Assam? What kind of conclusions can we draw from an analysis of secondary data?
1. The Approach
Migration from Bangladesh (when it was East Pakistan) has involved both Hindus and Muslims. After the bloodbath of Partition, both permanent and even temporary migration continued, with the latter lasting until the India-Pakistan war of 1965. The landmark event was the estimated 10 million Bangladeshis who sought temporary refuge in India in 1971. It is widely believed that while most returned to Bangladesh after Independence, a large number—both Hindus and Muslims— stayed back permanently. Thereafter, phases of violence saw Hindu Bangladeshis moving to India. More recently, there have been allegations that large streams of economic refugees have entered India without going through official immigration channels.
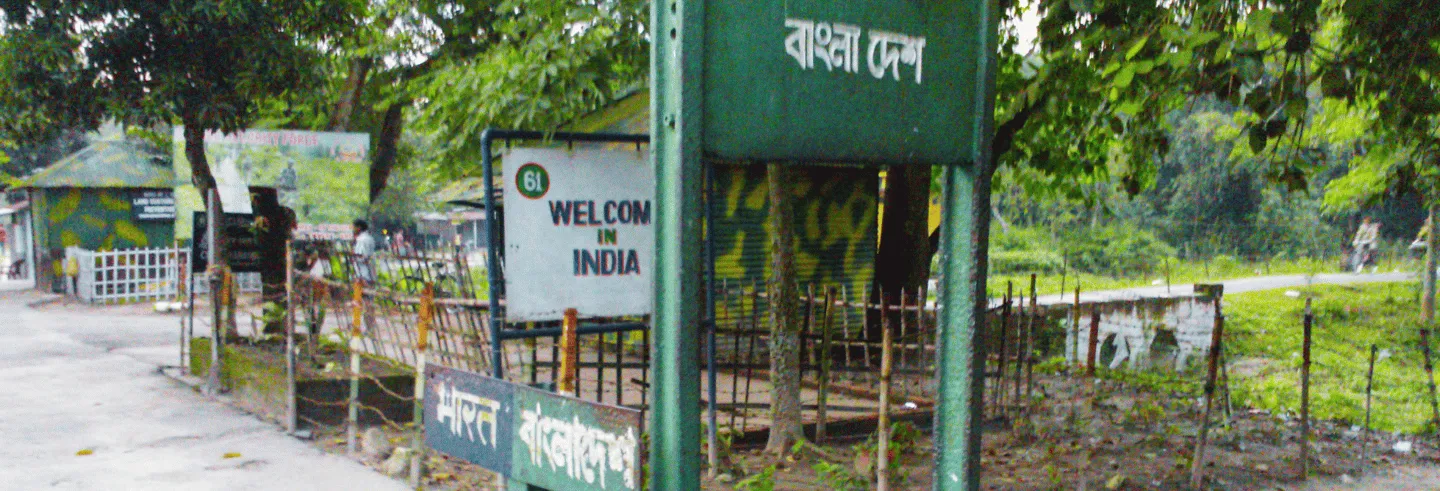
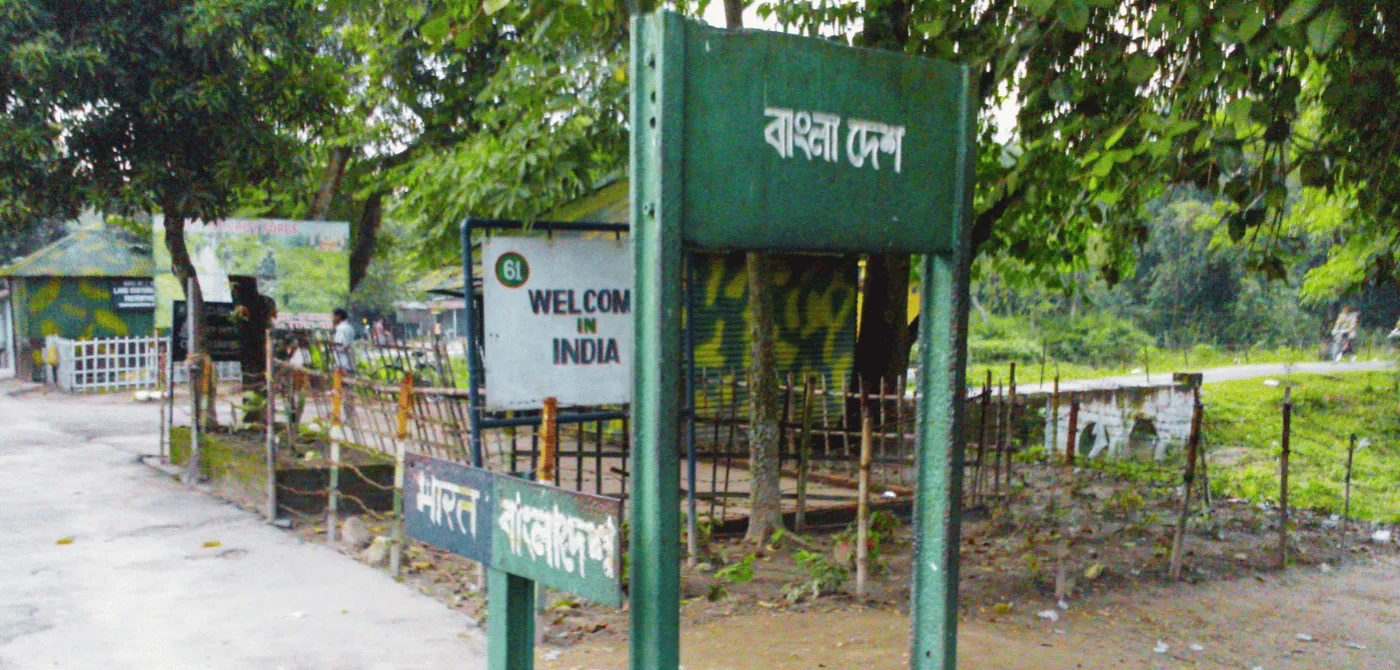
It is important to note that the vast riverine ecology across the borders of India and Bangladesh has always seen tightly knit communities temporarily crossing the border, irrespective of religion. This movement is now restricted by border fencing—an old project that began in 1986, with about 80% of the border fenced so far. 2Border-fencing results in unmentionable tragedies like the killing in 2011 of the 15-year-old Felani Khatun. See Sur (2014) for a discussion.
Since the political concern in India now is about the entry of migrants who profess Islam, the analysis here focuses on the perceived outcome of Muslim migrants. And because the issue has gained prominence in recent decades, the analysis examines population change in the two states separately, the relative growth of the Muslim population in border and non-border districts, and trends in two periods: 2001–2011, and 2011–2019.
1.1 Multitude of Factors
The framework of an analysis that looks for evidence of immigration in the relative population growth in the border and non-border areas makes one major and erroneous assumption: that any higher-than-average growth of population in a border area is the result of immigration.
It is elementary that population growth in any geographical area is the outcome of many processes: the reproductive behaviour of the socio-economic groups in that area, the levels of mortality, as also the difference between in-migration and out-migration.
Since there is no district-wise information on each and every variable, the numbers on population growth in the aggregate in the border areas must be interpreted in a very limited way with respect to the presence or absence of immigration.
1.2 Differential Fertility
A second distinct and yet related aspect must be kept in mind when examining population growth, whether by religion or socio-economic group. Reproductive behaviour can differ by group, and these differentials can also change over time. This is of significance in India when trying to interpret the growth of the Muslim population over time vis-à-vis that of the Hindu population.
Taking the case of West Bengal first, the total fertility rate (TFR – the average number of children a woman is expected to have during her lifetime) has been higher among the Muslim than among the Hindu women of the state. But this higher fertility has been falling rapidly and the gap between Muslim and Hindu women has narrowed significantly. The TFR among Muslim women in West Bengal was 4.1 in 2001 and 2.2 in 2011 (Ghosh 2018). According to the National Family Health Survey-5 (NFHS-5) it was 2.03 in 2019. The corresponding figures for Hindu women are 2.2 in 2001, 1.5 in 2011, and 1.47 in the NFHS-5. In short, Muslim fertility is still higher than that of Hindus, but Muslim fertility is falling faster than that of Hindus. A gap of 1.9 in 2001 had become 0.56 in 2019.
The differential but narrowing fertility is the story across the country (Goli and Kriti 2024) and even more so in Assam.
The TFR among Muslim women in Assam was 5.1 in 2001 and 3.1 in 2011. It is now 2.38 according to the NFHS-5. The corresponding figures for Hindu women are 2.8 in 2001, 1.7 in 2011 (Ghosh 2018), and 1.59 in the NFHS-5. The Muslim-Hindu gap of 2.3 children per woman in 2001 has thus narrowed to 1.4 in 2011 and to just around 0.8 in 2019. Muslim fertility in Assam has been falling faster than Hindu fertility through the entire period for which there is data.
The pattern here, as in West Bengal, is one of convergence: Muslim fertility falling towards, and not away from, the general level. (It would not be surprising if when the entire data of NFHS-6 [2024-25] are released that that the gap has since disappeared in these two states as also in much of the country.)
In both states, Muslims started with a larger proportion of the total population. This, along with the higher fertility among Muslim women, should result in a rise in share of the Muslim population in the total—assuming movements in death rates and out-migration do not neutralise this effect. But with the narrowing of the gap in reproductive behaviour between Muslim and Hindu women, the shares in population of the two main religious groups will soon plateau out.
The caveats must be borne in mind when interpreting estimates of growth of population in the border areas.
1.3 The Analysis
The census should have been the basic source of information on population and religious composition for this analysis.
While the period 2001–2011 (Period 1) is analysed using the census data for those two years, we of course do not have census data for 2021.
For Period 2, 2011–2019, we compare the census data of 2011 with the National Family Health Survey (NFHS), which, in the absence of a census, is the best available substitute. The NFHS-5, which was conducted in 2019–21, is a large, nationally representative household survey. It records the religion of each household it interviews. With appropriate household sampling weights, one can construct district-level estimates of the Muslim share of the population in the year the survey was fielded. The NFHS-5 is representative of the population at the district level for our purposes.
Since two different sets of data are being compared for Period 2, it is necessary to be aware of what the NFHS data say and also the caveats in their use. These are set out in Appendix 1.
1.4 State-level Picture
The Muslim share of West Bengal’s population rose from 25.25% in 2001 to 27.01% in 2011 and is estimated at about 28% in 2019. This represents a gain of 1.76 percentage points (pp) over the first decade and 1.25 pp over the second—for a cumulative increase of roughly 3 pp across two decades. In Assam, the Muslim share rose from 30.9% in 2001 to 34.2% in 2011 (3.3 pp) and is estimated at 37% in 2019 (2.8 pp). This is a 6-pp gain across two decades.
In both states, as expected, the pace of increase in Muslim population shares is slowing.
These state-level numbers are background. They are not, by themselves, a settlement of the specific claim that the border districts are being demographically transformed. That requires looking inside the state.
It is claimed that there is a change in the demography of India’s eastern border. So, do the population numbers of the border districts of West Bengal and Assam show such a change?
2. The 2001–2011 Decade, at the District Level
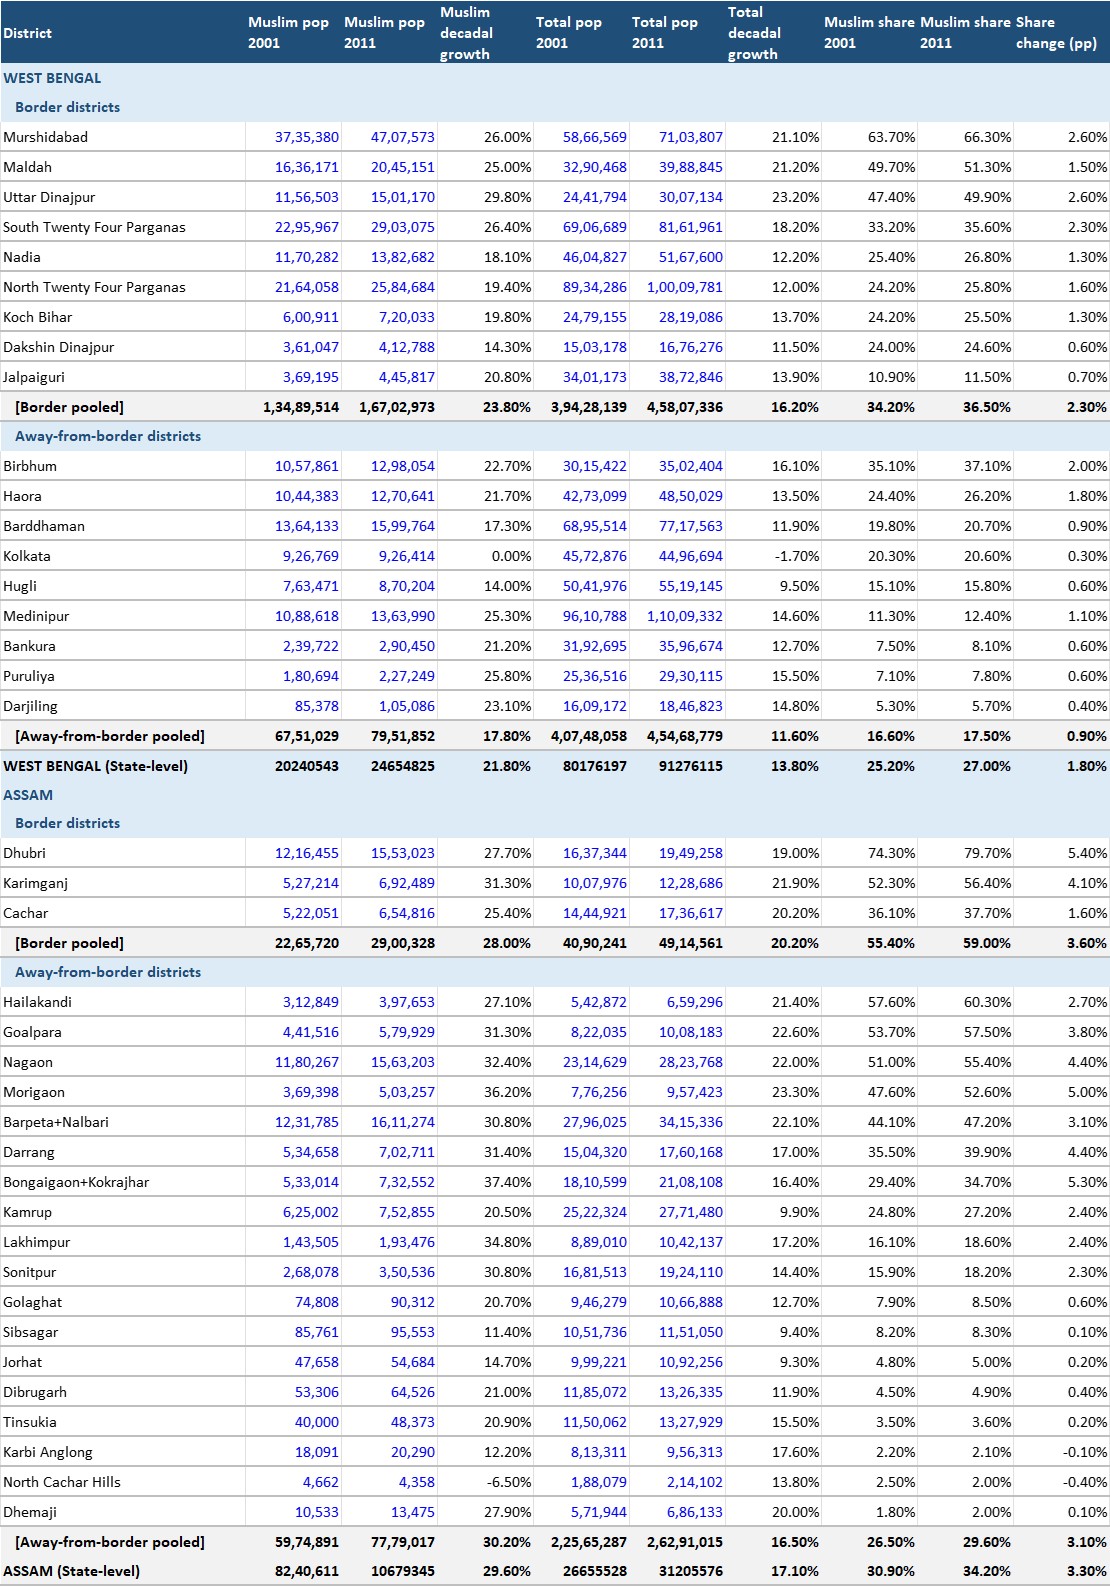
Between the 2001 and 2011 Censuses, the proportion of Muslims in the total population rose in almost every district of both states. 3Between Census 2001 and the NFHS 2019-21, district boundaries have changed in West Bengal and Assam. A concordance is made by merging split districts to larger (older) district aggregations to have consistent comparisons over time. The district crosswalk was obtained on request from the Centre for Economic and Data Analysis (CEDA) at Ashoka University. We are grateful for this information. (District wise data of the population for all districts in each state are in Appendix 3)
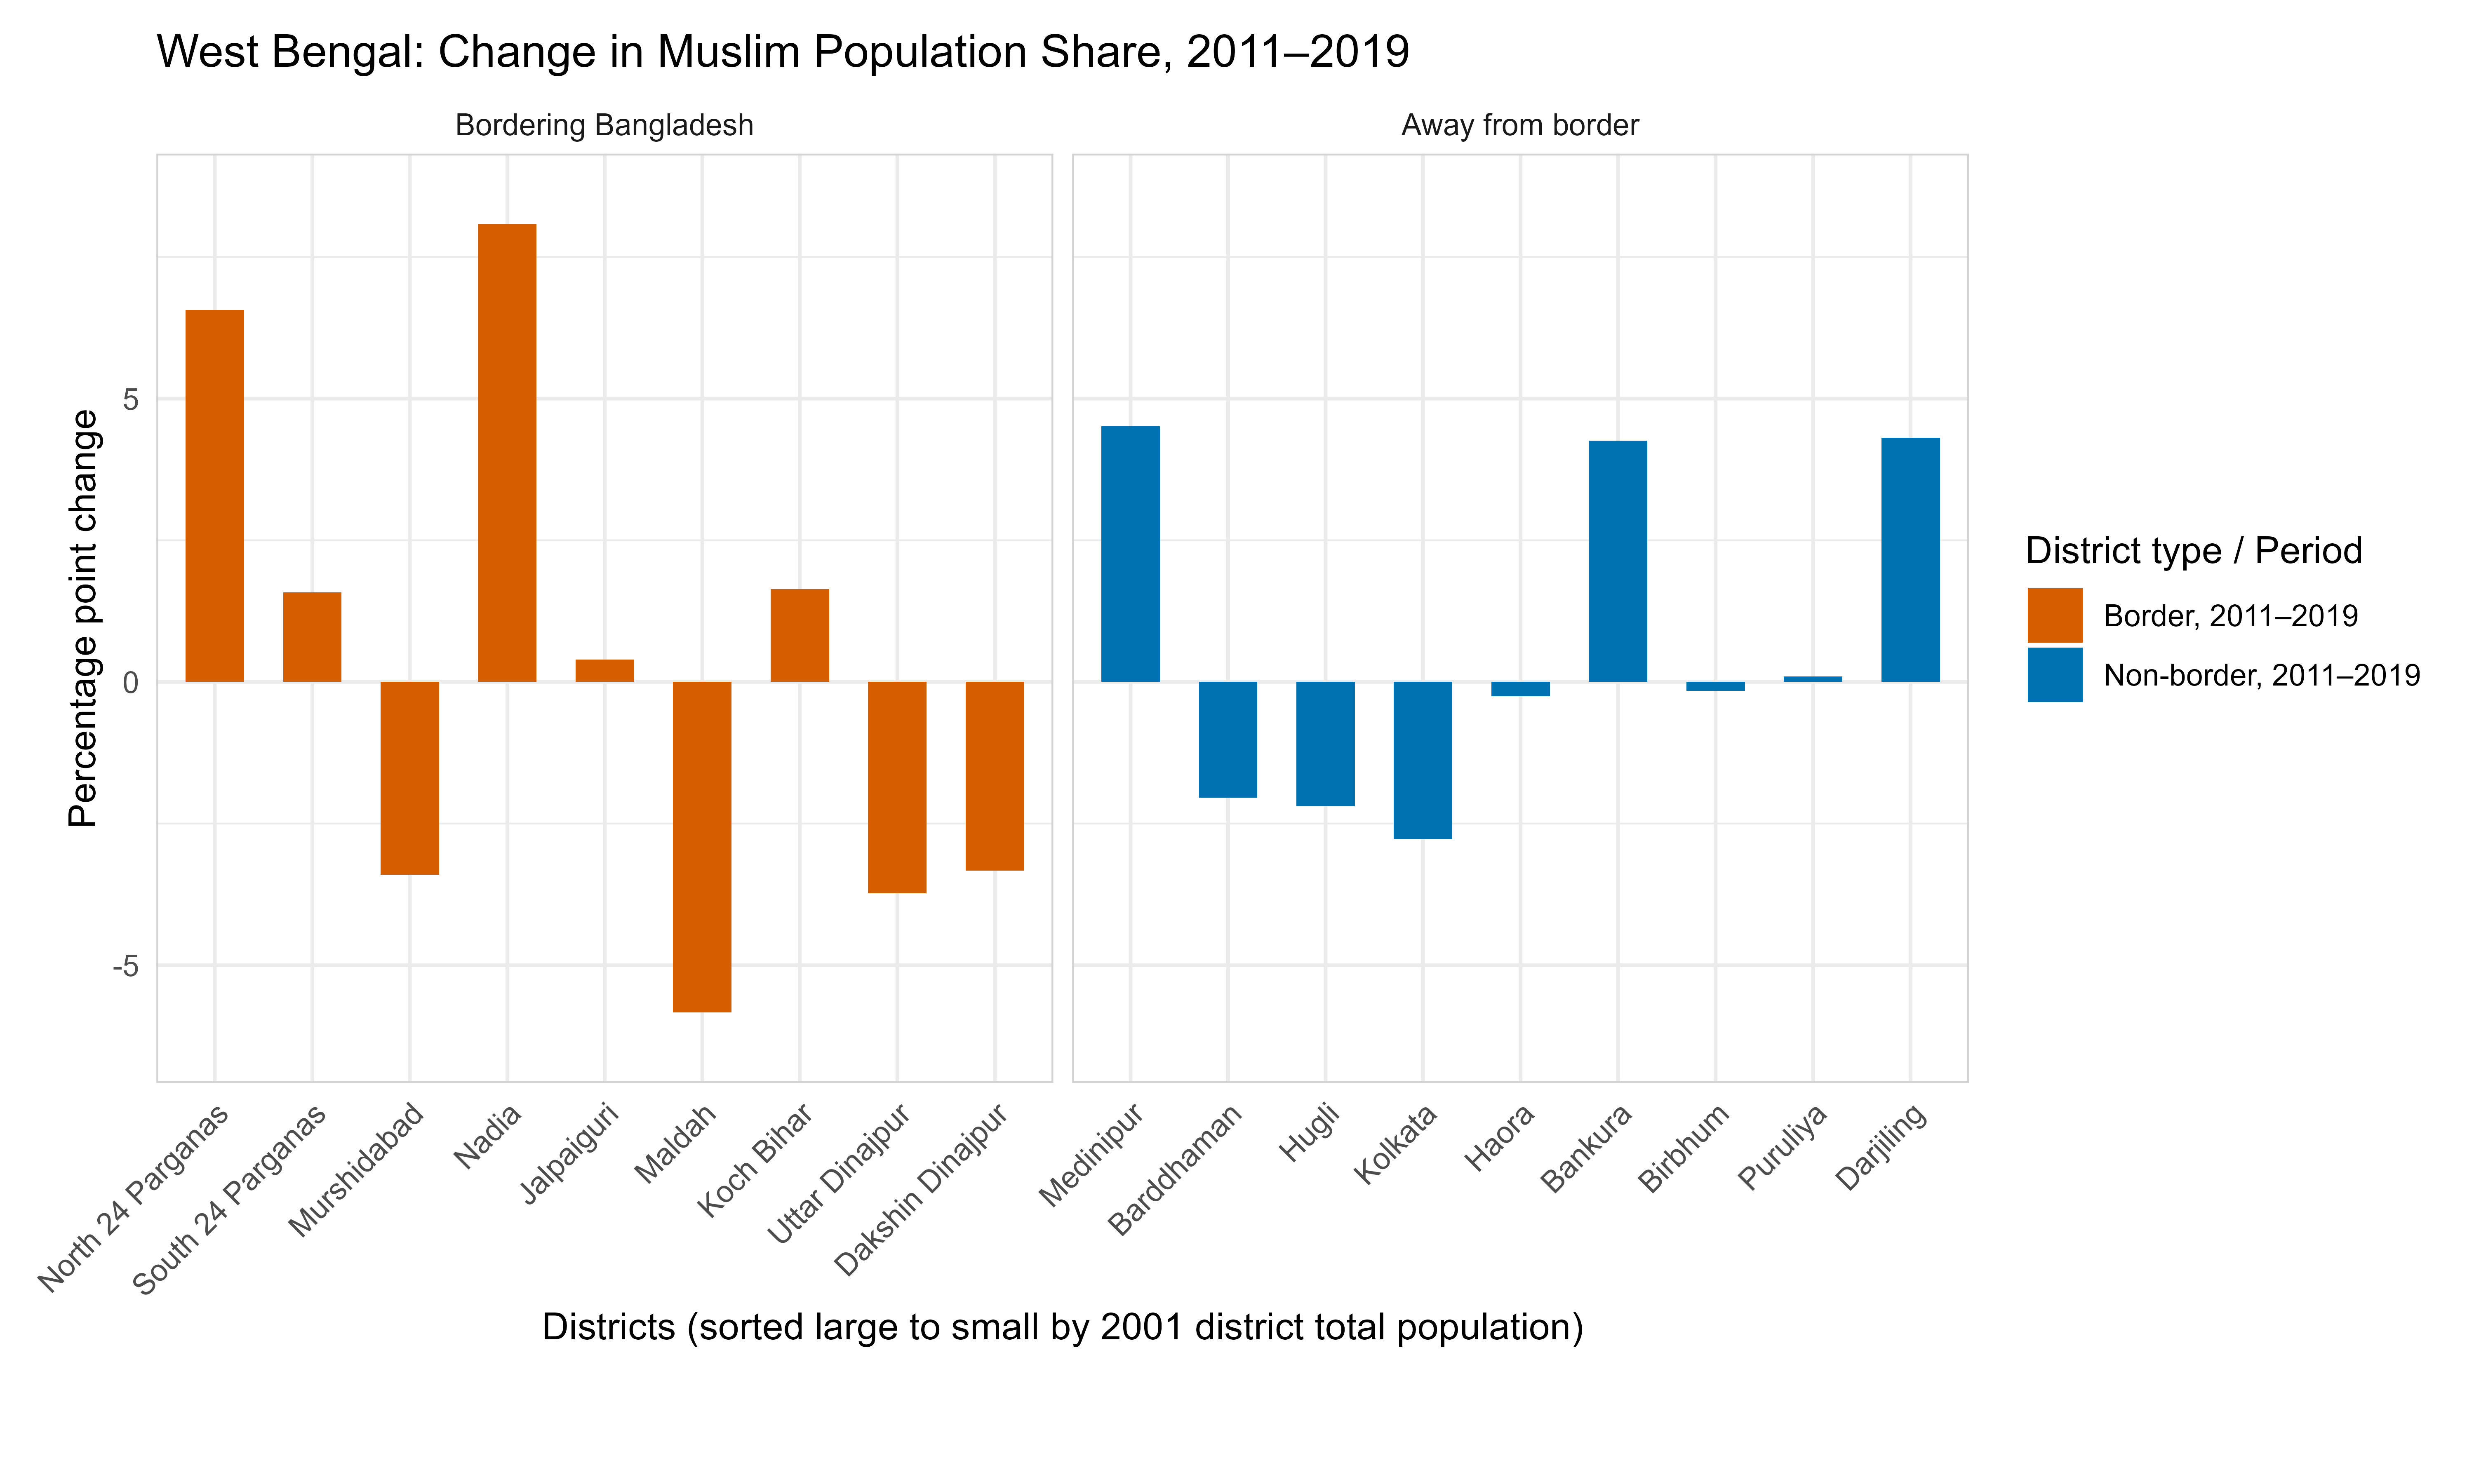
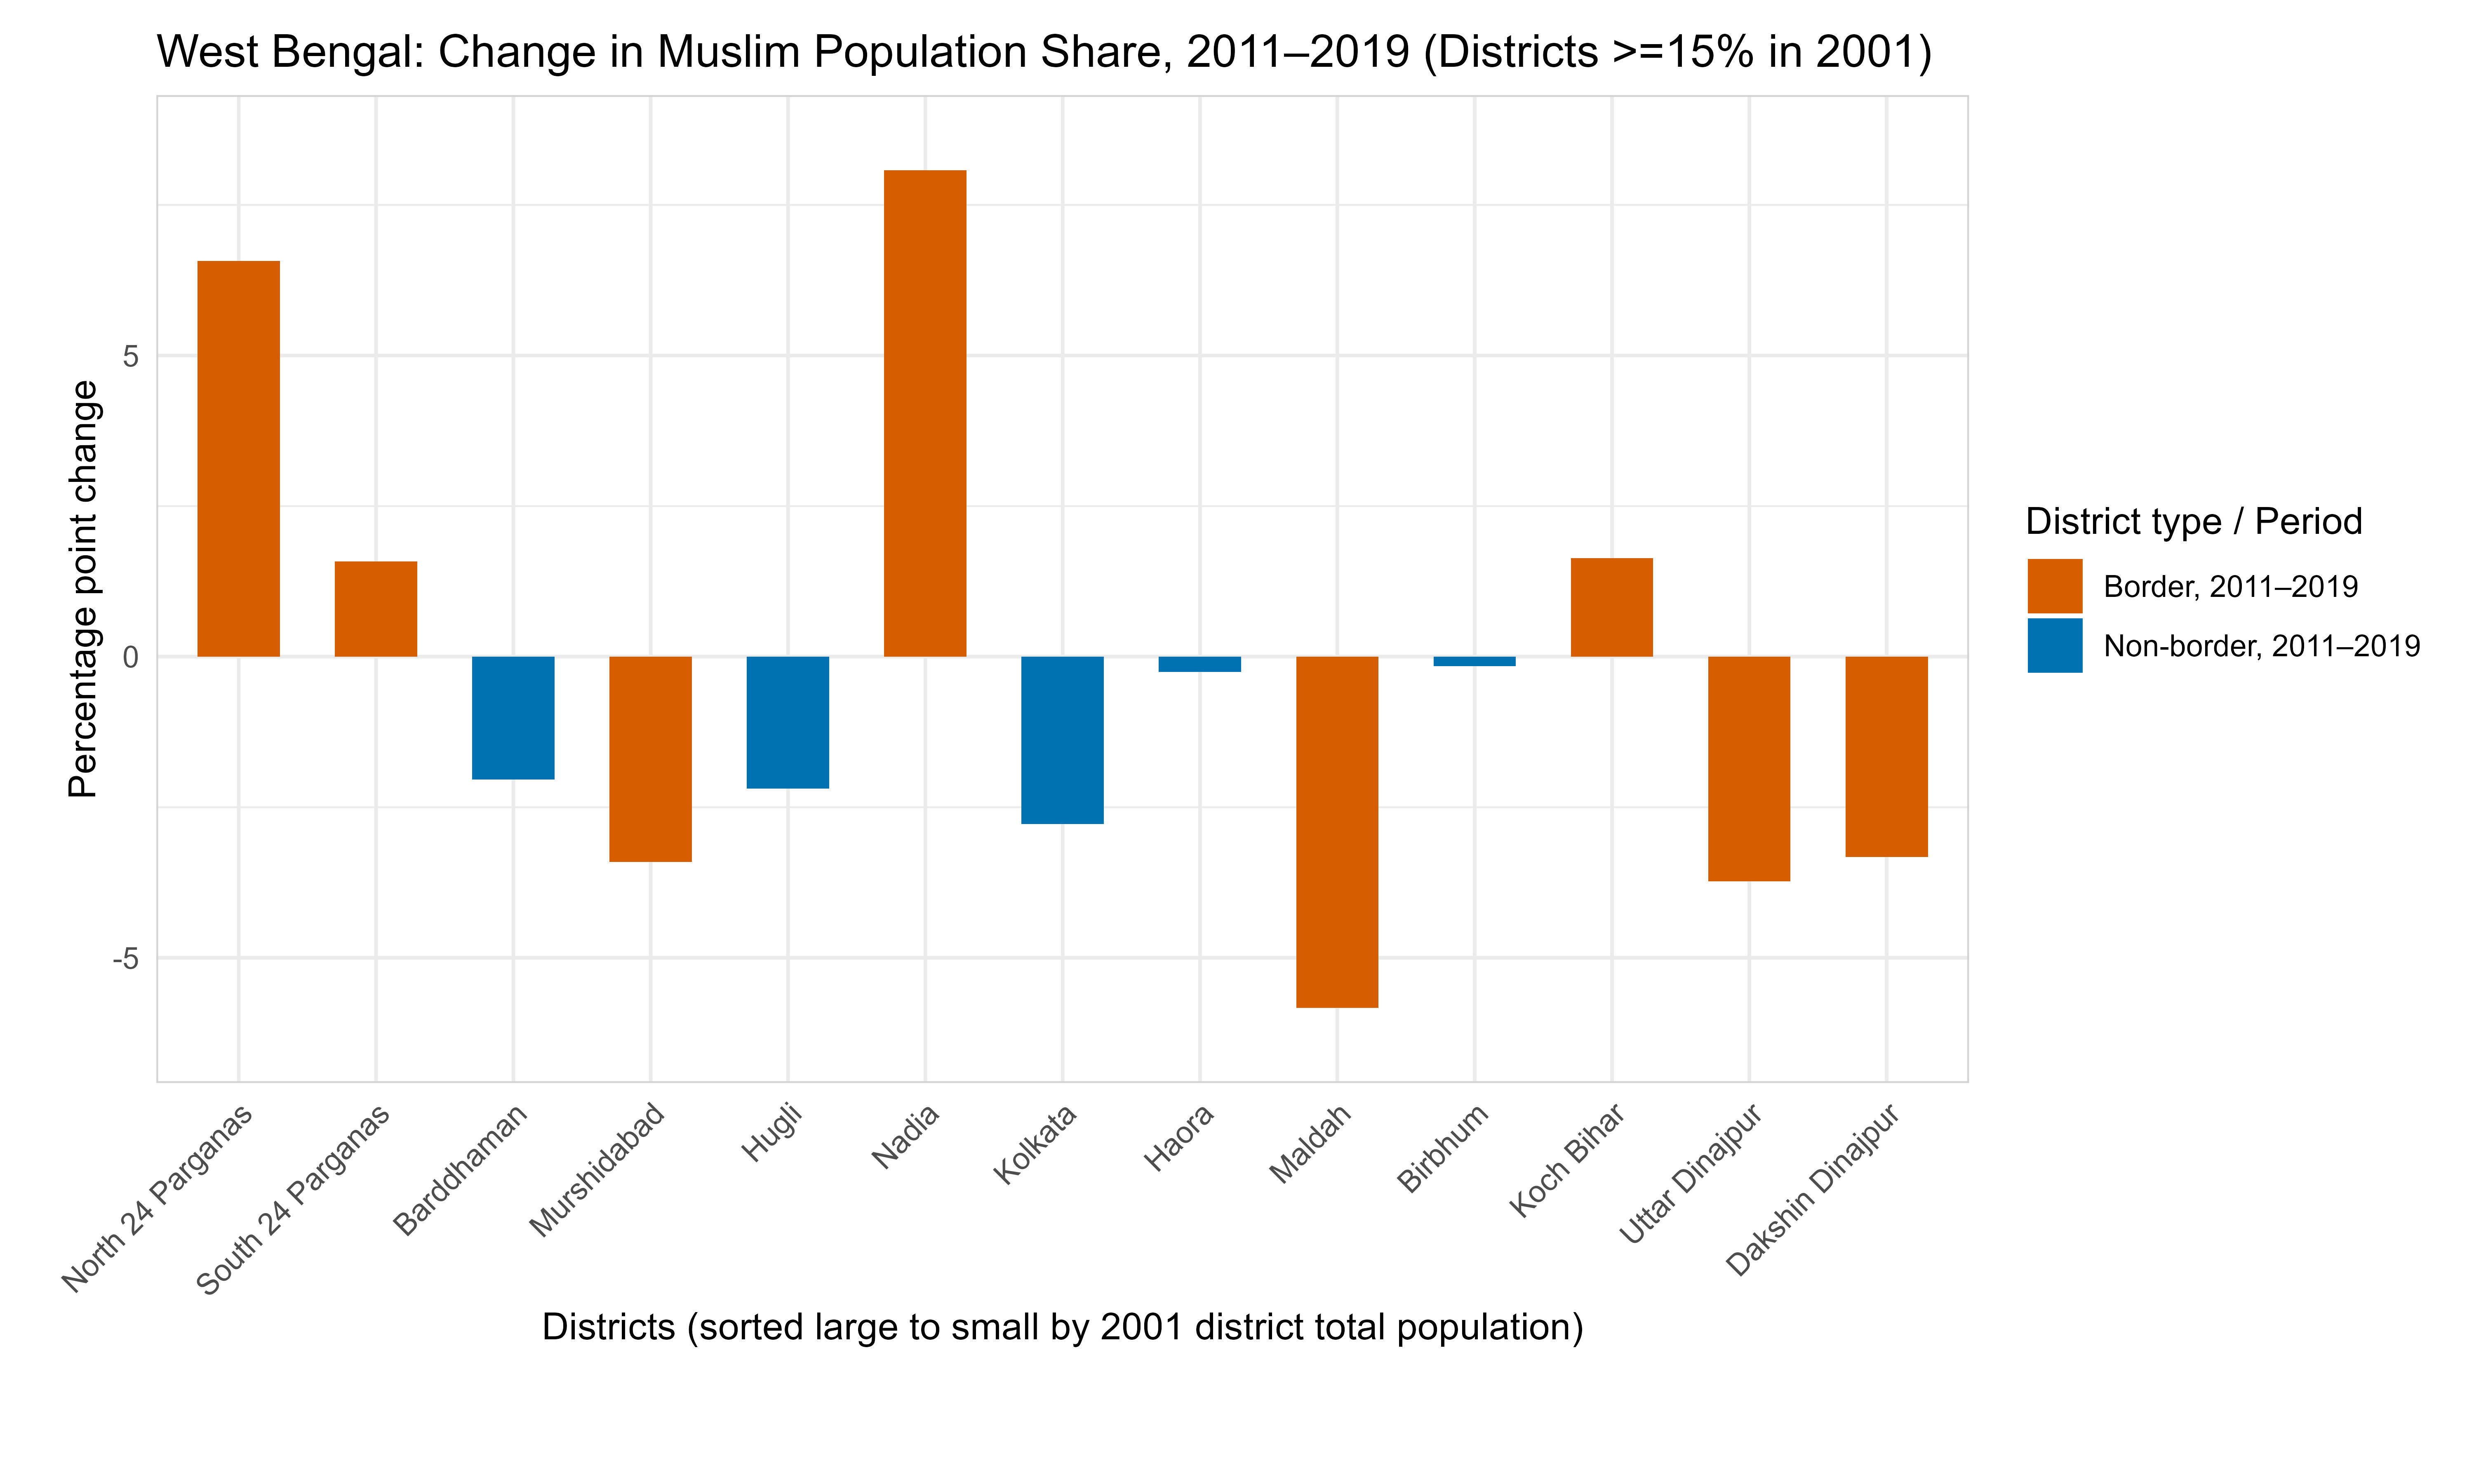
Chart 1 for West Bengal organises districts from the largest to smallest by their 2001 population, with the nine Bangladesh-border districts on the left panel (in orange) and the nine non-border districts on the right (in blue).
Chart 1
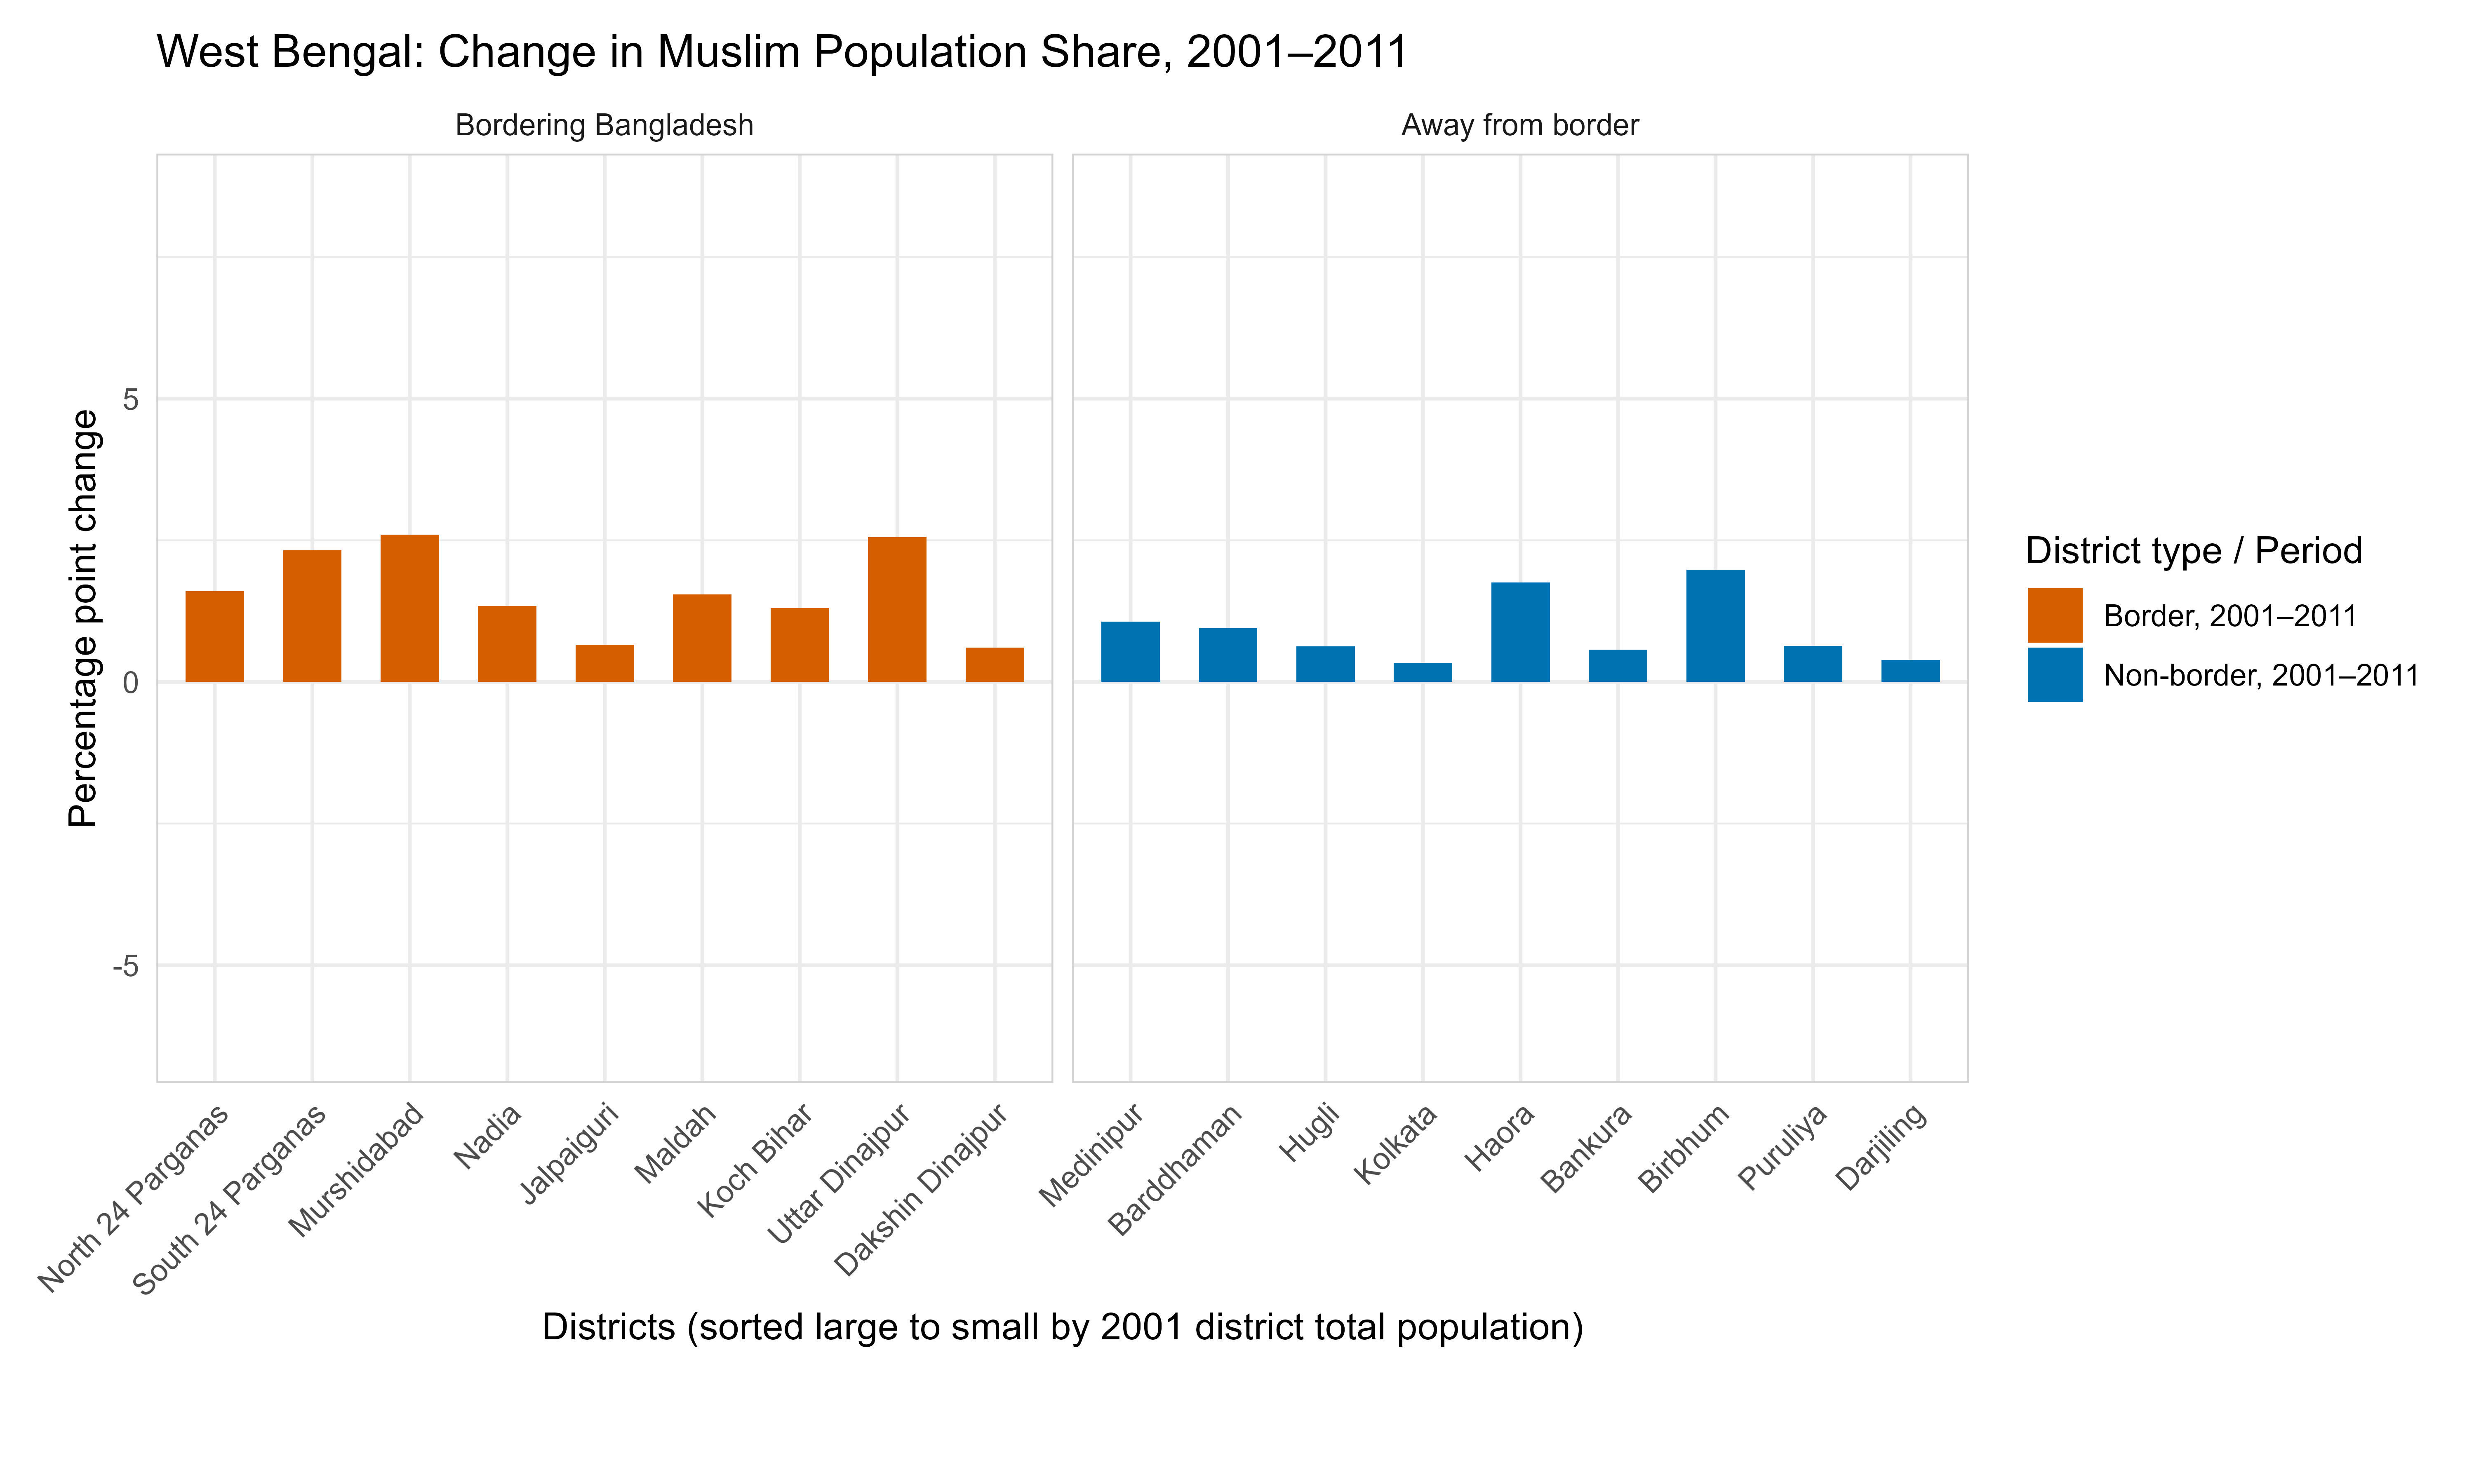
We must first note that while every district in West Bengal recorded an increase in the Muslim share of the population, the highest increase in any district was 2.6 pp over an entire decade. This is not a “changing demography”.
Among border districts, Murshidabad and Uttar Dinajpur saw the largest rise in Muslim share—about 2.6 pp; South 24 Parganas gained about 2.3 pp, while North 24 Parganas, Nadia, Maldah, and Koch Bihar gained between 1.3 and 1.6 pp. Among non-border districts, Birbhum gained about 2.1 pp, Haora 1.8 pp, and Medinipur about 1.1 pp.
Three features of this chart are worth noting. First, there is a modest border-versus-non-border tilt. Border-district gains average a little more than non-border gains, but contrasting patterns are also visible. The border districts of Jalpaiguri and Daskhin Dinajpur saw hardly any increase in the Muslim share over the decade—considerably smaller than the rise in the non-border districts of Howrah and Birbhum.
Second, the overall rise in Muslim share in total population is at the maximum 2.6 percentage points over a decade, or very roughly 0.26% percentage points (a quarter of a percentage point) every year. Nothing in this chart is of the magnitude one would expect from large-scale undocumented immigration changing the demography of the border areas of West Bengal in the first decade of the 21st century.
Third, the imperceptible increase in individual districts and overall is consistent with what demographers studying inter-religious shifts in populations have pointed out. As noted in an earlier section, demographers have long documented a narrowing gap in fertility rates between Muslim and Hindu households in India, with the shifts in population composition being small and slow-moving. These shares are expected to stabilise with the closing of the gap in fertility. The 2001–2011 West Bengal picture is consistent with this process.
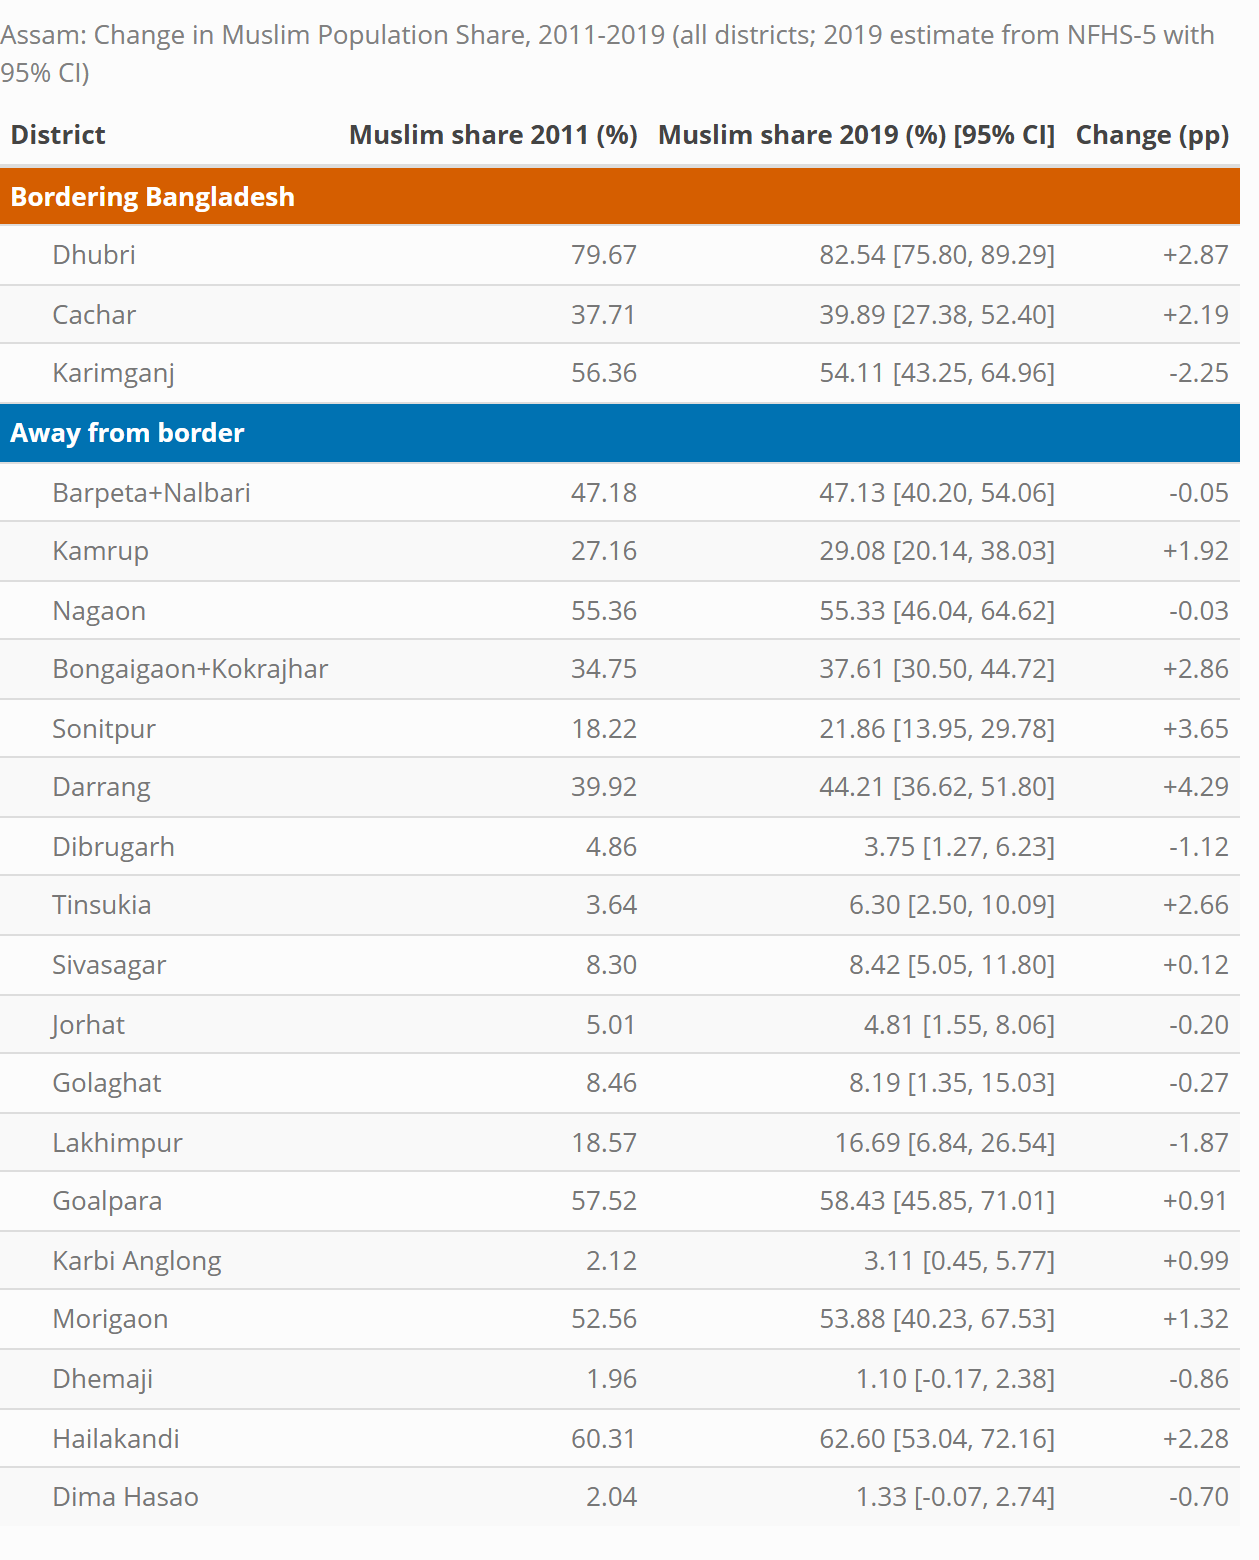
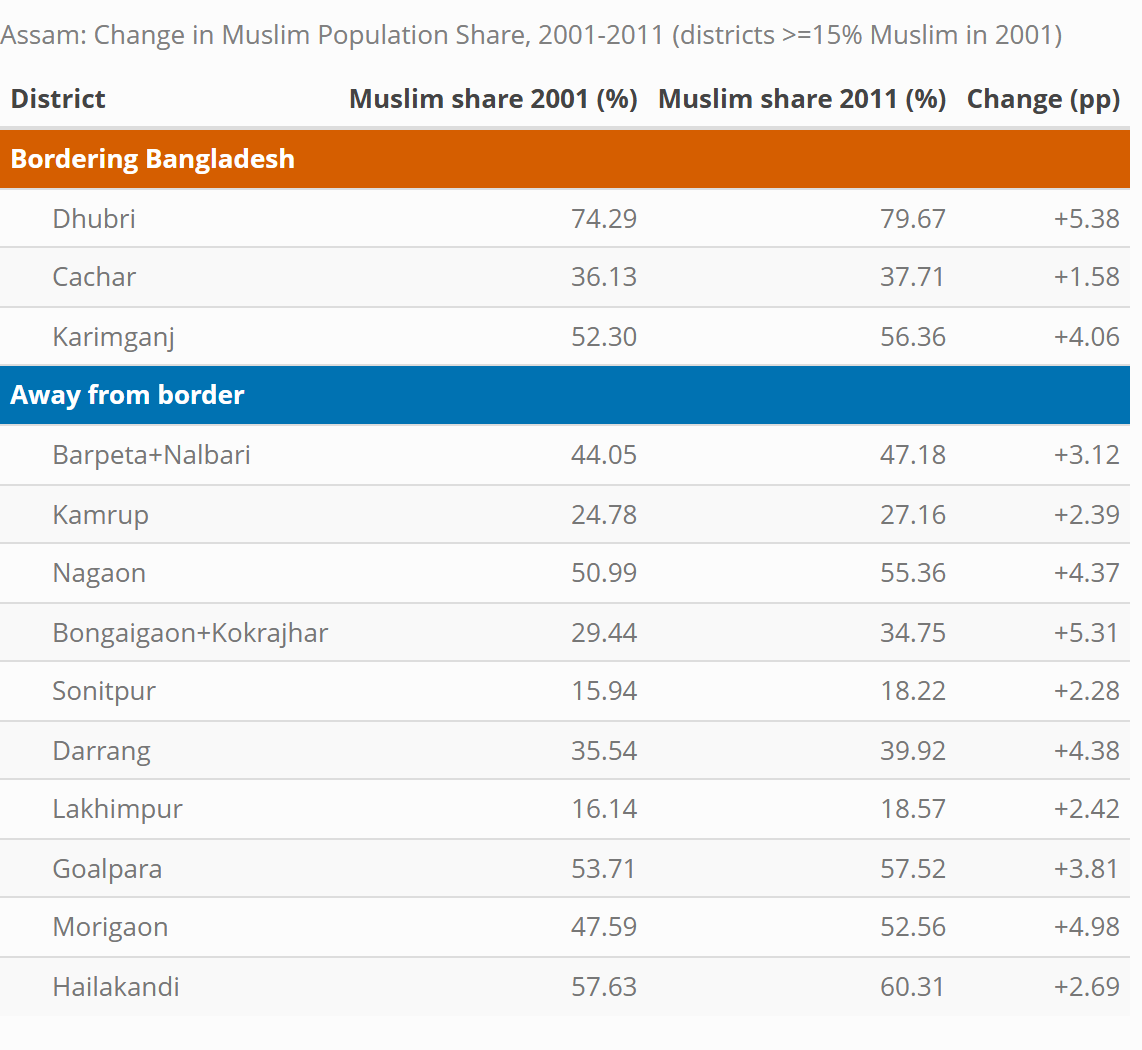
Assam in the same decade looks similar in shape, but at a higher level (See Table 1).
Table 1: Change in Muslim Population in Assam’s Districts Between 2001 and 2011 (Census of India)
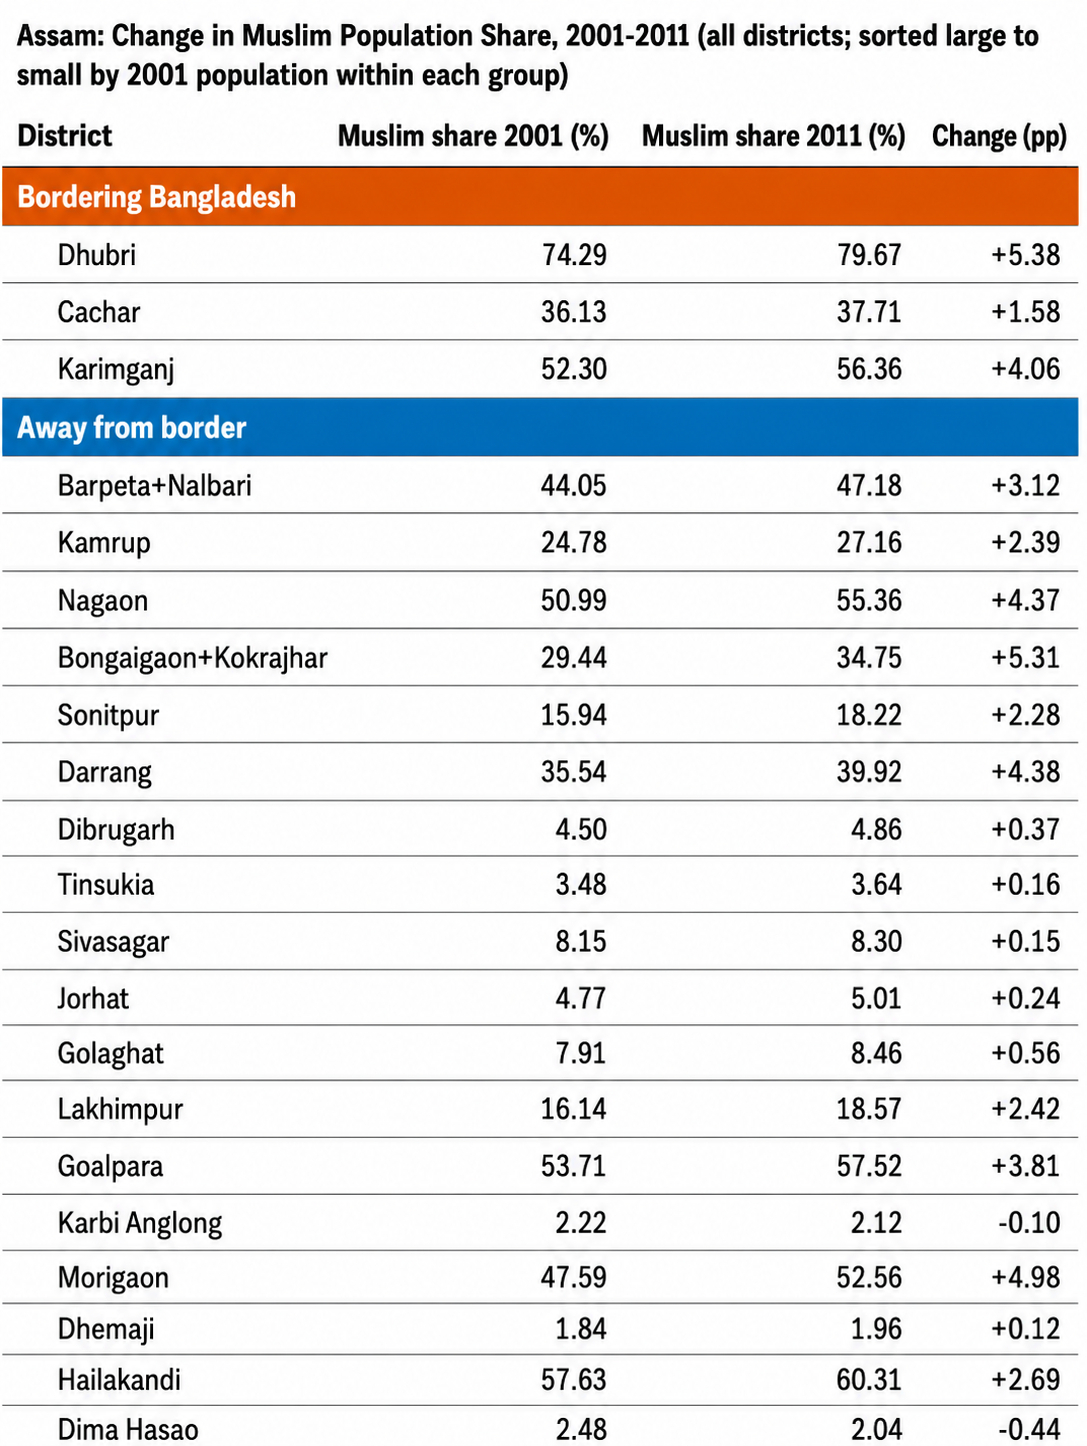
Among Assam’s three Bangladesh-border districts, Dhubri saw the largest increase in the share of Muslims in the total population (+5.38 pp), followed by Karimganj (+4.06 pp) and Cachar (+1.58 pp). But several non-border districts in the interior saw increases of the same order or more: Bongaigaon+Kokrajhar (+5.31 pp), Morigaon (+4.98 pp), Darrang (+4.38 pp), Nagaon (+4.37 pp), Goalpara (+3.81 pp), and Barpeta+Nalbari (+3.12 pp). This puts into question claims of major changes in the composition of the population in the border districts of Assam.
(The higher growth in Muslim population share in Assam compared to West Bengal must be seen in the context of the higher TFR in 2011 of Muslims in Assam vis-vis Bengal [2.38 vs 2.03] in a population which already had a larger proportion professing the Muslim faith [30.9% vs 25.2%]. As noted above, the TFR among Muslims in both states has been declining, more rapidly in Assam.)
The change in Assam in 2001–2011 was dispersed and not concentrated at the border. The two largest single increases of Muslim proportions in the total population (Dhubri and Bongaigaon+Kokrajhar) sit on opposite sides of the border-vs-interior divide.
A demographic shift driven by something as dramatic as large-scale cross-border undocumented migration, which leads to settlement on the border, should have left footprints of an order of magnitude larger than what the censuses record, and it would leave them disproportionately at the border. 4A problem with the argument that large undocumented immigration is changing demography in the border areas is the assumption that migrants looking for better opportunities stay in the border villages and do not move into the hinterland. Neither feature is present.
What does Period 2 show?
3. The 2011–2019 Period
As noted earlier, a comparison of population growth across districts in Period 2 (2011–2019) is more difficult because the Census for 2021 was not conducted.
The NFHS-based 2019 district-level estimates are noisier, as they are based on a sample survey (as discussed in Appendix 1). The change examined in Period 2 is over roughly eight years rather than 10.
Here, because the 2019 estimates are sample estimates, the analysis does not look at individual border and non-border districts but pools them to estimate changes. The shares of the Muslim population in the total in border districts according to the 2019 sample survey estimates are compared to the Census of India 2011 numbers. The 2019 confidence intervals are presented as an indicator of the reliability of these estimates (Chart 2).
In West Bengal, the changes appear negligible for both border or non-border districts, with the magnitudes of increase quite small and under 2.5 pp over the period. In Assam, the border districts show a decline in share, though the estimate is not very reliable with wide confidence intervals.
The away-from-border districts of Assam, however, show a more reliable, but modest increase in the share of Muslims in the population of 3.95 pp. Once again, the signature of the data is not aligning with what one would expect from high levels of cross-border migration changing the structure of the population on the border. (A more disaggregated view of the data according to districts is provided in Appendix 2.)
Chart 2
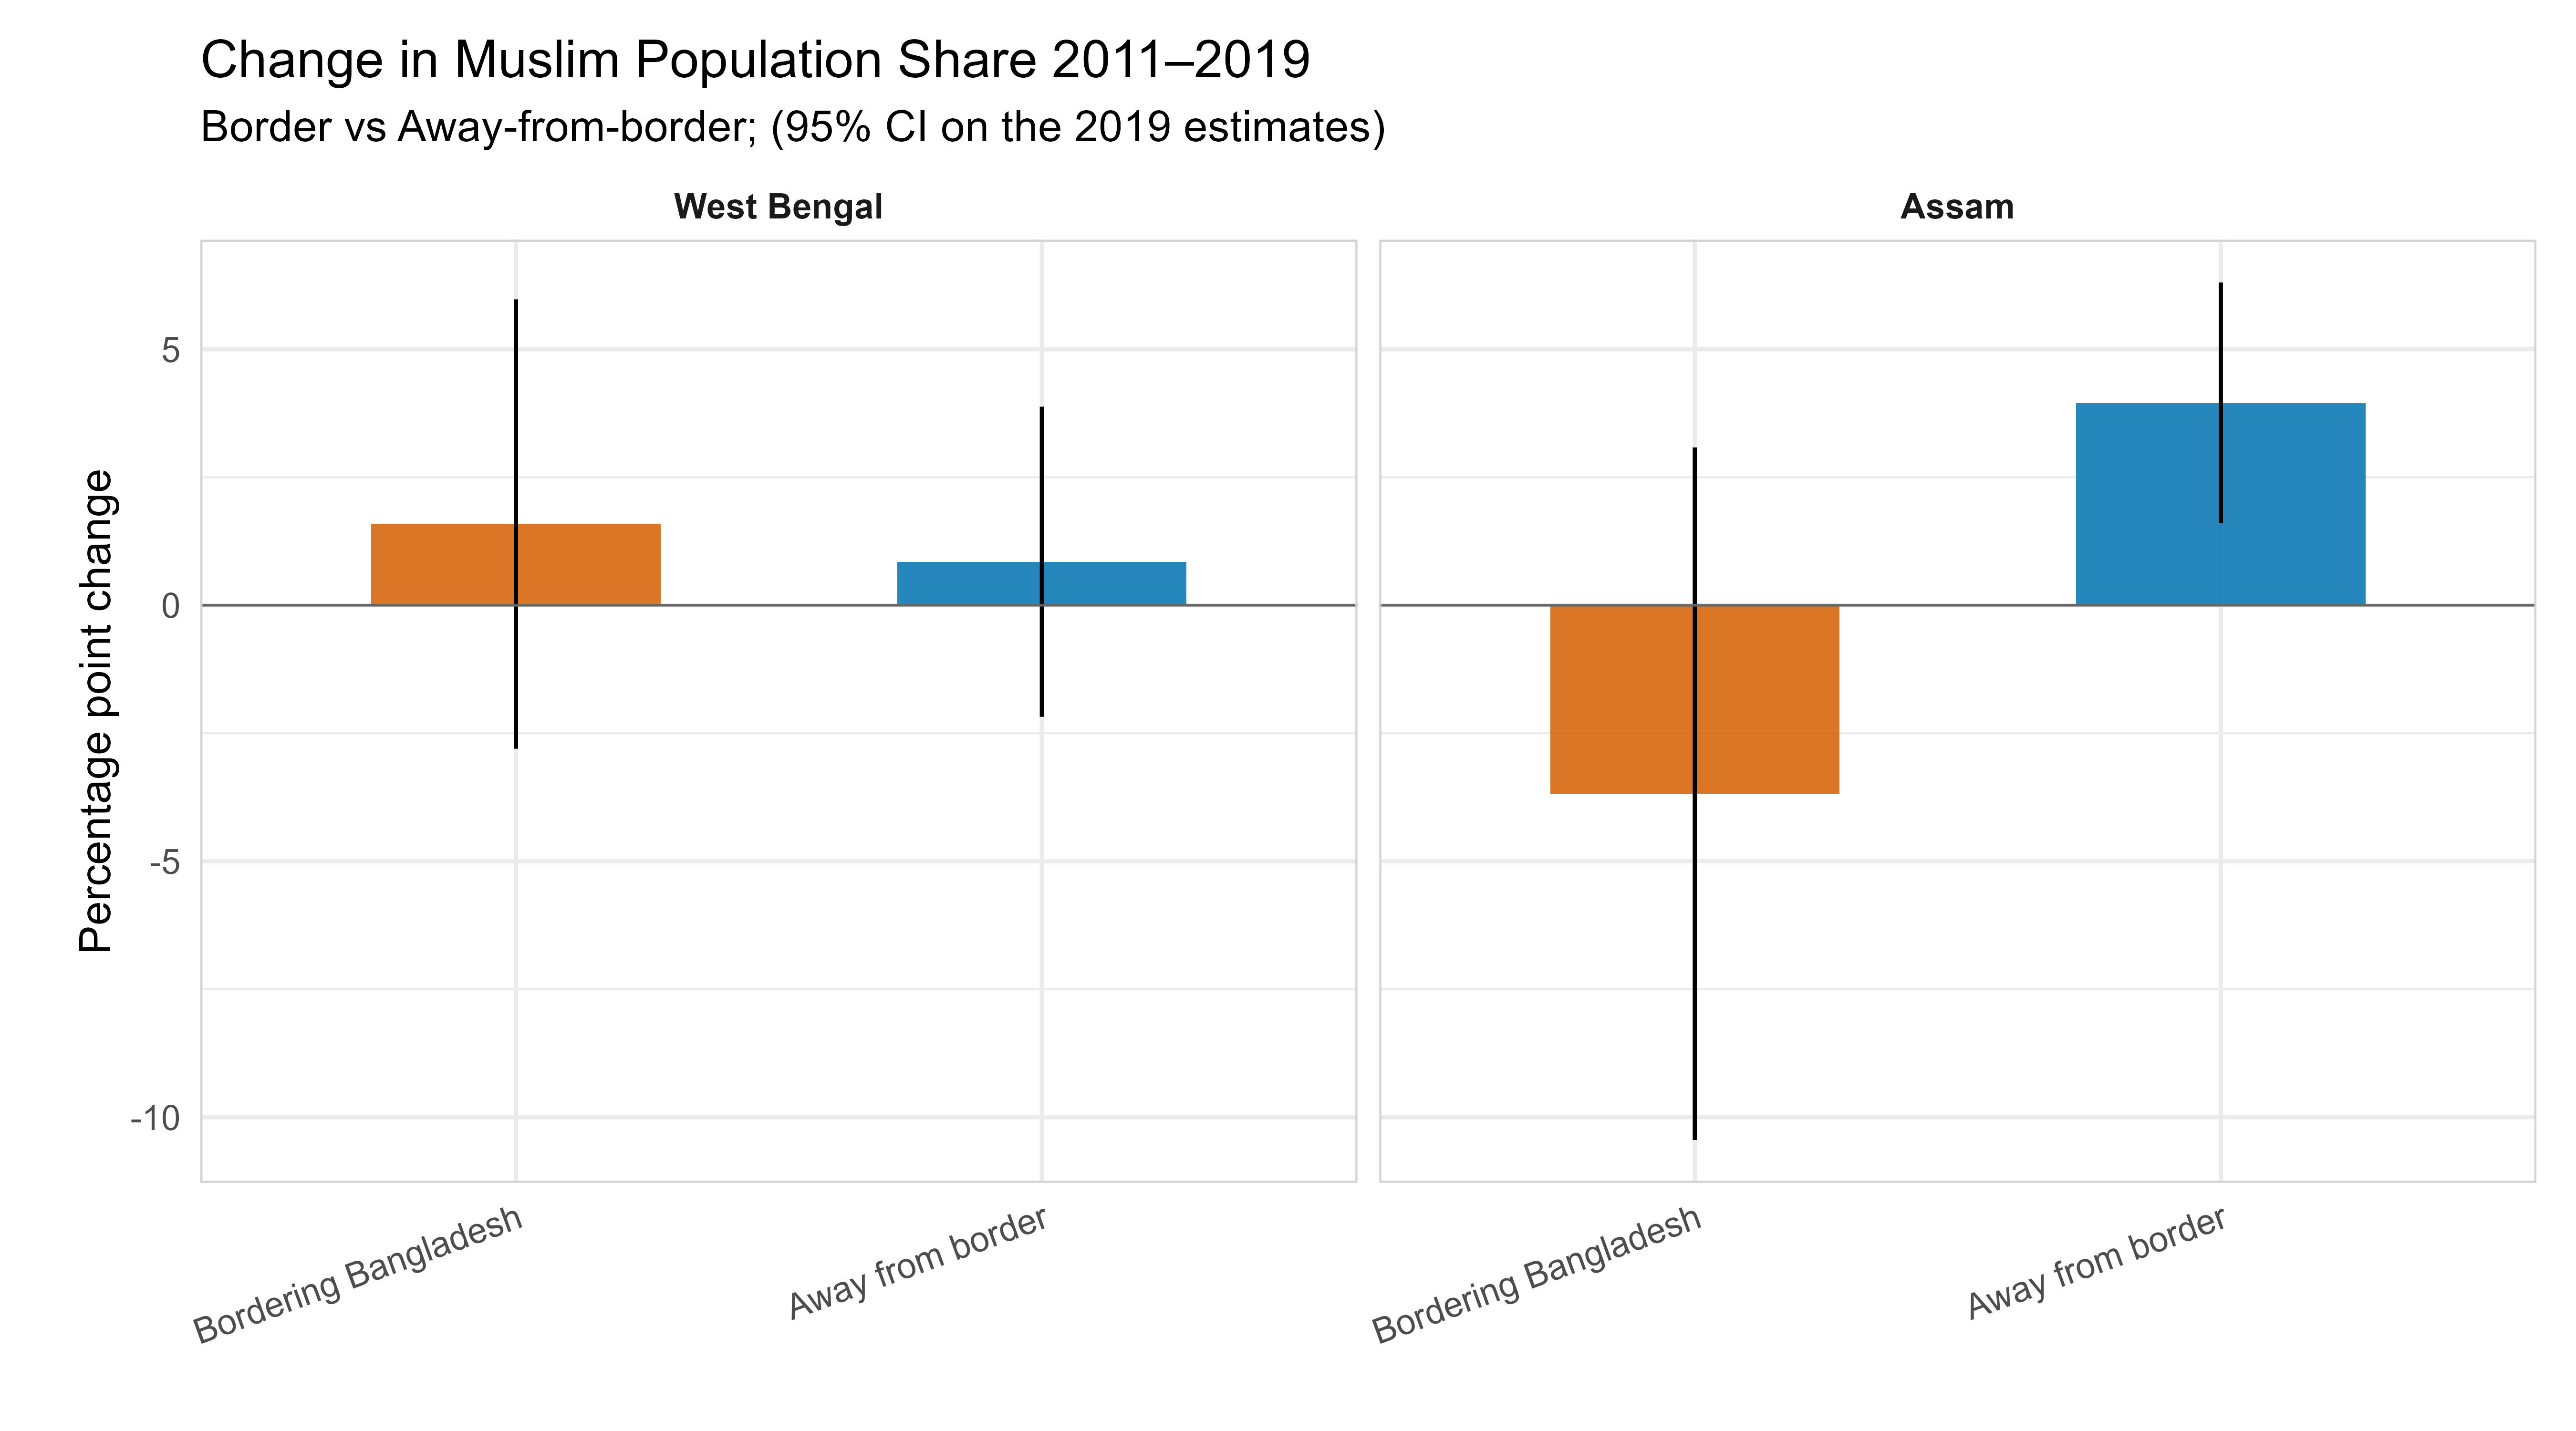
(Chart 2 presents deviations from 2011 to 2019. However, as a census figure is being compared to an NFHS estimate, the lines plotted vertically over the bars indicate how reliable the change measure is in each case. If the vertical line crosses the x-axis line, it indicates that the sign of the estimate is statistically indistinguishable from no change. If the line does not cross the x-axis, the sign of the estimate indicates change. Only the away-from-border increase in Assam is clearly signed. Both West Bengal changes and the Assam border change are indistinguishable from a no change. Or, in other words, we cannot be sure if there is an increase or decrease.)
4. Districts with Substantial Muslim Population
In this part of the analysis, we leave out districts with small initial shares of Muslims in the population, as any changes there will be disproportionately large because of the low base effect. The districts with larger initial shares are also the districts in which the survey-based estimates are more accurate, which would be useful for the Period 2 analysis that involves the NFHS estimates.
The analysis here is restricted to districts with at least a 15% Muslim share of the population in 2001. This covers all of West Bengal’s prominent border districts as well as the heavily populated districts of central and lower Assam.
Chart 3
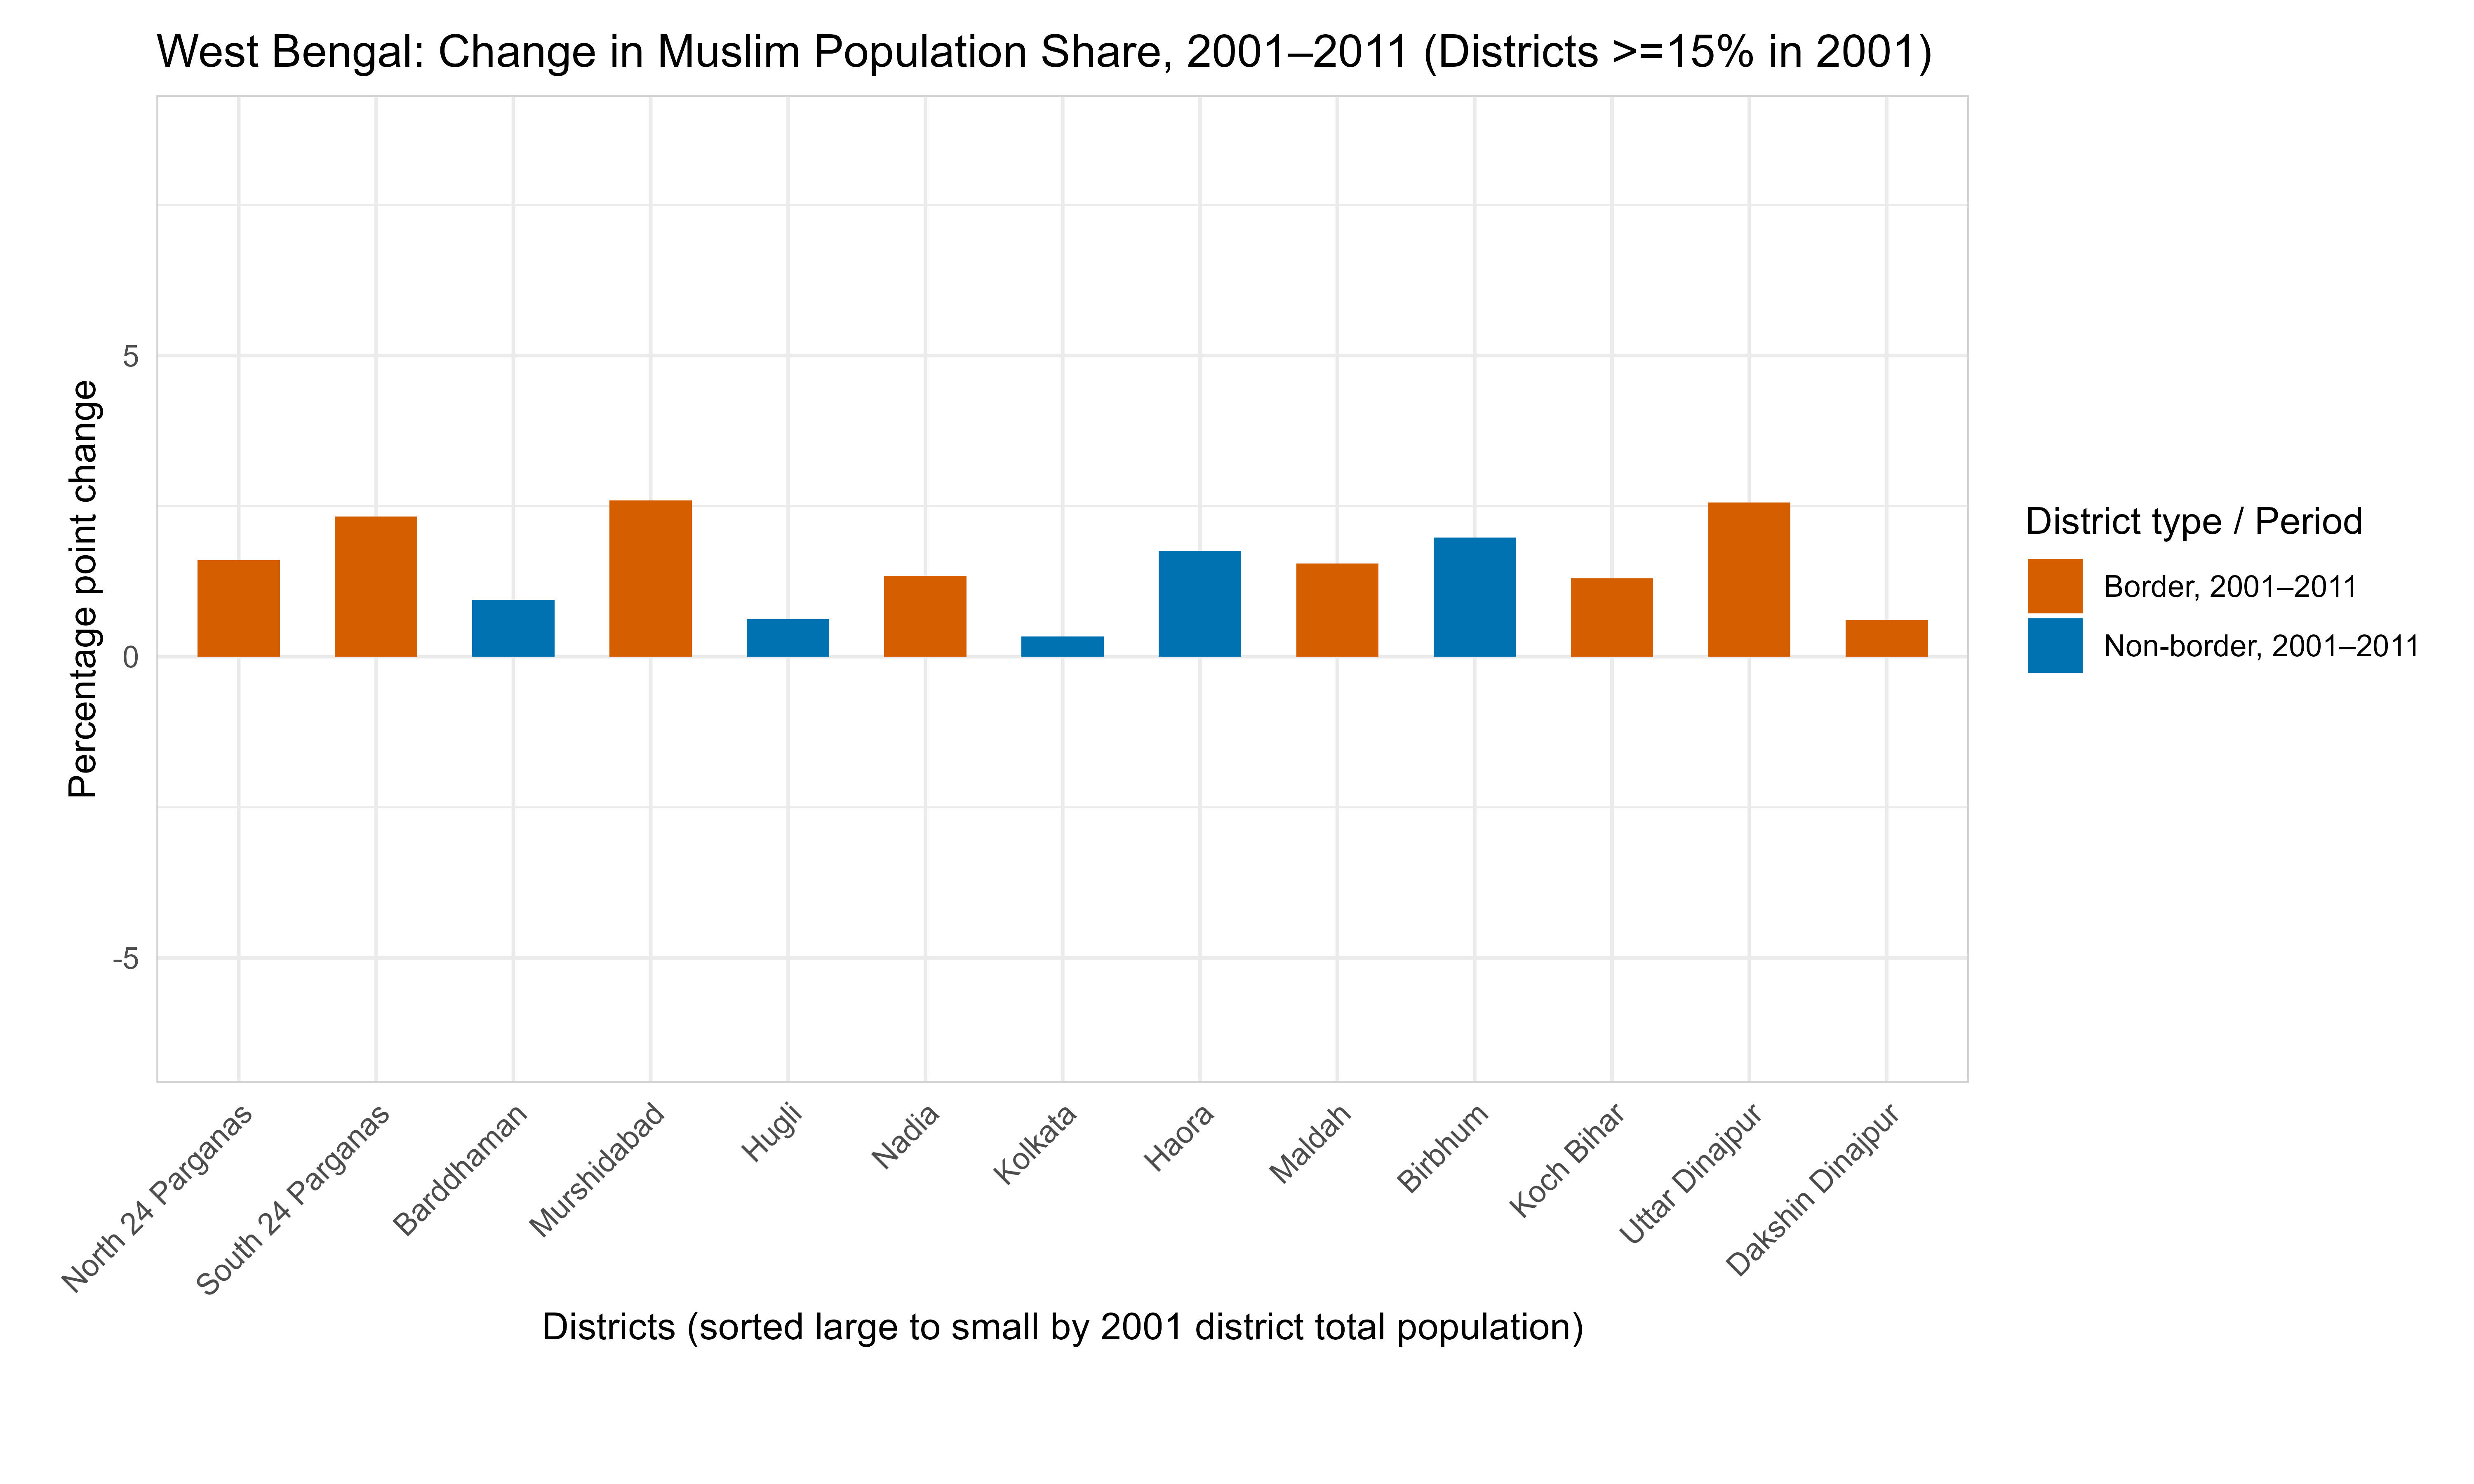
Chart 3 shows that there were both border and non-border districts showing a rise in Muslim population share of 2 to 2.5 pp over a decade (Murshidabad and Uttar Dinajpur among the border districts and Birbhum among the non-border districts). Likewise, among those which showed very small changes there were both border and non-border districts. Clearly, the story is not of demography in the border districts being altered.
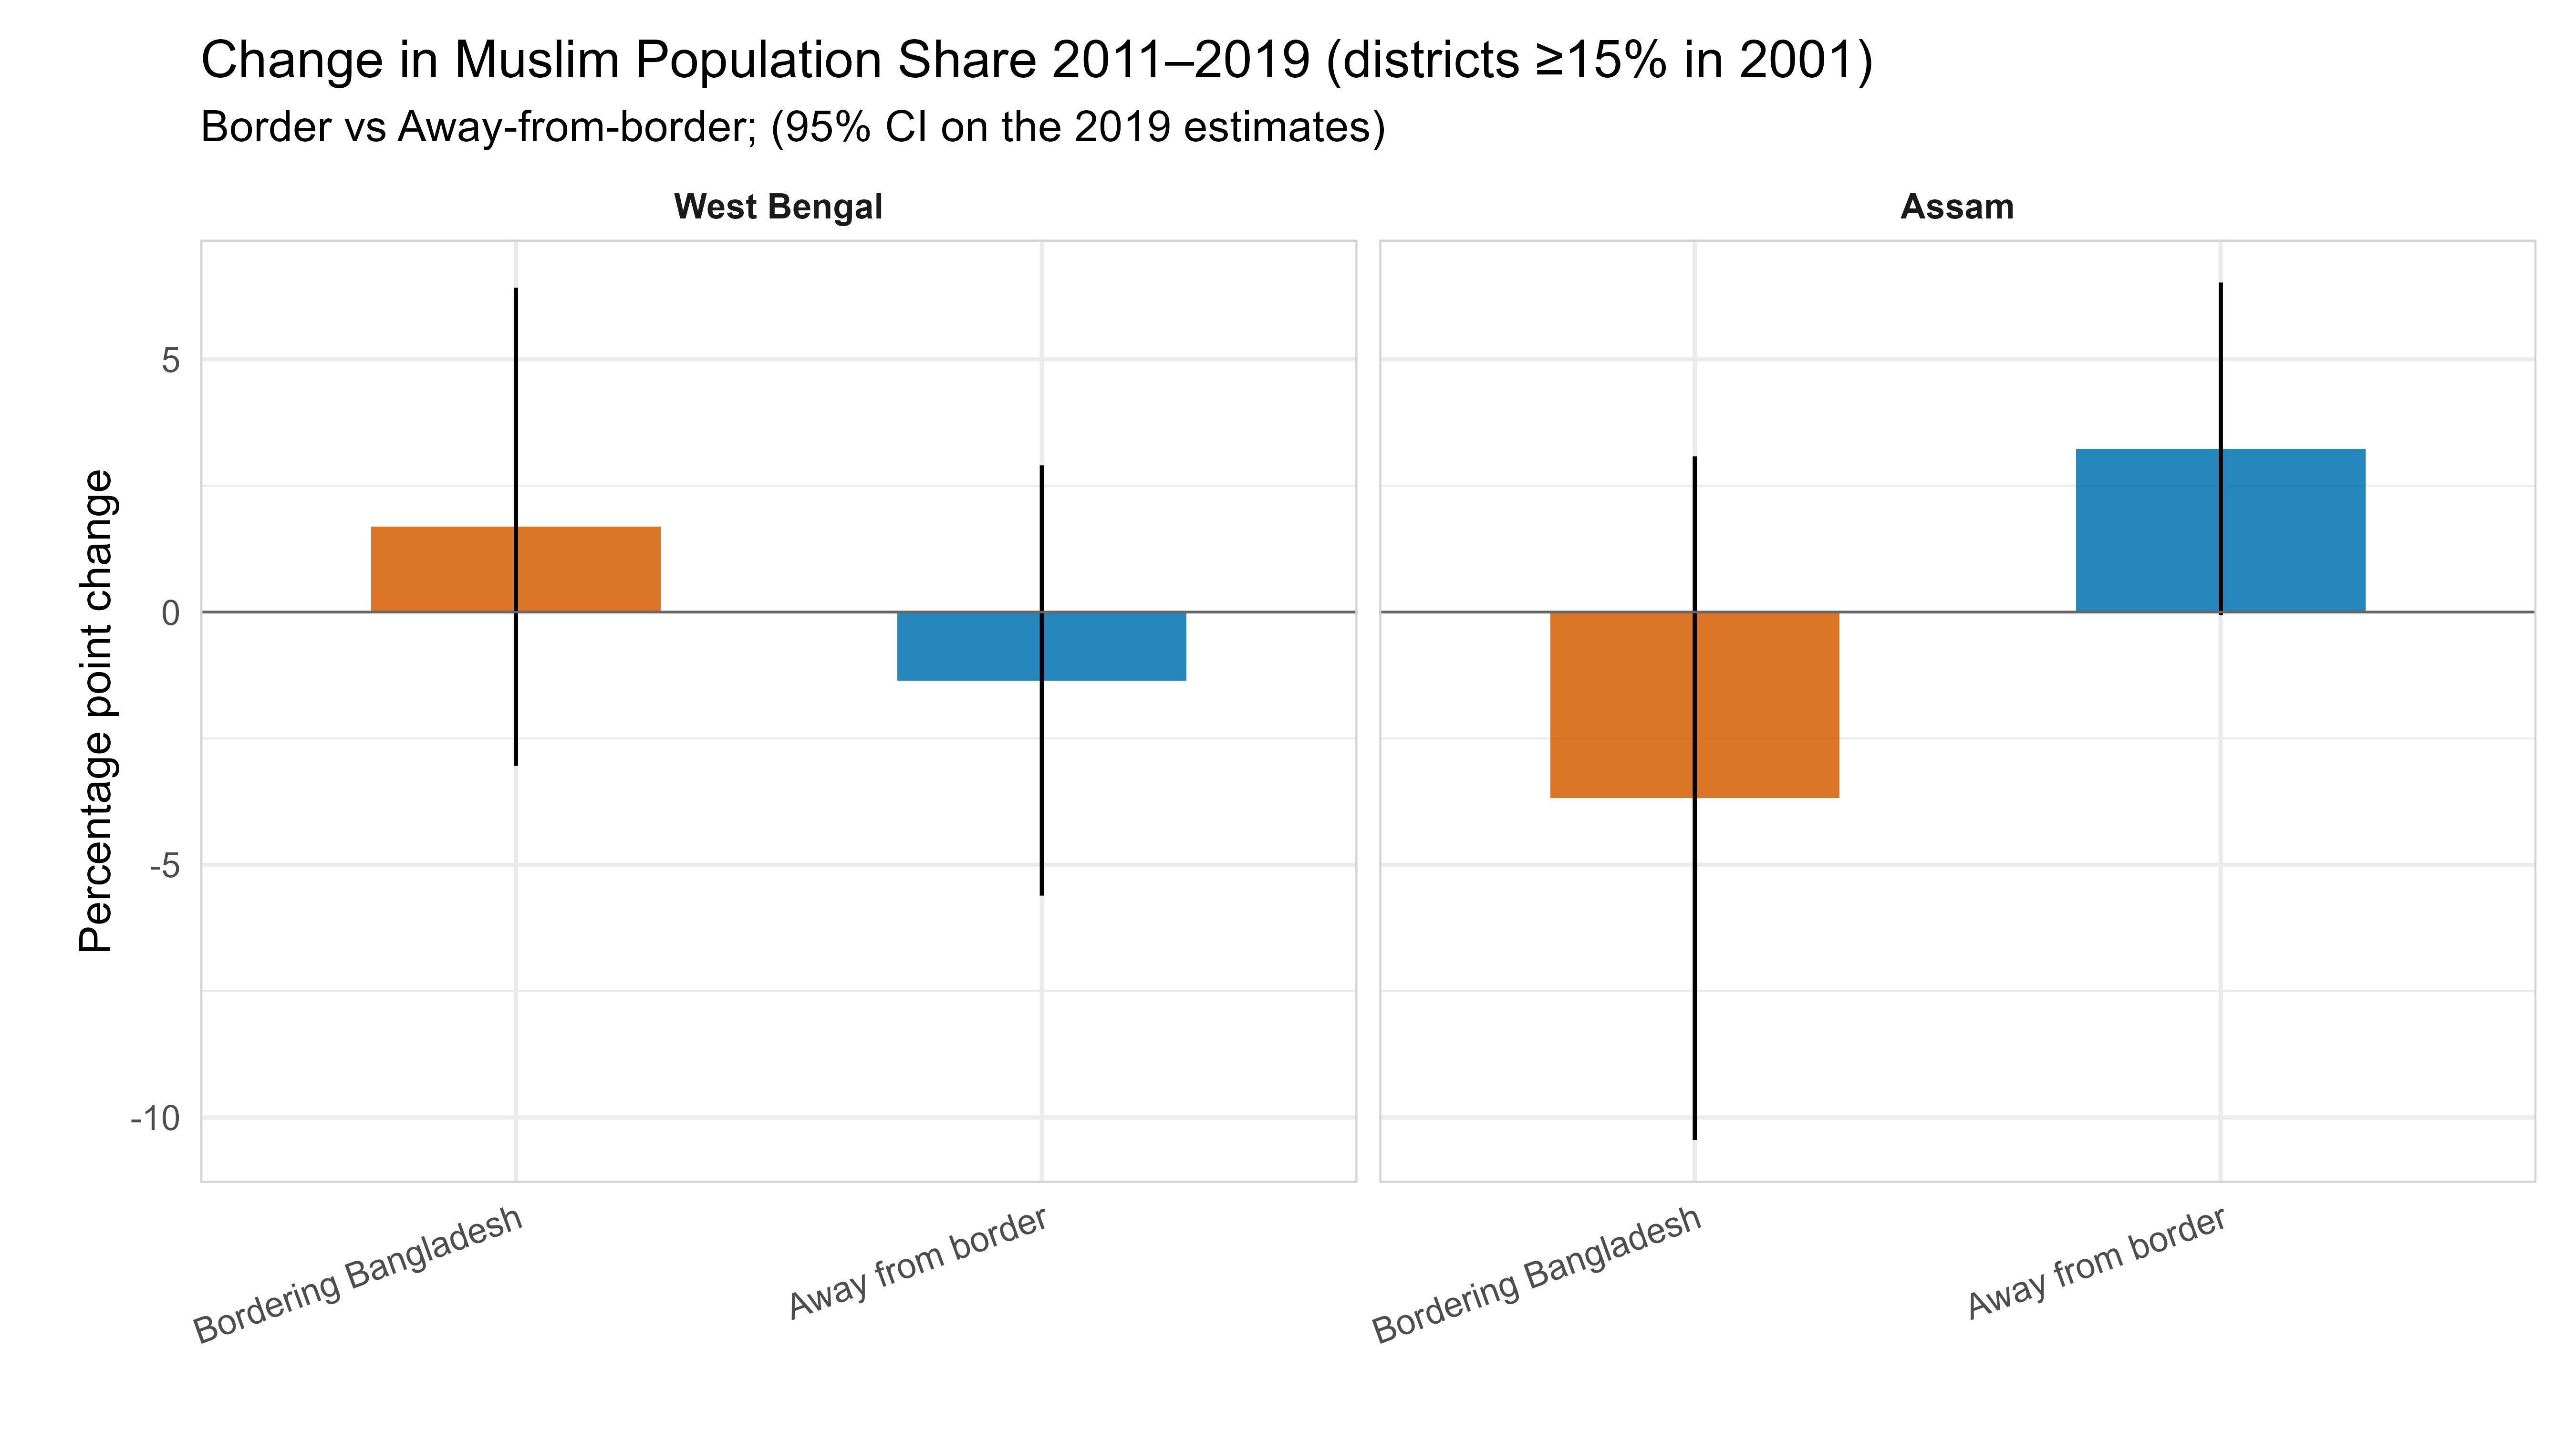
For Period 2 (2011–19), the changes are presented separately in pooled groups for border and away-from-border districts (Chart 4). Here again, the pattern previously described holds, more or less. The estimates of change in West Bengal (where TFRs between Hindus and Muslims are closer to convergence), the increase in the border districts, and the decrease in the away-from-border districts are noisy estimates with wide intervals (notice the intervals are spread over positive and negative change) and indistinguishable from no change. The increase in Muslim share in the away-from-border districts of Assam remains true, just as it was in Chart 2.
Chart 4
5. A Cautious Summary
Pulling the two periods together produces a picture quite unlike the one offered in political speeches.
Between 2001 and 2011, when the data are at their best, the share of the Muslim population in West Bengal’s border districts rose between 0.6 and 2.6 pp over the decade. The numbers do not make us sit up and take note of any major change in the demography of the border districts compared to those in the interior. In Assam, the same decade shows larger increases in the Muslim population in absolute terms, but spread across the state, with three of the four districts with the largest increases sitting away from the international border.
Between 2011 and 2019, the NFHS-based estimates are noisier and individual district point estimates should not be read literally.
None of this rules out cross-border movement, which has been a feature of the region’s life well before 1947 and remains entangled with its riverine geography and kinship networks. It does push back on the specific factual claim that has come to anchor much of political discussion and policies: that the border districts of West Bengal and Assam are being rapidly demographically transformed by undocumented migration. The district-level numbers in the two best data sources available do not show that. They show a modest, slow, and uneven movement in 2001–2011, and a noisier, mixed, and partly negative movement in 2011–2019.
A clearer picture of the nature of the change will be known when the numbers from the delayed Census, being conducted in 2026-27 become available.
6. Settlement-level changes
So far, the analysis has been at the state- and district-level about shares of Muslim populations. The Census of India does not provide religion-wise data at the village or town level, allowing only a population change analysis at this more granular level. But we can explore if, even in aggregate terms, the population of villages at the border have shown a sharp increase.
The data for this analysis is taken from the SHRUG dataset that is based on Census of India data (Asher et al 2021; Census of India 1991, 2001, 2011). The SHRUG dataset assigns a consistent location identifier (the shrid) that links village- and town-level census records across years, enabling cross-census comparison.
The magnitudes of change at the village level tend to be far larger than when viewed at the state or district level. Indeed, a village of a 100 people may be home to 200 or more in 10 years, or a small village may be completely abandoned over a decade (recording large negative changes)—in one case a 100% increase and in the other a 100% decrease. To avoid these kinds of extreme settlements, the bottom quartile of settlements (or those with less than 300 people) in 1991 are left out of the change analysis (these are shown in grey on the map).
This analysis is presented in the form of two choropleth maps. The first shows percentage changes from 1991 to 2001, and the second shows percentage change from 2001 to 2011. Notice that Meghalaya, Mizoram, and Tripura are included here, as they share their borders with Bangladesh.
Chart 5
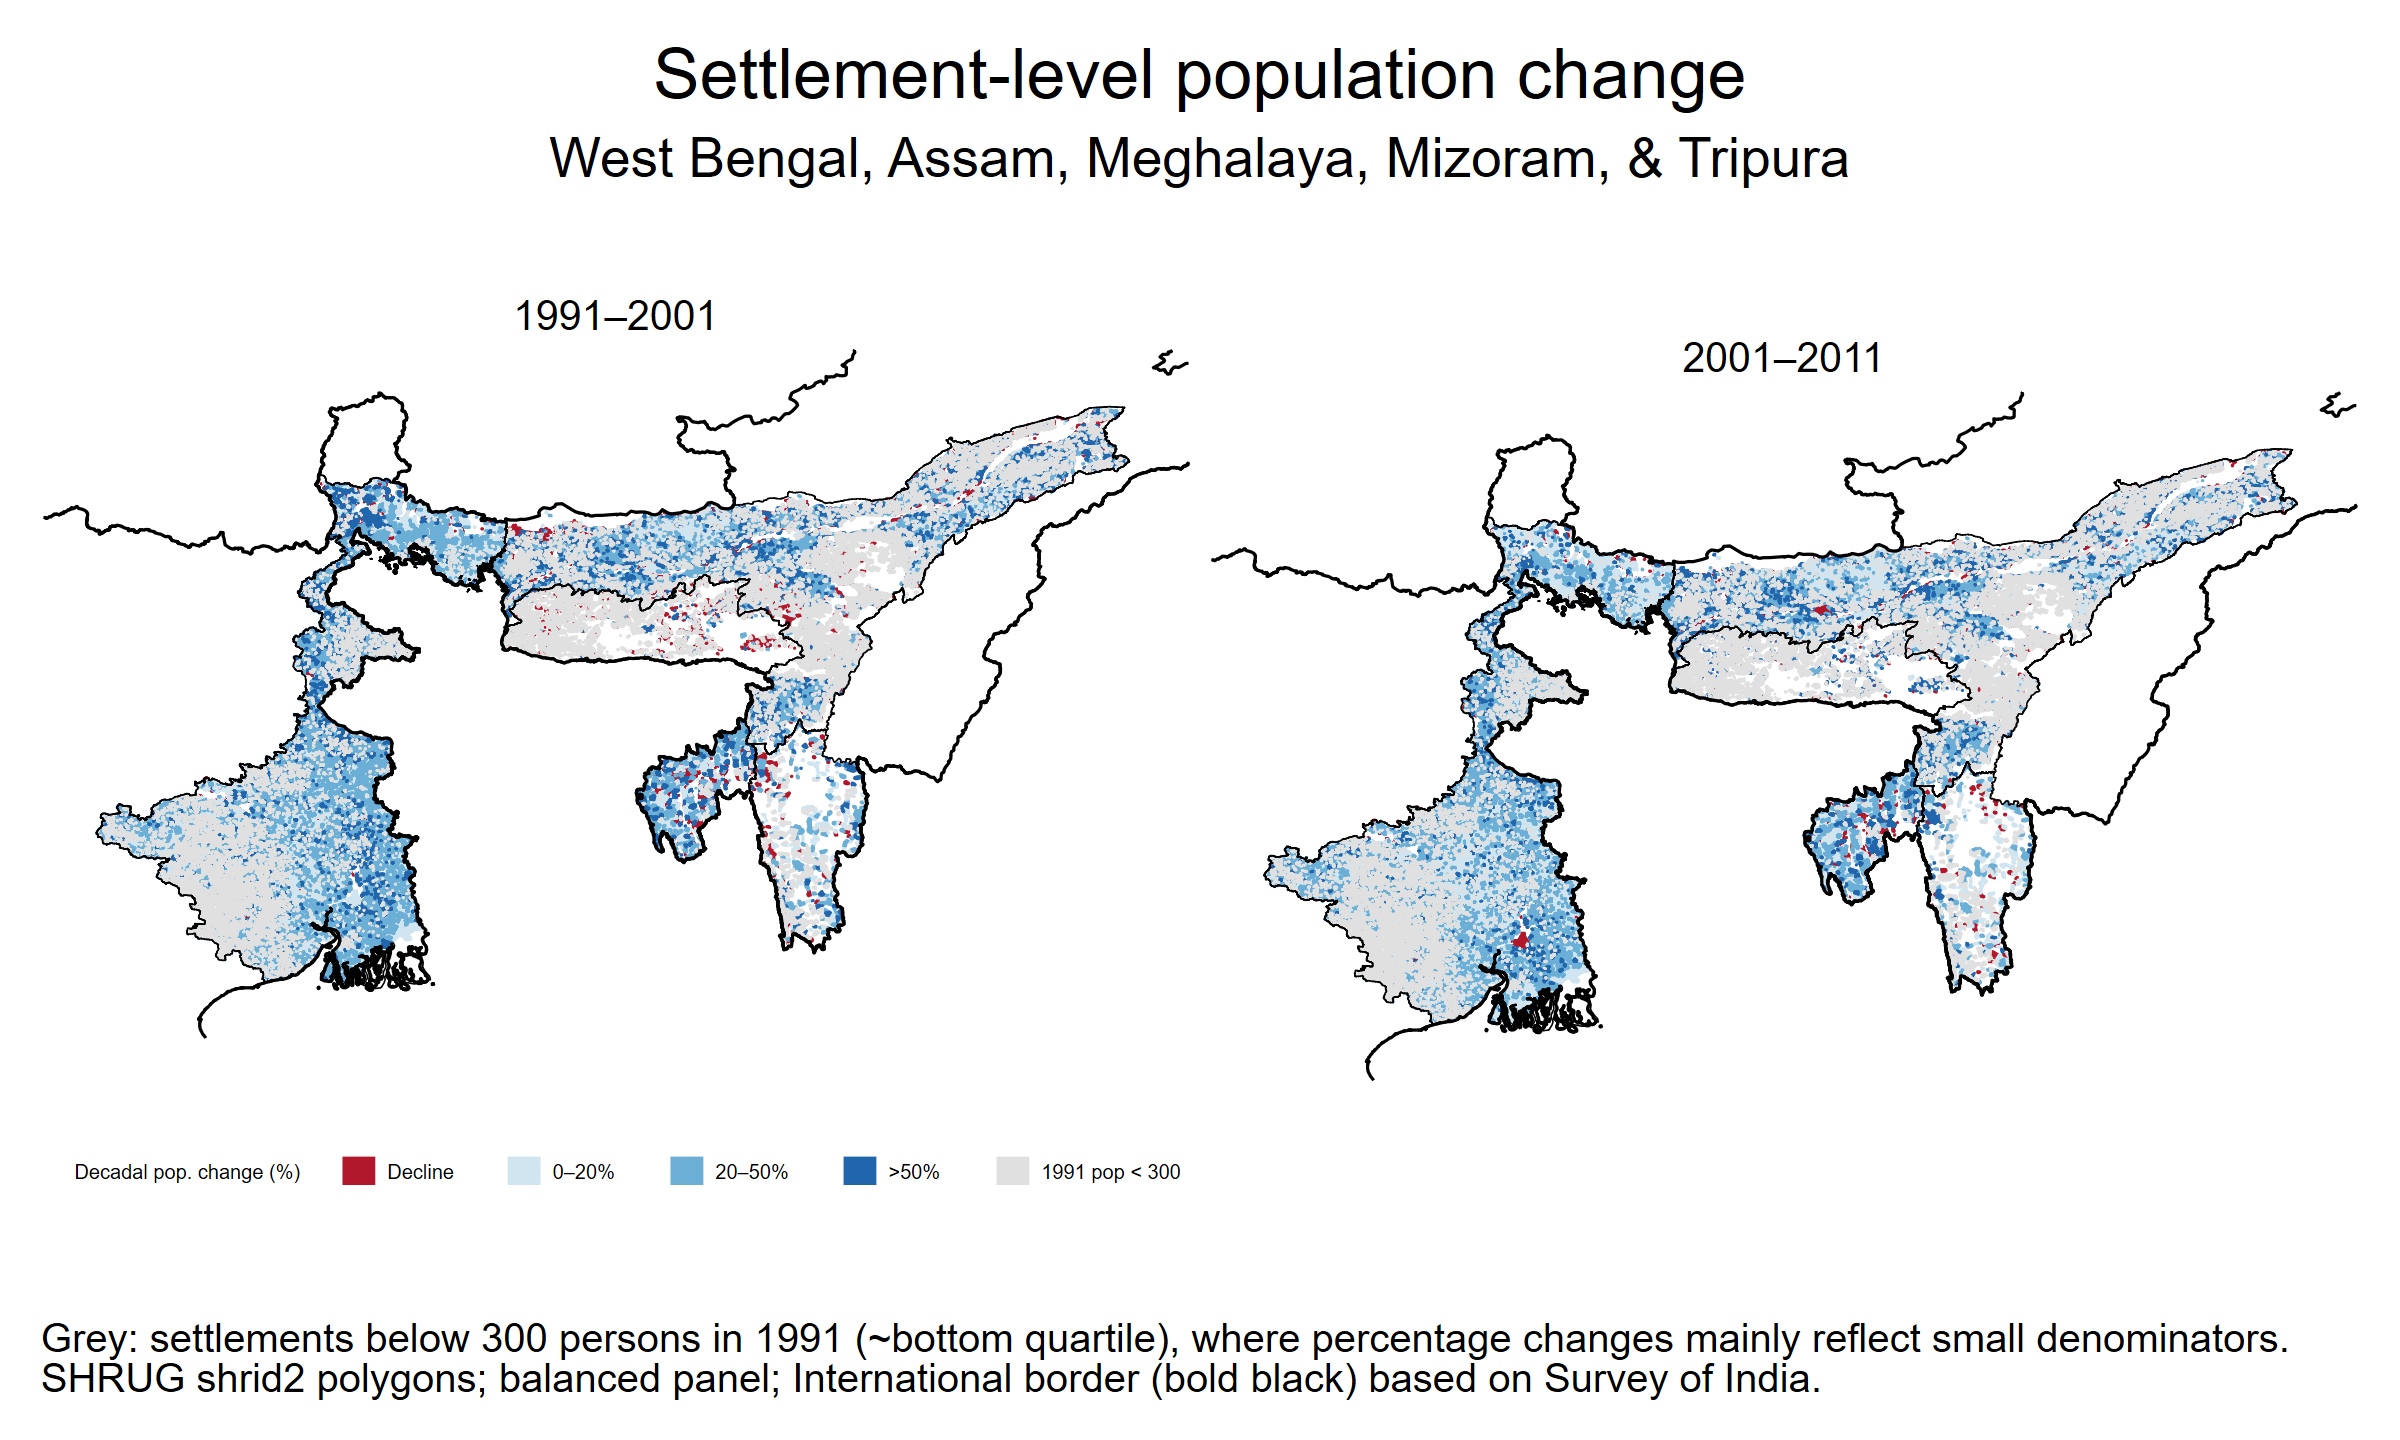
Again, a signature of “infiltration” will be one where border villages show large increases relative to villages located further away.
A simple visual examination shows that the majority of reasonably sized settlements grew between 0–20% and 20–50% during both decades, which is roughly the range of change at the district level too (see Appendix 3). And more importantly, once again there is no clear pattern to suggest that the border settlements saw disproportionately large increases in population.
7. Conclusions
Nine months after Prime Minister Narendra Modi announced that a committee would be set up to study what he called a “grave crisis…looming over India,” with the demography “being changed as part of a conspiracy and a well-planned plot,” the Ministry of Home Affairs constituted the “High-level Committee on Demographic Change” in late May 2026.
It is surprising that prior to this high-level exercise there was little data presented to the public about this demographic change on the border.
In late 2025, the Home Minister in a public lecture put some numbers on the table. According to the 2011 Census, he said, in “several districts of West Bengal” the growth rate of the Muslim population, “exceeded 40 percent” and in border districts ran “as high as 70 percent”.
Our analysis of the Census data shows that in no West Bengal district has the growth of Muslim population in absolute terms been of that order. The fastest Muslim population growth between 2001 and 2011 in any district was 29.8%, in Uttar Dinajpur. Across the nine Bangladesh-border districts the figure ranged from 14% to 30%: nowhere near 40%, let alone 70% (See Appendix 3). More fundamentally, to reiterate, a growth rate is not a migration rate. Total populations in these districts also grew 12 to 23%, so most Muslim growth is simply the natural increase exhibited by the whole population. The Muslim share itself moved up by only 0.6 to 2.6 percentage points over the entire decade.
On Assam, the Home Minister said, “the decadal growth rate of the Muslim population in Assam was 29.6 percent, which would not have been possible without infiltration”. The figure of an increase in the Muslim population of Assam between 2001 and 2011 by 29.6% is correct. But its border districts grew at 25 to 31% (around, not above, the state average), so it is again hard to claim a change in the border demography because of the presence of undocumented migrants (See data in Appendix 3).
In sum, the 2021 Census which will now be conducted in 2026-27 may give us a more accurate picture, and the 2024-25 NFHS data (the summary sheets of which have been recently released) may supplement this information. However, as of now, there is no data which clearly shows demographic change in the border districts of eastern India during the first quarter of this century.
This article has benefitted from the comments and suggestions of a number of scholars; their help is gratefully acknowledged.
The content and opinions expressed in this article by Abhishek Shaw are his and are not necessarily endorsed by or reflect the views of Azim Premji University.
Abhishek Shaw is with the Economics Group, School of Humanities and Social Sciences. Azim Premji University, Bengaluru.
C. Rammanohar Reddy is the Editor of the ‘The India Forum.’
The article was corrected for a few typographical corrections and two maps of West Bengal and Assam which appeared earlier have been deleted because the listing of districts in the maps are of 2026 and slightly different than those in the charts/tables which are as the districts were in 2001.