
1. Definitions of food security and food insecurity
Already back in 2007, the late D. John Shaw (a truly eminent commentator, given his long career as evaluation and policy advisor for the World Food Programme) had noted how the expression “food security” had been used, over time, in many ways and with different meanings. This clearly posed a challenge for assessment, which Shaw – somehow sadly, yet appropriately – defined as “the graveyard of aspirations” in the concluding part of his comprehensive account of the history of world food security since 1945 (Shaw 2007).
The most widely quoted definition of food security, according to which “food security exists when all people, at all times, have physical and economic access to sufficient, safe and nutritious food to meet their dietary needs and food preferences for an active and healthy life” (FAO 1996) is, unfortunately, almost useless as a practical guide for quantitative, empirical assessments of “food security” as, rather than describing an observable state of the world, it depicts what can only be taken as an ambitious, aspirational situation. If taken literally (“all people, at all times”), it is evident that such a condition will never exist, as there will always be somebody, somewhere, at least sometimes, failing to meet their dietary needs and food preferences. Such a construct of “food security” can thus hardly be considered a measurable one. A related problem for assessment is the complex nature of food security, frequently described as composed of “pillars” or “dimensions”: availability, access, utilisation, stability, and the more recently added, agency” and sustainability (HLPE 2020).
One consequence of the complexity of the subject matter and of the evolution of the associated thinking has been a proliferation of “food security” indicators that, when carefully scrutinised, at best capture only some aspects of the problem, and that therefore should perhaps be more precisely described as indicators of, say, “sufficient food availability”, “adequate food access” and “good nutritional status.”
[T]he continued quest for synthetic, composite indicators that ideally combine the information provided by different variables into a single “metric” of a very general concept of food security, adds to the risk of misinterpretation and misuse of the available evidence.
Moreover, over the years, analysts have devised various creative ways to aggregate the different indicators, in an attempt to synthesise the information contained in them into one-dimensional “indexes” or “scores” that are then used to rank and classify individuals, households, population groups, or countries. 1Examples of such attempts are, on one hand, the Global Hunger Index (https://www.globalhungerindex.org/) and the Global Food Security Index (https://foodsecurityindex.eiu.com/), used to rank countries in a hypothetical list from the most to the least food secure. Unfortunately, the continued quest for synthetic, composite indicators that ideally combine the information provided by different variables into a single “metric” of a very general concept of food security, adds to the risk of misinterpretation and misuse of the available evidence. Even though the ranking of countries may serve the purpose of creating awareness and attracting attention to the problem, the index on which the ranking Is based can never be used, as such, to effectively guide policies. Users are always better advised to try to unscramble the index and explore what each of the elementary components contributes.
The main message here is that, for assessment purposes, a clear, unambiguous operational definition of what is being assessed is essential. In this sense, a dictionary definition of food security as “the state of having reliable access to enough healthy food that you can afford” (Oxford Learner’s Dictionary 2021) somehow helps, as it narrows the focus on individuals’ access to food (as opposed to pooling access together with issues of food availability and utilisation). Such a focus was adopted in writing Target 2.1 of the United Nations 2030 Agenda for Sustainable Development, which reads:
By 2030, end hunger and ensure access by all people, in particular the poor and people in vulnerable situations, including infants, to safe, nutritious and sufficient food all year round.
While this still leaves the details to be specified (e.g., What does “reliable” means? What is “enough” food?), it at least allows us to move from abstract aspirational definitions towards more operational ones. Seen from this perspective, the objective of a food security assessment may be taken as to estimate how many people, in a given moment and in a given population, have regular access to “enough” food, which is the principle that inspires the two food security indicators officially included in the monitoring framework of the Sustainable Development Goals (SDG): the Prevalence of Undernourishment (SDG indicator 2.1.1), and the Prevalence of Moderate or Severe Food Insecurity based on the Food Insecurity Experience Scale (SDG indicator 2.1.2). Both indicators have a strong foundation in principles of statistical inference and include features that recognize and address specific problems with the data commonly available for assessment. The statistical sophistication needed to ensure their validity, however, makes them appear overly complicated, a reason why they have occasionally been criticized, especially by the less sophisticated analysts and commentators, who have also suggested simplified solutions.
2. How to measure people’s ability to access food
Given the adopted definition of food security (i.e., the ability to access enough food to be able to sustain a healthy and active life), the most direct way to assess the food security status of an individual would appear to be based on contrasting the food acquired by individuals with appropriate normative, nutritional benchmarks. If such an assessment were conducted on a representative sample of a population, the extent of food insecurity in the population would then be estimated as the proportion of the individuals in the sample for whom the food consumed does not cover the requirements.
Persisting problems with the use food consumption data
While intuitive, such an approach is only apparently simple. Implementing it for empirical assessments presents several, non-trivial, challenges. First, it would require measuring how much food people regularly consume, which, in most contexts, is very difficult. Obtaining food consumption data at the level of detail and precision that allows for proper assessment is quite costly. Second, it calls for defining an appropriate benchmark to establish adequacy of the food consumed, also a not trivial endeavour, as assumptions need to be made on which aspects of food consumption are considered relevant (e.g., the dietary energy content, the composition in terms of nutrients (carbohydrates, proteins, fats, fibre, minerals, vitamins), its safety (absence of toxins, etc.) explicitly defining what is healthy, and how much is enough.
Despite the difficulties, the analysis of data on food consumption has formed, for long time, the most common basis for food security assessments. That has been the road taken, for example, by the Food and Agriculture Organization (FAO) of the United Nations, which has long been engaged in the analysis of food consumption data (FAO 1993; FAO and The World Bank 2018). In producing its most cited statistics, the Prevalence of Undernourishment (PoU), most commonly referred to as the FAO “Hunger numbers”, produced continuously since 1974, the FAO has traditionally focused on the concept of adequacy of food consumption based on dietary energy. Undernourishment has been operationally defined as the condition when the dietary energy contained in the food that is regularly consumed is not sufficient to cover the energy requirements for active and healthy life, a concept that remains valid and currently informs SDG indicator 2.1.1.
Despite its popularity and long history, food security assessments based on the PoU present several drawbacks that have been repeatedly debated in international forums. The fundamental problem remains that availability of food consumption data from surveys is largely insufficient to allow timely and reliable assessments. To appreciate the extent of the problem, consider that FAO only publishes estimates of the PoU as three-year averages and only at the national level. Moreover, the lowest reported value of PoU is equal to 2.5% of the population, equivalent to the expected average margin of uncertainty, given current data. This is useful to monitor medium- and long-term trends in the fight against hunger for developing countries where undernourishment is a serious concern. But the indicator and the data typically used to inform it (average food supply at the country level, and degree of inequality in food consumption as gauged from the analysis of food consumption data contained in nationally representative household surveys) have clear limitations as the timely and granular evidence needed to inform policy making, especially in countries where severe food insecurity and hunger are no longer the most serious concern. 2As an example, consider that last source of food consumption data at the national level available to FAO for India dates back to 2011/12, when the 68th round of the National Sample Survey was conducted.
Undernourishment has been operationally defined as the condition when the dietary energy contained in the food that is regularly consumed is not sufficient to cover the energy requirements for active and healthy life…
The problem remains that collecting good food consumption data through surveys is difficult and costly. Although attempts have been made to simplify food data collection, for example by relying on food frequency questionnaires, and to define simple indicators of the adequacy of food consumption such as the Food Consumption Score (Wiesmann et al. 2009), which are relatively quick and inexpensive, their validity remains dubious (for a discussion, see Cafiero et al. 2014) and their application limited to emergency assessments in the context of informing humanitarian response.
The alternative: food insecurity as lived experiences
Because of the unresolved difficulties in monitoring individual and household food insecurity through the analyses of food consumption data, viable alternatives have been sought. The most successful thus far is based on the analysis of data on reported food insecurity experiences, which has its roots in the works conducted in the early 1990s at Cornell University (Radimer et al. 1990, 1992; see also Kendall et al. 1995) and in the context of the Community Childhood Hunger Identification project (Wehler et al. 1992), and which was perfected in the development of a proper, quantitative measurement scale thanks to the research conducted by sociologists at the Economic Research Service of the US Department of Agriculture (Hamilton et al. 1997; Nord et al. 1999).
In essence, this food security measurement approach conceptualises the severity of the food insecurity condition of an individual or a household as a measurable latent trait, and uses the Rasch model (Rasch 1960) to convert qualitative responses (“yes”/”no”), given by individuals reached in a survey to questions regarding the occurrence of conditions and experiences that are typically associated with food insecurity, into a quantitative interval measurement scale. Since 1995, and up to 2012, experience-based food security measurement has been successfully applied in many countries and in different contexts, usually simply by adapting to the local language, a version of the scale developed by USDA.
Over the years, two attempts were made at developing harmonised versions of a scale that could be used in different countries, with the objective to provide internationally comparable classifications: the Household Food Insecurity Access Scale (HFIAS) and the Latin American and Caribbean Food Security Scale (Escala Latino-americana y Caribena de Seguridad Alimentaria - ELCSA). However, when classifications obtained in different countries were compared, questions were raised on their equivalence (Coates et al. 2006; Jensen 2003). To be true, the doubts on the comparability of the classifications obtained in countries that differed by language, culture and context were founded. In fact, to facilitate the practical application of the scales in new contexts, user manuals of both HFIAS and ELCSA presented simplified protocols for analysing and scoring the data, so that each question was given a certain score, and the summed score used for classification. Little attention, if any, was paid to the need to conduct a preliminary validation of the items used in the specific context, before assuming that all of them could be used to contribute to the overall score, and to the fact that, before comparing them, measures obtained in different application needed to be calibrated against a common reference scale.
3. The innovations brought about by the Food Insecurity Experience Scale
As long as primitive counts and raw scores are routinely mistaken for measures by our colleagues in Social, Educational and Health research, there is no hope of their professional activities ever developing into a reliable or useful science. We owe it to them, and to ourselves, to teach them how to construct measures which work as well as the ubiquitous physical measures by which they manage their everyday living, so that they can do a better job in making sense out of the profusions of data which they collect so enthusiastically. It is our job to teach them how to use the measurement models of stochastic conjoint additivity to transform their inevitably raw and concrete ordinal observations into clearly specified, arithmetically useful, reproducible linear measures. (Wright 1999)
Through the “Voices of the Hungry” project, researchers at the Statistics Division of FAO finally developed the methods and tools needed to produce globally comparable, valid experience-based food security measures (Cafiero et al. 2016) and introduced the Food Insecurity Experience Scale (FIES) which was later endorsed as the basis to compute SDG indicator 2.1.2.
When compared to existing similar experience-based food security measurement scale, the innovations presented with the FIES are twofold. First, it has been clarified that one cannot “economise” on the analytics required to make sure that the scoring of the data collected leads to proper measures. As Benjamin Wright (a pioneer in the application of the Rasch measurement model) had warned his colleagues in the social, educational and health sciences, we made it explicit that the unqualified use of the raw score was the reason why, for example, HFIAS-based classifications did not pass the scrutiny of cross-culture comparability.
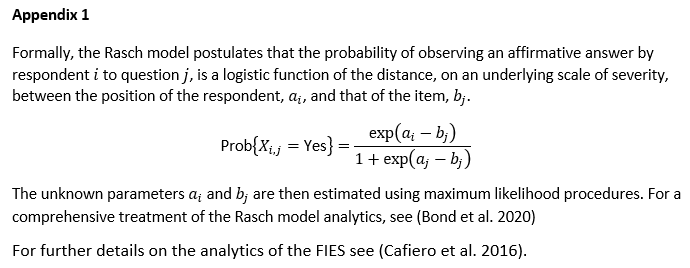
Rasch measurement theory prescribes that validity and reliability of the measures obtained from the data collected with a survey instrument must be formally established. The FIES data must be analysed using the Rasch model. 3The Rasch model is much more than just a way to establish a formal link between the unobservable latent trait and the observable data (in the form of responses to a discrete set of items) and to suggest one way to estimate the unknown parameters. It is the only formulation for dichotomic data that ensures invariance of the measures, a fundamental requirement for comparability. (Engelhard, Jr. 2012; Engelhard, Jr. and Wang 2021). In this framework, in a given sample covered in a FIES survey, each question (or item) is associated with a specific level of severity of food insecurity on an underlying scale. At the same time, each respondent covered in the survey is also at a specific level of severity of food insecurity on the same underlying scale. The probability that a respondent answers a question in the affirmative depends on the distance between the severity of the food insecurity faced by the respondent and the severity of food insecurity associated with the question. The Rasch model postulates this probability to follow a logistic function (see Appendix 1).
It is important to note that an affirmative answer to a question does not definitively establish the severity of food insecurity a person faces. An affirmative response is a stochastic outcome conditioned by various non-measurable factors apart from the severity of food insecurity a person faces in relation to the severity of food insecurity a question is associated with. The key parameters—measuring the severity of food insecurity associated with each question and the severity of food insecurity of each respondent—can be estimated using the maximum likelihood procedures, and whether the model is a good fit can be assessed by comparing the actual responses to the probability of obtaining them, given the estimated parameters. If the model is found to be a good fit, the estimated measure of the severity of the food security condition for each respondent can be used to classify them into classes of food insecurity. Of main interest are the parameters that measure the severity of the food security condition for each respondent, which can then be used to classify them into classes of food insecurity.
It is important to note that an affirmative answer to a question does not definitively establish the severity of food insecurity a person faces.
A second problem that the Voices of the Hungry project tackled was that in comparing them across applications, the metrics in which the FIES measures are obtained must be equated to ensure use of the same threshold when defining the severity classes. This is a quite subtle technical issue that has eluded the attention of analysts who performed comparisons assuming them as legitimate only because the same scale was applied, and the same raw score used to classify. The problem derives from the fact that the Rasch model is defined in terms of the distance between the positions of the respondents and of the items on the severity scale, implying that the actual unit in which the parameters are denominated is irrelevant. One could, for example, add a constant to the estimated severity parameters and their distance would remain unchanged. Technically, this means that the Rasch model is under-identified and that a restriction must be imposed on the 8 item severity parameters to estimate them. This may appear as problematic only if one forgets that we are dealing here with an unobservable latent trait, and that therefore no absolute zero is needed or even assumed to exist to define a valid measurement scale.
In other words, the severity measures generated by applications of the Rasch model are defined on interval, not ratio scales, and each empirical application, in a sense, produces its own. To complete the development of the measurement system, it was necessary to establish a reference scale and to devise the methods to calibrate against it the figures obtained in any specific field application. The process followed to establish the global FIES reference scale is described in detail in (Cafiero et al. 2016) and in (Cafiero et al. 2018) and there is no need to repeat the details here. It will suffice to say that, to do it, was very important to have FIES data collected in 146 different countries with very similar data collection tools, something we achieved for the first time in 2014 thanks to generous support from the Governments of the Kingdom of Belgium and of the United Kingdom, who sponsored our FIES data collection through the Gallup World Poll.
Once obtained, the data, to describe the nature of the comparability problem we faced and to understand the solution we proposed, we could say that we were in a situation like the one faced by scientists dealing with the concept of temperature, devising various tools capable of detecting changes in temperature, but free to quite arbitrarily define the scale in which such values could be denominated. Even today, before comparing temperature readings obtained on different thermometers in different places, users are warned to make sure the figures are reported in the same reference scale. 20°C correspond to a much lower temperature than 40°F, and just comparing the numbers can be greatly misleading. 4See (Chang 2008) for an interesting discussion of the history of temperature definition and measurement. As a thermometer could be calibrated on any arbitrarily defined scale by choosing two points along the scale as reference and deciding on how many units to interpose amongst them, transforming measures from one scale to another only requires that one knows the values of the temperature on the two scales, at the two reference points taken as “anchoring” points. For the FIES, the problem was only slightly more complex, as we needed to determine the reference scale first and then deciding on the appropriate anchoring points, without being able to make reference to objective conditions.
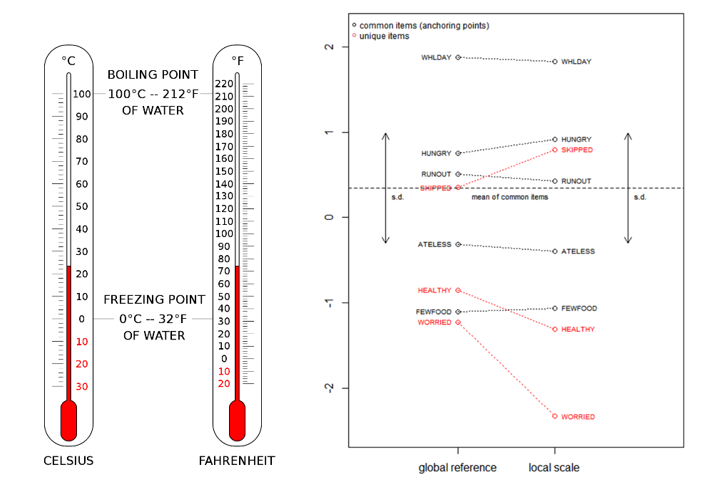
The solution was to establish the global reference scale as the location of the median value of the severities of the eight FIES items across the 146 different data sets, and then perform the calibration of each national scale against the reference one, based on equating the mean and the standard deviation of the severities of items that appeared to be located in the same relative position, which were then used as “anchoring” points. 5We took inspiration from similar problems faced when Item Response Theory based measurement scales are defined in the context of educational testing, and analysts must ensure equivalence of scales formed by different sets of items. See for example (von Davier 2011) This has the advantage that the FIES system of measurement accommodates the possibility that not all 8 items must have a perfect correspondence to each other in all the countries in the world, while ensuring formal equivalence of the severity measures.
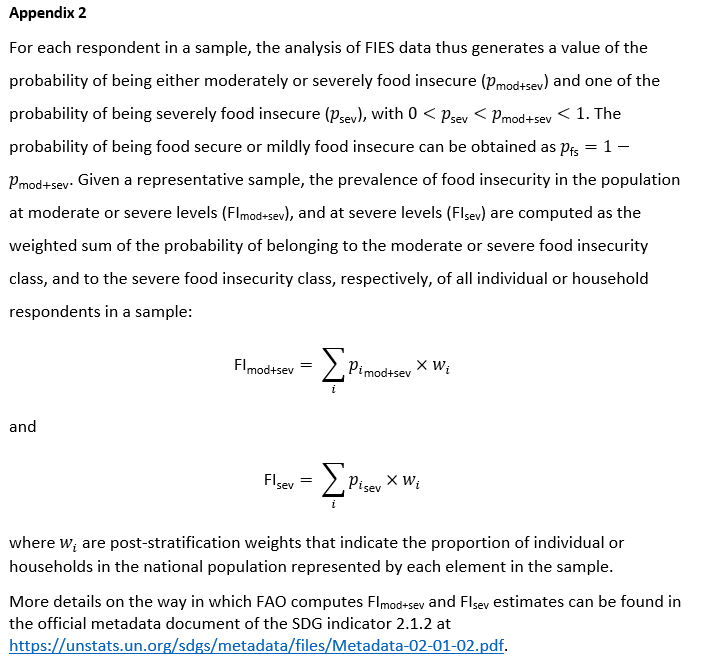
Once a global reference scale was created, and the methods devised to calibrate any set of FIES measures against it, conventional thresholds could be established on the reference scale to define specific classes of food insecurity severity. All this could eventually form the basis for a truly global, valid food security measurement system. For SDG monitoring purposes, we defined three separate classes of (a) food security or mild food insecurity; (b) moderate food insecurity, and (c) severe food insecurity and estimated the extent of food insecurity in each class and the total population.
The relevance of SDG Indicator 2.1.2 (Prevalence of Moderate or Severe Food Insecurity based on the Food Insecurity Experience Scale) in the context of the ambitious 2030 Agenda for Sustainable Development should not be underestimated, as moderate food insecurity is an important driver of various forms of malnutrition. In this respect, experience-based food security measures can prove a very useful tool to guide policies (Pérez-Escamilla 2012; Pérez-Escamilla et al. 2017).
4. Conclusions: the way forward
Since its introduction in 2015, the FIES has been extensively validated for use all over the world and in very different contexts (Frongillo 2022) and is gaining large popularity, relatively quickly, in many countries and contexts, including for example to monitor the evolution of food insecurity during the COVID-19 pandemic, as data collection is relatively simple and inexpensive, and, if necessary, could be done via telephone surveys.
A general conclusion that can be drawn from the discussion in this article is that measuring food insecurity with the FIES presents several advantages with respect to analyses of household food consumption data. Data collection is much less expensive in terms of survey time and – when appropriately processed through the lenses of the Rasch measurement model – the information provided is extremely reliable and granular, and therefore extremely useful in identifying population groups which are more exposed to food insecurity and targeting intervention.
[M]easuring food insecurity with the FIES presents several advantages with respect to analyses of household food consumption data.
Currently, the main limitation to even broader use of the FIES and other experience-based food security measures, beyond the objective of monitoring progress towards the SDG targets resides in a still relatively limited capacity to properly conduct the needed data analysis. Despite growing expansion of applications of in many areas of human behavioural and social research during the past few decades, the theory and practice of the Rasch model does not seem to have permeated yet into food security analysis curricula. Investing in capacity development and training in this area of research should prove a very effective means to improve food security and nutrition policy making worldwide.
Carlo Cafiero is a senior statistician and economist at the Food and Agriculture Organization of the United Nations (FAO) in Rome, Italy. He leads the team in charge of producing food security and nutrition statistics at global, regional and country levels; is the focal point for the indicators used to monitor SDG Target 2.1.; and represents FAO in the Technical Advisory Group of the Integrated Food Security Phase Classification (IPC).