

The current high levels of unemployment should not be seen purely as a result of the pandemic, but as arising from a massive pandemic-induced shock to an economy that was already struggling with high rates of unemployment. There is growing recognition of the scale of the problem, with a report commissioned by the Economic Advisory Council to the Prime Minister advocating an urban employment guarantee scheme (also advocated by researchers at the Centre for Sustainable Employment, Azim Premji University, Bangalore).
Data from the Centre for Monitoring Indian Economy (CMIE), reveals an unemployment rate of 7.83%, a worrying statistic for a developing economy that has yet to develop a robust social security net. Though there are debates on the representativeness of the CMIE surveys, the existence of high unemployment in the Indian economy cannot be denied.
While the pandemic caused severe stress to the labour market, unemployment rates were high even before the lockdown of March 2020. The release of the Periodic Labour Force Survey (PLFS) of 2017-18 was accompanied by significant controversy because it recorded an unemployment rate of 6.1%, the highest ever seen since the beginning of the Employment and Unemployment Surveys (EUS) of the National Sample Survey Office (NSSO). While unemployment rates fell a little (to 5.8% in 2018-19 from 6.1% in 2017-18), the lockdown pushed them up again and its effects are still being experienced today.
The factors driving unemployment in India are not well understood and require attention from academics and policymakers alike. Recent changes in the design of the PLFS enable us to study the dynamics of Indian labour markets in a deeper way than before. Simply put, the PLFS interviews individuals once every quarter, enabling us to build up a panel of individuals who have been interviewed four times over a given survey year, recording their changing employment statuses during this time. Previous rounds of the EUS surveyed individuals only once; the methodological innovation of the PLFS now enables us to study individuals as they move through the labour market. This has been done only for the urban sector in the PLFS, and hence our study is confined to urban labour markets.
Higher education levels do not translate into better labour market outcomes.
By constructing panels for the years 2017-18 and 2018-19, we attempt to understand the dynamics behind unemployment in India before the pandemic, exposing some deep-seated structural issues that bedevil urban labour markets. Anticipating our results, we find a significant problem of long-term unemployment—more than half of those unemployed in the first quarter of the survey year continue to remain unemployed by the fourth. A large number of unemployed individuals exit the labour force instead of continuing to search for employment, a phenomenon seen more significantly among women. Higher education levels do not translate into better labour market outcomes, with the burden of long-term unemployment falling disproportionately upon graduates.
Data and definitions
We define the unemployed as those who are willing and available to engage in economically productive work and are actively seeking employment. There are two main measures of unemployment adopted in the PLFS: the Usual Status, which looks at the labour force status of an individual over the previous year, and the Current Weekly Status (CWS), which classifies individuals according to a shorter reference period of a week. These definitions correspond to two very different ways of characterising work and employment in a developing economy, and would return two very different estimates of unemployment. Here we adopt the CWS because that affords us a better understanding of individuals’ changing labour force status than the Usual Status. 1We include those classified with status 81 and 82 of the CWS as unemployed for this study.
The PLFS of 2017-18 covers the period from July of 2017 to June 2018, being divided into four quarters. Quarter 1 of 2017-18 covers the months July 2017 to September 2017, Quarter 2 October 2017 to December 2017, Quarter 3 January 2018 to March 2018, and Quarter 4 April 2018 to June 2018 (the same applies to the PLFS of 2018-19). All urban individuals in the sample are interviewed once every quarter, and their CWS recorded according to the activity in which they spent the maximum amount of time over the previous week. We classify individuals in three ways— employed (E), unemployed (U) and those who do not have a job and do not wish to work, or preferring to remain out of the labour force (O). The latter category includes students, women in domestic work, and so on. We do not distinguish between different forms of employment—whether they are self-employed, casual labourers, or in regular wage work—to keep the exposition simple. We do not include the PLFS of 2019-20, which covers the lockdown period, so that we can focus on pre-Covid-19 trends.
We study the change in individuals’ status between the first and fourth quarter as an approximation of labour market dynamics over a given year. Our sample is therefore built up of individuals surveyed in Quarter 1 of 2017-18 and 2018-19, who are then compared with their status in the fourth quarter of 2017-18 and 2018-19, respectively. 2See Menon and Nath (2020) for a detailed account of how panels can be constructed from PLFS data. Our results are only applicable to the specific period covering the years 2017 to 2019. We cannot speak of the situation of the labour market in previous years because such data was not collected in previous surveys. Our sample consists of 31,800 observations in each sample year.
One problem is that individuals’ labour status in each quarter is classified according to their activities in the week before when they were interviewed. This can pose a problem in rural areas where the nature of work is largely cyclical; higher rates of unemployment would be recorded in the weeks coinciding with the slack season. The timing of interviews may not be much of a problem in urban areas, where we assume a more regular, uniform nature of work. However, another problem arises. Individuals surveyed in the first quarter may have been unemployed in the previous week and their status recorded as such. But they might have engaged in different activities over the duration of the three months that make up the first quarter. The specificities of data construction in the PLFS do not allow for such granular distinctions to be made.
The dynamics of unemployment
Consider those unemployed in the first quarter of each survey year. By the fourth quarter, they may be employed, may leave the labour force, or may remain unemployed. We thus have three distinct forms of labour market flows or transitions—from unemployment to employment, which we characterise as the U-E flow; from unemployment to out of the labour force (U-O); and those who remain unemployed (U-U). We measure each flow by estimating the proportion of those individuals unemployed in the first quarter who make each transition by the fourth quarter. The results are shown in Table 1.
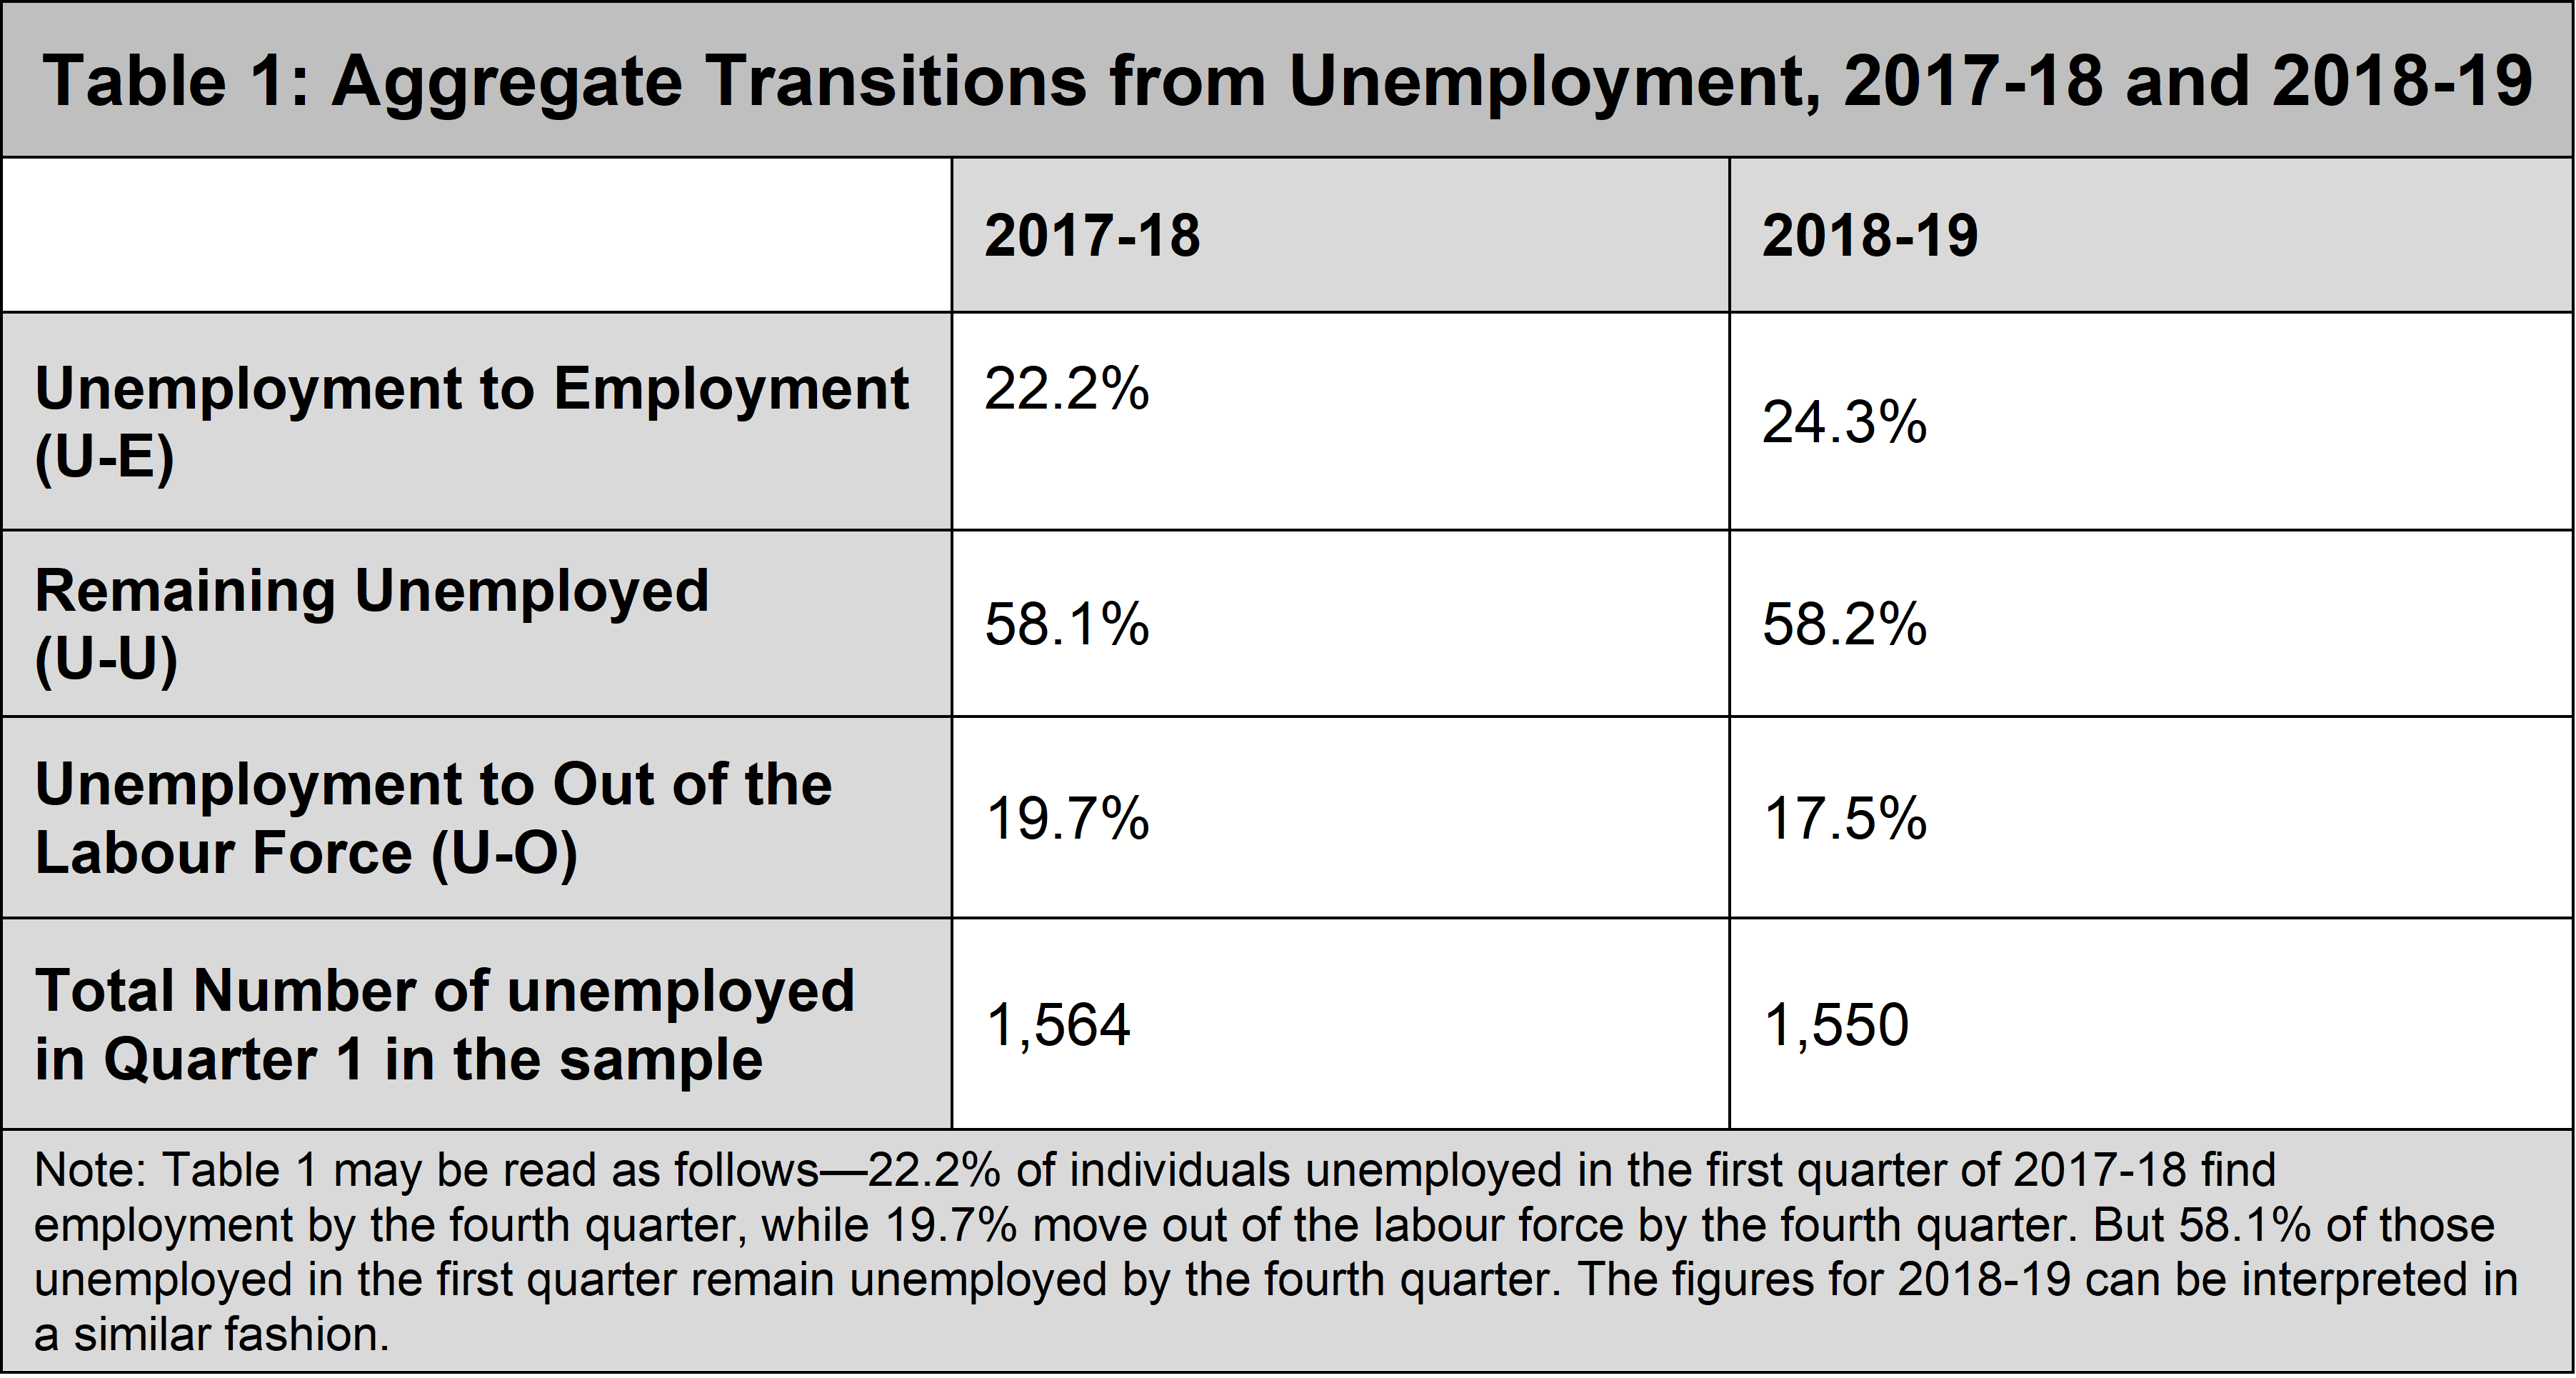
Unemployment in urban India is much higher than in rural areas. The urban unemployment rate by usual status for those aged 15 to 65 was roughly 7.87% in 2017-18 and 7.7% in 2018-19. Not only is the rate of unemployment high, urban labour markets also experience significant rates of long-term unemployment. As shown in Table 1, in both survey years, 58% of those unemployed in the first quarter remained so by the fourth quarter, indicating a high proportion of individuals unemployed through the year.
An economy with a high rate of employment generation – with high rates of new jobs being created - would imply it is a dynamic economy, where a person who is unemployed might be able to find employment relatively soon. As can be seen from Table 1, this does not characterise Indian urban labour markets. In 2017-18, only 22.2% of the unemployed individuals managed to find some form of employment by the fourth quarter (the U-E transition); the figure rose only marginally to 24.3% in 2018-19. The rate of exit from unemployment is fairly high as well. Nearly 20% of unemployed individuals left the labour force by the fourth quarter in 2017-18 (18% in 2018-19), possibly due to the inability of finding suitable forms of employment.
Nearly 20% of unemployed individuals left the labour force by the fourth quarter in 2017-18 (18% in 2018-19), possibly due to their inability to find suitable jobs.
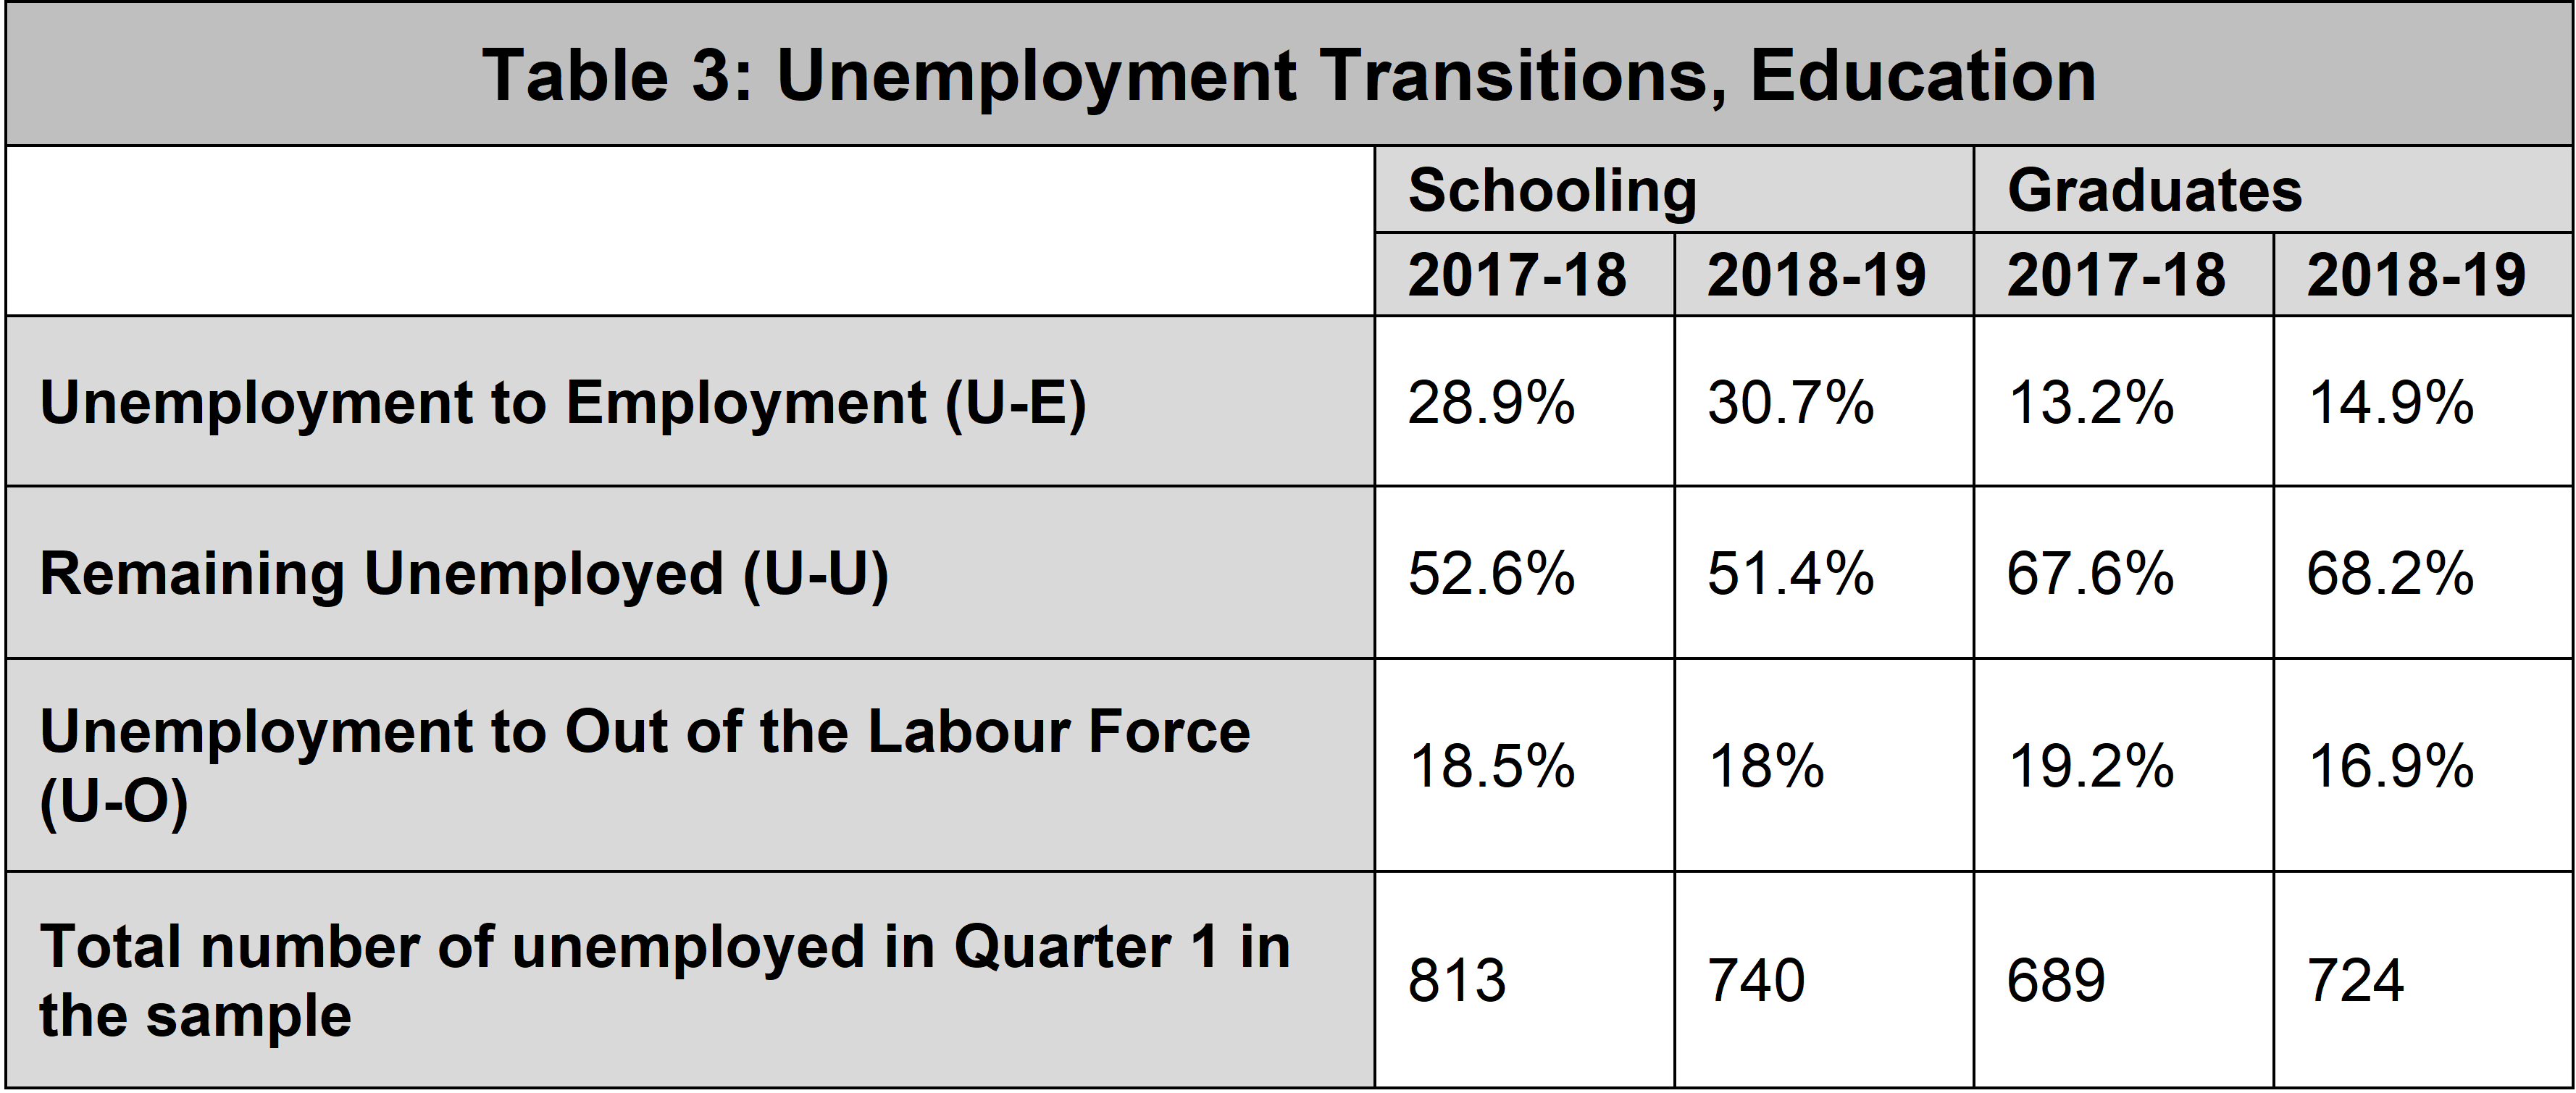
We disaggregate these estimates of unemployment transitions across two important demographic categories—gender and education. Table 2 displays unemployment transitions for men and women separately in both years, while Table 3 disaggregates these transitions by education. Individuals are divided into two categories based on their educational achievements—those who have received some amount of schooling, and those who have graduated from college (who include those with postgraduate levels of education). We do not include those without schooling because there are very few of these individuals among the unemployed.
Consider gender. Long-term unemployment affects both men and women, though its magnitude varies. Nearly 60% of unemployed men remain so for more than a year, compared to roughly 54% to 55% of women. However, rates of employment generation vary significantly. Roughly 28% to 29% of unemployed men were able to find some form of employment, while only 8% of women in 2017-18 and 13% in 2018-19 were able to do so. Rates of employment generation, which are already low for the overall economy, are worryingly skewed against women.
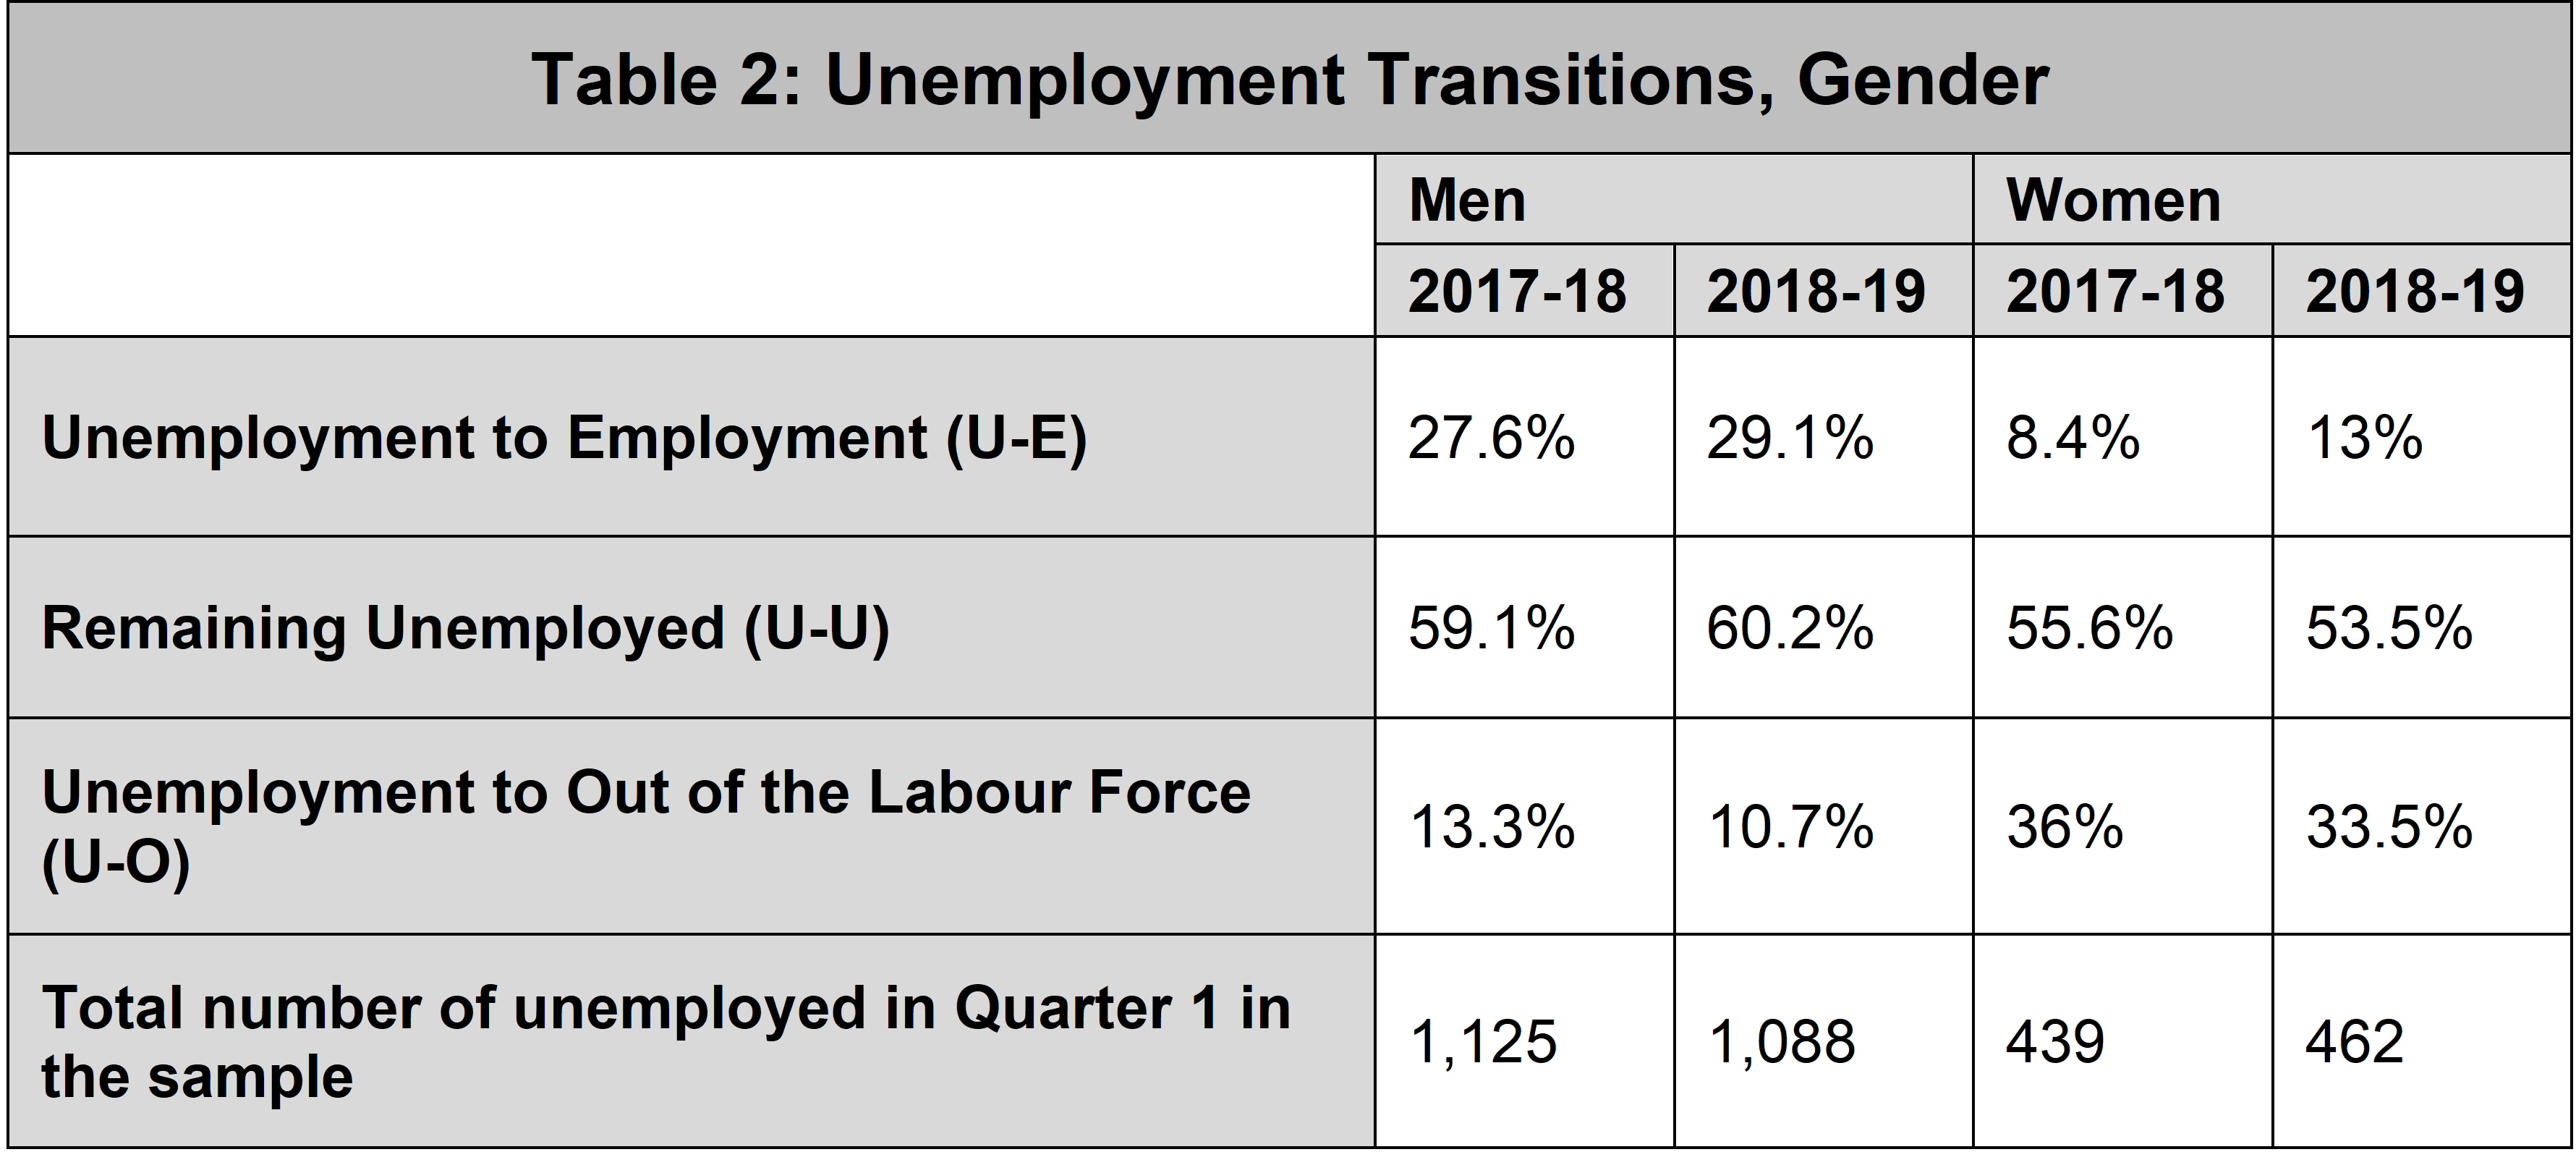
In spite of such low rates of employment generation, the rates of long-term unemployment are lower for women compared to men because of differences in the rates of the U-O transition. This transition captures those individuals who, despite not having found employment, cease the process of searching for a job and exit the labour force. A staggering 36% of unemployed women in 2017-18 (33.5% in 2018-19) exited the labour force by the fourth quarter, compared to 13.3% (10.7% in 2018-19) of men. This opens up new questions on the phenomenon of falling rates of women’s labour force participation. Not only do women refrain from entering the labour force, they seem to exit in high numbers even when they decide to search for employment.
Contrary to the general perception that greater skills translate into better labour market outcomes, we see an inverse relationship between the level of educational achievement and the probability of securing employment. In both years, rates of employment generation—the U-E transition—fall as the level of education increase, being higher for those with schooling compared to graduates. In 2018-19, for instance, while 30.7% of all those unemployed with schooling were able to secure employment, only 15% of graduates managed to do so. In contrast to what one would expect, the possession of a graduate degree increases the probability of long-term unemployment, with 68% of graduates remaining unemployed in the first and fourth quarters, compared to half of those with schooling.
Job creation and job loss
An analysis of patterns of job creation and job loss bring out the sectors that show the most dynamism in the Indian labour market. While job creation is defined as moving from unemployment in the first quarter to employment in the fourth, job loss is characterised by the movement from employment to unemployment. Table 4 indicates the share of jobs created and lost by industries in urban India.
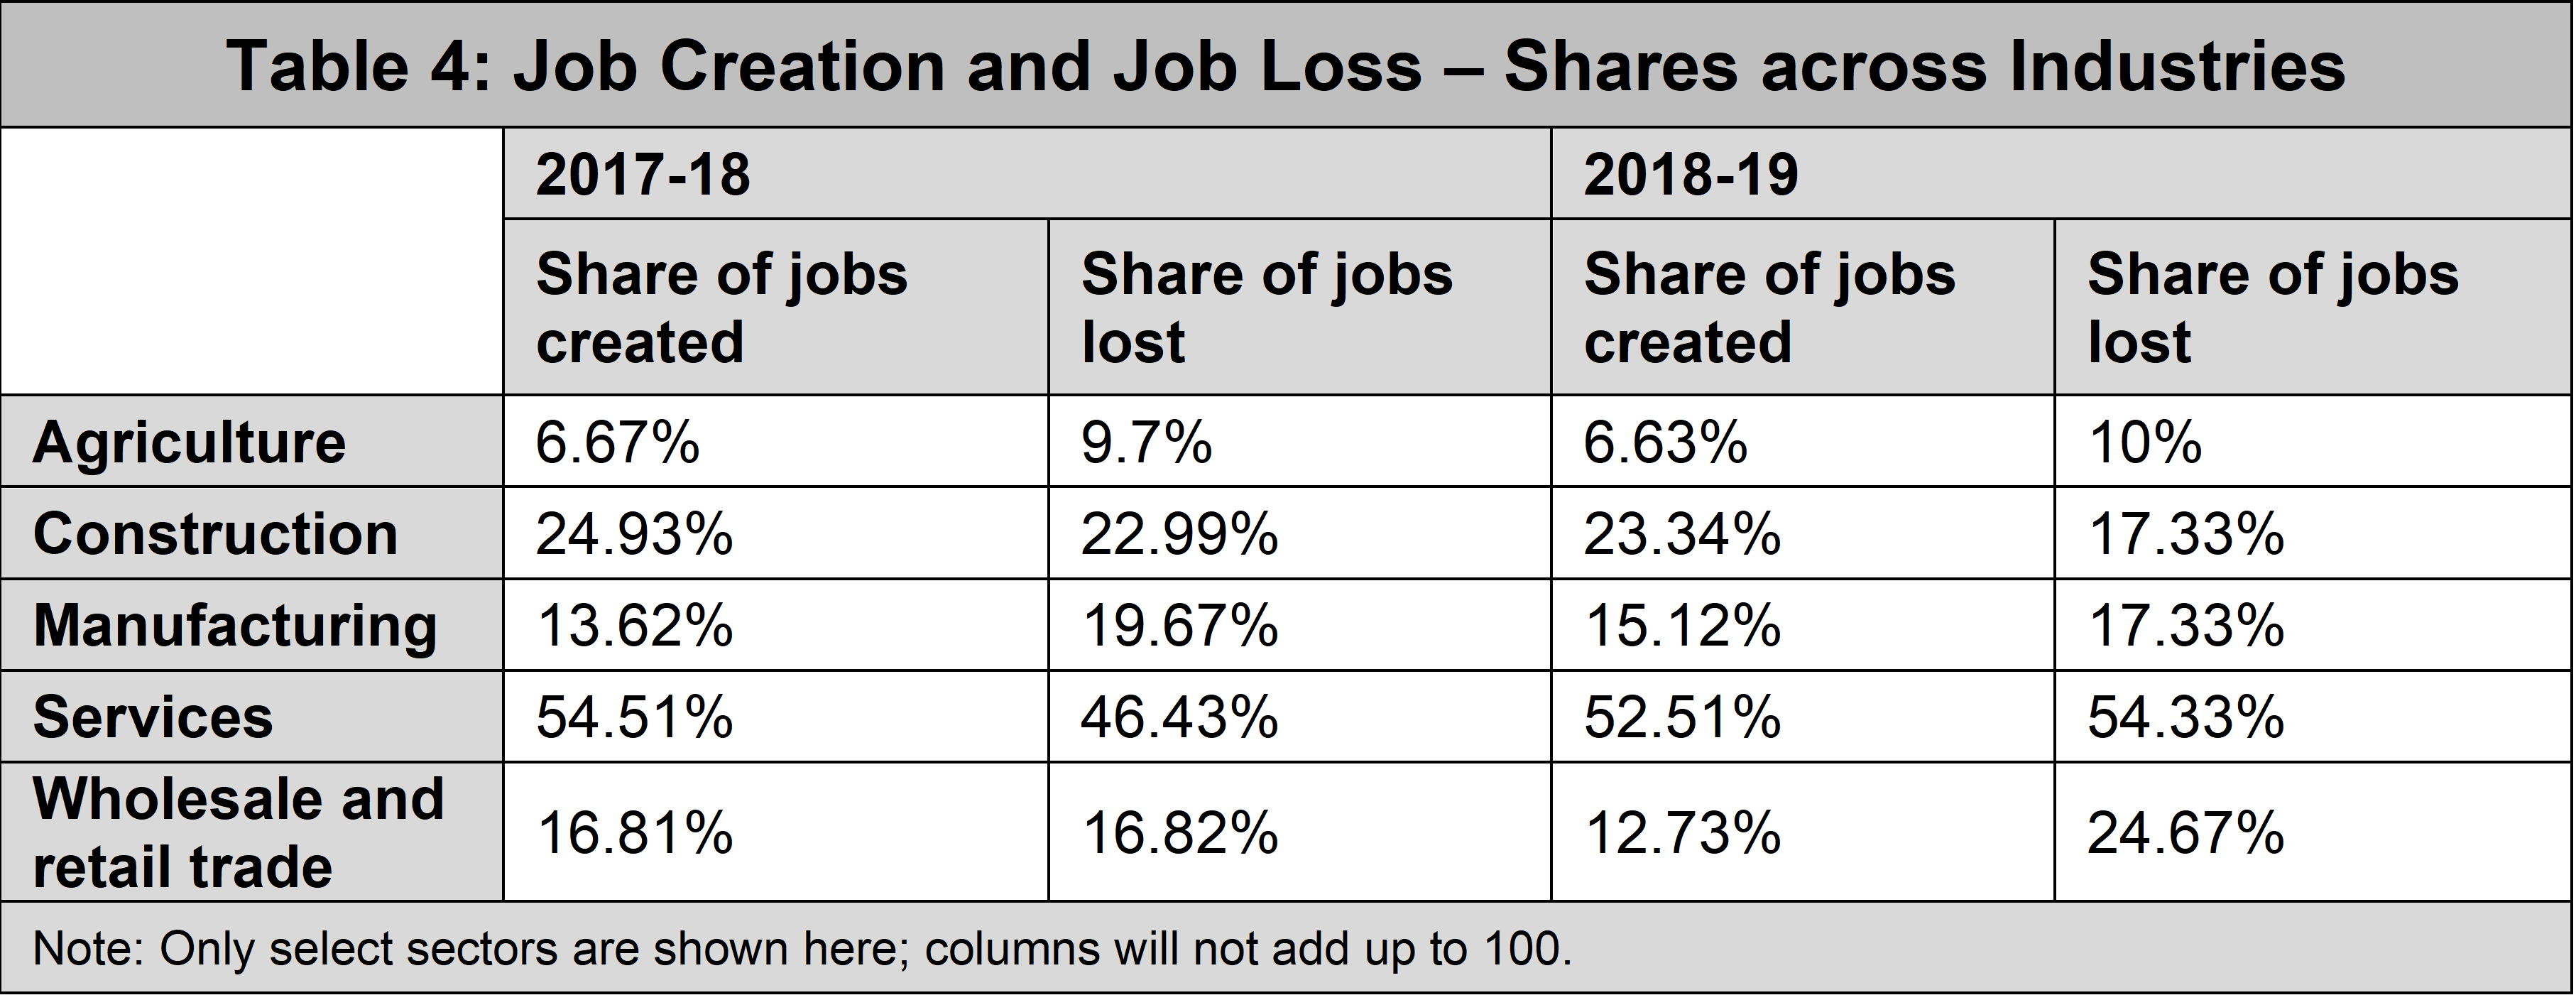
As is to be expected, the services sector accounts for half of all jobs created and lost in both survey years, though its contribution to job loss increased in 2018-19 compared to the previous year. The dynamics of this sector, however, largely came from wholesale and retail trade, which contributed to a quarter of all jobs lost in 2018-19 and 17% of all jobs created in 2017-18 (13% in 2018-19). Construction and manufacturing together accounted for about 43% of lost jobs in 2017-18 and 35% in 2018-19. Agriculture surprisingly accounts for 6.7% of new jobs created, possibly reflecting subsistence operations undertaken as a fallback option in a moribund labour market.
[E]ven if demand were to revive, patterns of inequalities in unemployment would still exist, with women and skilled workers facing difficulties.
What is of concern in an environment of low employment generation is the sectoral distribution of jobs. The construction sector accounts for almost a quarter of the new jobs created across both years. Given that this is a sector characterised by insecure working conditions, low pay, and no protection, it does not bode well for the economy that the majority of jobs being generated is in a sector known for unsafe working conditions. The manufacturing sector accounts for only 14% to 15% of new jobs across both years. Within services, it is not highly productive services that account for the bulk of new jobs, but low-productive sectors such as wholesale and retail trade. While much more work remains to be done in analysing these trends, the overall picture of job creation is a sobering one. It points to a labour market with a relative inability to ensure highly productive jobs for job-seekers.
Conclusions
Some caveats are in order. This preliminary analysis points to certain important features, but it cannot point to the factors driving these trends. For instance, in the case of the U-O transitions for women, is it because frustrated women cease searching for jobs when they do not find a suitable match? Or do societal and familiar pressures prevent them from staying long enough to find one? Do low rates of employment generation for graduates reflect deficiencies in the educational system or in the ability of the economy to generate enough jobs for highly-skilled workers?
What this short analysis does is point to structural questions relating to the labour market that requires urgent attention. It is clear that in our current situation of mass unemployment, an expansion of aggregate demand is sorely needed. However, even if aggregate demand were to revive, patterns of inequalities in unemployment would still exist, with women and highly-skilled workers facing difficulties. Policy must work not only to improve employment generation—already low before the pandemic—but also to tackle the structural problems that we have highlighted.
Rahul Menon is an independent researcher; Paaritosh Nath is with Azim Premji University, Bangalore.