Before the dark clouds of the Omicron variant of Covid-19 began to gather in November 2021, there were headlines such as “Asia’s third-largest economy has been seeing a rebound from last year’s deep slump” and “Morgan Stanley says Indian economy to witness strong recovery post-Covid”. The expectation was that a pick-up in investment, along with underlying structural reforms, would lead to a virtuous cycle of “high productive growth”. The International Monetary Fund (IMF) projected India’s Gross Domestic Product (GDP) growth rate in 2021–22 at 9.5% and 8.5% in 2022–23.
A year of slow growth followed by deep slumps over a couple of quarters owing to a stringent lockdown can throw up insanely high numbers for subsequent quarterly growth. An assessment of recovery based only on such growth rates could give a false picture, as the levels of activity could still be well below pre-pandemic levels.
We must look beyond the growth rate to get over this problem. A critical assessment of the size of GDP, quarterly growth rates, sector-wise performance, growth in bank credit, and tax collection, can help us assess the shape of the current recovery in India.
Growth of gross value-added
India’s GDP at constant prices was Rs 140 lakh crore in 2018-19, which rose by about 4% to Rs 146 lakh crore in 2019-20. This was slower than the 8% growth in 2016-17. Then came the stringent lockdowns. GDP slumped to Rs 135 lakh crore in 2020-21 which was lower than that in 2018-19.
As the bulk of this fall had taken place in the first quarter (April-June) of 2020-21, the annual numbers do not tell us whether we had been on a path of recovery in 2021-22, or what kind of path it would have been. The path charted by the Gross Value Added (GVA) in each quarter will give us a better idea.
A K-shaped recovery branches into two different directions. Large companies and public sector enterprises recover rapidly while small and medium-sized companies, along with blue-collar workers, are left out of the recovery process.
The national lockdown during April-June 2020 saw GVA falling by 22.4% in that quarter compared with the previous year. The fall moderated to 7.3% in the second quarter (July-September). By the third quarter of 2020-21, the economy had surpassed the level of GVA in the corresponding quarter of 2019-20. In the fourth quarter, it was slightly higher than that in the same quarter of 2019-20.
The second wave, however, undid some of these gains. The growth rates of 18.8% and 8.5% in the first and second quarters, respectively, of 2021-22, the current financial year, look robust. But in absolute terms the GVA in the first quarter of 2020-21 was lower than that in the first quarter of 2019-20: Rs 30.48 lakh crore vs Rs 33.05 lakh core. In the second quarter of the current fiscal year, the GVA, at Rs 32.89 lakh crore, was only marginally higher than that in the corresponding quarter two years ago.
Thus, by the second quarter of 2020-21, we had bounced back, if one may call it so, to the level attained two years ago.
Which sectors gained?
Agricultural growth continued to be robust in 2020-21. The first two quarters (April-September), for which we have data, reported around 8% growth over the corresponding quarters of 2019-20.
The three sectors of (i) Mining and Quarrying, (ii) Electricity, Gas and Water Supply and Utilities, and (iii) Public Administration, Defence, and Other Services have also shown good growth. But these three sectors together account for less than 20% of GVA. Along with agriculture, they account for only one-third of the total.
Among the larger sectors, while the level of activity in manufacturing in the first quarter of 2021-22 was 4% lower than that two years ago, by the second quarter it surpassed the level in the first quarter of 2019-20 by a small margin. Construction just about reached the level two years ago. The value of output in the remaining two sectors, which account for more than 43% of GVA —Trade, Hotels, etc.; and Financial, Real Estate, etc. — remains lower in the second quarter of 2021-22 than that two years ago.
Thus, the picture of economic recovery is one where agriculture and the largely formal sectors of mining and quarrying, electricity and gas, and public administration have shown signs of recovery. The activity in the largely informal sectors of trade, hotels, and real estate is still significantly below 2019-20 levels. The signal coming through these patterns is that the formal sector is showing signs of recovery — but not the informal sector.
Trends in bank deposit and credit
Credit flow in a modern economy should show an increase as the level of economic activity rises. More frequent disaggregated information, as provided by the bank deposit and credit data from the Reserve Bank of India, gives a better idea of the slide and subsequent recovery in economic activity in different parts of the country.
Deposit trends
At the all-India level, deposit growth did not fall in any quarter of 2020-21. The national lockdown during the first wave of Covid-19 and the recovery afterwards both brought in more deposits to the banking sector. The second wave during 2021-22 resulted in a slightly slower expansion, but growth rates were around 10%.
Financial savings of households in the form of bank deposits kept growing despite the national lockdown in early 2020-21 and numerous lockdowns in almost every state thereafter. In the first half of 2021-22, a small deceleration in the bank deposit growth rate was witnessed but some states escaped that slowdown.
While there are signs of recovery in some parts, the credit growth rates are still way below those prevailing prior to 2019-20.
A distressing dimension of this growth of deposits is that poorer and largely agricultural states like Odisha, Bihar, and Assam showed a slowdown in the growth rate in bank deposits, with the situation deteriorating towards the close of 2020-21 and the beginning of 2021-22. In contrast, richer and more industrialised states (Maharashtra, Gujarat, and Punjab) showed hardly any reduction in deposit growth.
Credit trends
The growth of bank credit began to decline from early 2019-20. There was a large fall in credit growth after the national lock-down in the first quarter of 2020-21, to 6.4% from 11.7% a year before. This fall continued until the first quarter of the current fiscal. Only in the second quarter has there been some sign of revival, but credit growth is still below 7%.
Like in deposit growth, credit growth too shows considerable variation across the states. Several states show a decline in credit growth from the first quarter of 2019-20 whereas others show a deceleration only from the second and third quarters: Maharashtra, Odisha and Kerala fall in this category.
Credit growth is not taking place in the south, west, or in the Punjab-Haryana belt — the major centres of industrial and service sector activity. While there are signs of recovery in some parts, the credit growth rates are still way below those prevailing prior to 2019-20.
The so-called V-shaped recovery people have been talking about, if true, should have got reflected in much higher credit growth. This is not to be found anywhere except the North East.
Tax receipts
Revenue receipts of the central government recorded robust growth in the first half of 2021-22 (April-September) on the back of buoyant tax receipts. The revenue receipts are comparable to those of 2019-20. In the first half of the current fiscal, the centre’s direct tax collection – income and corporation taxes – increased by 28.7% and 23.8%, respectively, over 2019-20. Goods and Services Tax (GST) collections (centre plus states) increased in the first half of 2020-21 by 12.5% over 2019-20. The trends in tax receipts of the governments (centre and states) in 2021-22 are thus in agreement with the trends in bank deposits, both growing at healthy rates.
There could be a distributional dimension in the fact that tax receipts in 2019-20 have grown faster than GVA. GVA in the first half of 2021-22 persisted at levels recorded in 2019-20, yet yielded indirect tax growth of over 10% and direct taxes growth of 25%.
This implies greater income accruing to the formal sectors of the economy and has implications for the shape of recovery now taking place.
The shape of recovery
There are various types of recovery. A V-shaped recovery is the best as the economy bounces back immediately after a slump. A U-shaped recovery is one where there is a prolonged stagnation after a slump, the economy then gradually rises to its previous peak. An L-shaped recovery is the worst-case scenario as here the economy fails to regain its peak GDP even after a long period. A W-shaped recovery sees the economy staging a brief come back only to fall a second time.
A K-shaped recovery branches into two different directions. Large companies and public sector enterprises recover rapidly while small and medium-sized companies, along with blue-collar workers, are left out of the recovery process.
Figure 1 presents the data on the absolute size of the GVA (the right-hand side of the Y axis), the GVA growth rates, and the real credit growth rate.
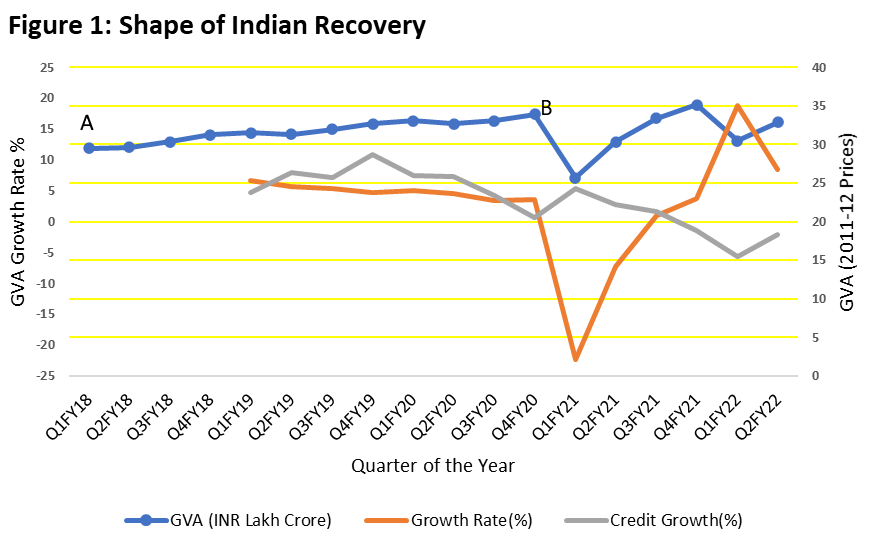
The quarterly GVA growth rates show a robust V-shaped recovery after a prolonged period of growth of below 5% over eight quarters to the end of fiscal year 2019-20, a deep slump for the next two quarters, and growth under 5% for another two quarters. It is only in the first and second quarters of 2021-22 that we have gone above the 5% growth we were stuck with.
The story becomes slightly different if we look at the trends in the absolute size of GVA.
The economy was growing by around Rs 0.36 lakh crore every quarter over the 12 quarters up till the end of 2019-20, before the pandemic and the subsequent slump. The recovery in the third and fourth quarters of 2020-21 restored absolute growth to the pre-pandemic levels. But in the first and second quarters of 2021-22 again pushed us down yet again.
From this perspective, it has been a long stagnation, more of an L-shaped non-recovery after the fall from the over 8% growth in 2016-17. The exuberance about a robust growth recovery in 2021-22 is thus misplaced. Now with Omicron in our midst, future growth could as well be a line parallel to AB in Figure 1, starting from the dip in the first two quarters of 2021-22. India’s economic recovery would take at least another 10 quarters and not happen before 2023-24.
The indications are that the formal sector might have turned around but not the non-formal non-farm sector. Thus, the economic recovery India is now experiencing is probably a K-shaped one.
Our surmise of a slow recovery is supported by the pattern of the real growth of bank credit. As Figure 1 shows, commercial bank credit growth, which was above 10% in the fourth quarter of 2018-19, came down steadily through 2019-20 and reached almost zero by the fourth quarter of 2019-20, even before Covid-19 hit us. The slide continues. A small upturn took place in the second quarter of 2020-21 but the growth rate is still below zero, suggesting that the recovery will be long drawn.
More importantly, it suggests a new dimension to the nature of recovery. Medium- and small-sized enterprises are dependent on bank credit to run their business, unlike larger formal sector companies. The lack of credit pickup in the southern and western parts of the country, which have a high concentration of small enterprises, suggests that these enterprises have not got over the slump and are still struggling. This is borne out by the pickup in GST collections in recent months as well as the bulk of the income tax collections, both of which have come from the top 5% of taxpayers. This comes out in the increase in corporation tax collections as well.
The indications are that the formal sector might have turned around but not the non-formal non-farm sector. Thus, the economic recovery India is now experiencing is probably a K-shaped one.
This argument of a two-directional recovery is supported by the sectoral composition of growth. Among the non – farm activities, only mining and quarrying, electricity and gas, and public administration have reported robust recovery in the first two quarters of 2020-21. These are largely formal or public sector enterprises. Sectors such as construction, trade and hotels, and real estate, where the informal accounts for a large share, are still in the woods.
It looks like demonetisation, GST and Covid-19 have decisively changed the structure of the Indian economy.


