

For someone who was in her teens in the 1960s / 1970s, the first visual of forex was perhaps a scene in a Hindi movie where the villain (often played by Ajit or Pran those days) tries to flee India in a helicopter with a suitcase of dollar bills! Those were the days of the Foreign Exchange Regulation Act (FERA), 1973. While things have changed since then, we do tend to have some stereotypes about the exchange rate. Some may relate it to a country's economic power, or compare it with the age of a political leader or even the size of his chest!
How do we measure the exchange rate? How has it evolved over time? Why cannot we have fixed exchange rates so that our lives become easy? Why does the US dollar enjoy a near-supreme power? Why in India do we have episodes of extreme exchange rate volatility? These questions tend to concern the citizen. In this essay, we attempt to answer some of these questions from first principles -- both in general terms and in terms of Indian specifics.
1. Basics of the Exchange Rate
To begin with, at the risk stating the obvious and appearing to present a cookbook, let us clarify some terms related to exchange rates.
A key issue in expressing the exchange rate is the choice of the reference currency. Typically, one should take the domestic currency as the reference currency and say that the rupee-dollar exchange rate has moved from 1/65 to 1/70. But since the human mind is less accustomed to think in fractions, we say instead that the dollar-rupee exchange rate has moved from 65 to 70. (Since an increase in the exchange rate is called an appreciation while its reduction is called a depreciation, thinking in terms of whole numbers can be confusing. After all, the dollar moving from 60 to 70 a rupee signifies a depreciation of the rupee, not an appreciation.
Where does the exchange rate get determined? If we take the exchange rate as the price of the domestic currency vis-a-vis the foreign currency, then it is obvious that it is determined in a market for foreign exchange. If we look at India via-a-vis the US, then the dollar-rupee exchange rate of 70 is determined by demand for and supply of dollars in the Indian foreign exchange market.
Balance of Payments
What is so special about a foreign currency? Since a currency is essentially identified with a state (or a group of states like in the Euro area), technically while the domestic country (or its central bank) can print any amount of its own currency, it cannot print a single note of foreign currency. Thus, a country has to earn (and spend) a foreign currency through different means. Five such means in broad terms are: (a) exports/import of goods (merchandise); (b) exports/inflows of services (invisibles); (c) inward/outward remittances; (d) inflow/outflow of foreign investment; and (e) borrowing / lending in foreign currency.
All these transactions are not on the same footing. Economists and accountants often distinguish between current and capital transactions. Take an illustration. Suppose Meena spends money on food. Now food is absolutely necessary for the daily life of Meena. This is, thus, classified as under the “current account”. Note that the current account has essentially a short time span -- it can be a day, a week, a month, quarter or a year. Meena can save a part of her salary in a one-year fixed deposit in a bank. The return from that fixed deposit will accrue to Meena over a slightly longer period. This act of savings in deposits is classified under the “capital account”. Thus, depending on the time period of accrual of return from any transaction, it can be classified under the capital or current account.
External transactions of an economy are not exceptions to this general principle of classification. Typically, transactions of buying/selling of any foreign goods and services as well as any transfer (i.e., payment /receipt) like remittances or aid are classified under the current account. On the contrary, any investment or borrowing is classified under the capital account.
Thus, the five major heads of earning/spending of foreign exchange are typically classified as:
- Current Account (represented by CA)
- Export and import of goods
- Export and important of services
- Transfers like official foreign aid or private remittances.
- Capital Account (represented by KA)
- Foreign investment: both direct as well as portfolio
- External borrowing both by government as well as by private entities
- Bank capital involving commercial banks' external borrowing / foreign currency deposits of non-resident Indians in Indian commercial banks
This description of the inflow and outflow of foreign exchange is called the Balance of Payments (BoP) account of a nation. Any difference between the inflows and outflows is placed under “Changes in foreign exchange reserves”. These changes can represent either an increase or decrease in reserves. Table 1 reports the Indian BoP during the financial year 2017-18.
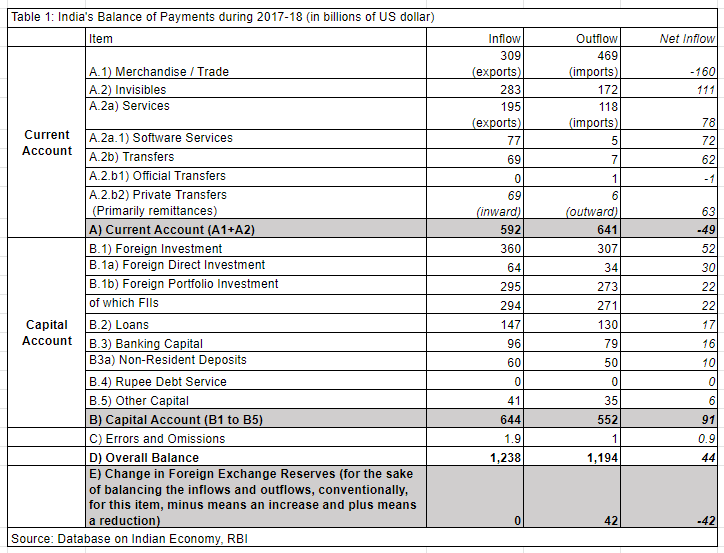
A look at Table 1 confirms a number of interesting facts about the Indian economy during 2017-18:
- India had a deficit of $49 billion in its current account (i.e., comprising goods, services and remittances).
- This deficit was more than neutralised by a surplus of net inflows (i.e., inflows - outflows) in its capital account (comprising primarily foreign investment, and loans and deposits of non-resident Indians) of $91 billion.
- The additional amount of inflow of $42 billion (i.e., $91 billion - $49 billion) accrued to foreign exchange reserves.
What is the implication of such a BoP situation for the exchange rate? If there is a current account deficit then in all likelihood this would be associated with a depreciating Indian rupee. After all, a depreciating rupee will make exports cheaper and imports more expensive, which, in turn, should lead to a shrinkage of the current account deficit.
Put differently, an exchange rate can be defined as the price of one country’s money in terms of the currency of another country. Each country measures the price of its goods and services using a particular scale of measurement. The exchange rate provides a conversion tool which allows expressing the prices of one country in terms of the units of measurement of the other country. For example, if bread is priced at $1 in the US and the exchange rate between the rupee and dollar is Rs 50 per dollar, then the price of the same bread will be Rs 50 if it is expressed in terms of the Indian currency.
If countries remain completely isolated, then it is not important to have the notion of an exchange rate. But once countries start exchanging goods and services among themselves then a conversion tool becomes essential. This is the basic and fundamental role played by an exchange rate. The exchange rate is essentially a pair and if there are roughly 190 countries in the world and if all of them have independent currencies then there would be a number of pairs of currency combinations (denoted by (190*189)/2) or nearly 18,000 exchange rates. However, since all the countries on earth do not have independent exchange rates, this number is actually smaller.
Spot and Forward Foreign Exchange Market
The exchange of domestic currency for foreign currency does not happen only in the spot market, i.e., in a market where the transactions happen instantaneously. Consider a textile exporter from Tirupur, Tamil Nadu, sending a consignment of hosiery worth of $50,000 to New York on 1 April 2019. It may take 30 days for the consignment to reach New York. Once the consignment reaches New York on 1 May 2019 the garment manufacturer will get the export proceeds. If suppose the exchange rate of the US dollar with respect to the Indian rupee has moved from Rs. 60 to Rs. 50, then in rupee terms the garment manufacturer will be getting less money. In order to hedge (protect himself) against this loss, the exporter may prefer to buy rupees in the forward market, i.e., buy dollars today for sale a month from now against an expected exchange rate prevailing at that point in the future. Now such a forward market can exist for different durations.
From our discussion of the BoP, it is clear that it is not only the needs of the real sector (like export and import of goods and services) that play an important role in the foreign exchange (forex) market. Transactions completely unrelated to the real sector, perhaps linked to speculative activities, could tend to dominate in the forex market. Thus, a combination of (a) spot and forward markets, (b) presence of speculators and real sector linked transactions, and (c) a huge number of paired transactions (corresponding to all the independent currencies in the world) together make the forex market really immense. A number is worth quoting in this regard. In 2017, while the aggregate value of global gross domestic product (GDP) was approximately $75 trillion (according to the International Monetary Fund (IMF)), the average per day value of transactions in the forex market was approximately $5 trillion!
Real and Nominal Exchange Rate
The exchange rate we have discussed so far is essentially the nominal exchange rate (i.e., not adjusted for the rate of inflation). A useful notion in this context is the exchange rate adjusted for inflation, which is the real exchange rate. That is to say, if the dollar-rupee exchange rate moves from 50 to 55, it signifies a 10% depreciation in the dollar-rupee rate. It does not mean that a dollar now buys 10% more commodities in India; that would depend on the relative rates of inflation in the US vis-a-vis India. Illustratively, if the Indian inflation is 10% and if the US inflation is 5%, then the dollar would buy 15 % (i.e., 10% + (10 - 5)%) more in India. This notion of the real exchange rate is often used to measure and comprehend the extent of competitiveness of a country's export.
Effective Exchange Rates
We have noted that the exchange rate typically refers to pairs of exchange rates between the currency of the home country vis-a-vis that of a foreign currency. But in reality a country trades with many countries and accordingly, as already noted, there would be various exchange rates for a currency. Is there any way one can combine the information content of all such exchange rates? Can one average all such exchange rates and arrive at a single number that tells us what is happening to the currency of a country vis-a-vis all its trading partners? This is what is attempted while constructing the effective exchange rate (EER). The effective exchange rate of the rupee is an index number that captures the exchange rate of the rupee, with respect to both the US dollar and the British pound. As some sort of an average of rupee-dollar and rupee-pound exchange rates, it is thus expressed as an index number. Moreover, while the rupee may depreciate with respect to the dollar, at the same time it may appreciate with respect to the pound. But India's trade with respect to the US and the United Kingdom (UK) may not be of a similar order, and hence some sort of weighted average is used in calculating the EER. Typically, in the construction of such a weighted average, the weights are the shares of the home country's export or trade (i.e., exports plus imports) in relation to various foreign countries. As already noted, there can be two kinds of EERs, viz., nominal (NEER) or real (REER, i.e., the NEER adjusted for inflation).
These distinctions between bilateral exchange rates and effective (or average) exchange rates as well as between the real and nominal exchange rates are extremely important in deciphering exchange rate movements.
2. History of Exchange Rates
The genesis of the exchange rate has a strong correlation with the evolution of money. Since the ancient ages till about the 18th century, commodities with an intrinsic value had been used as money. As we know, money has three basic functions: it is a store of value, it is a medium of exchange and it is a unit of measurement. In order to function as money, a commodity had to be widely accepted, be durable, possess a certain intrinsic value and be divisible into smaller units. Precious metals like copper, silver and gold (formally known as specie) were found to be particularly suitable for these purposes and were widely used as commodity money 1However, there are records of other exotic items like salt, peppercorns, seashells and even cigarettes being used as commodity money. . During this period, gold, silver and copper coins were used for national and long-distance commerce and the value of the coins varied based on the weight of the coins. Prices of goods and services were expressed in terms of weights of these metals and these precious metals were accepted across nations as a mode of payment. Therefore, explicit exchange rates at that time were not required.
From the early 18th century onwards, some countries started using notes as an alternative form of money. Generally, these notes were backed by precious metals like gold or silver and they could be exchanged into gold or silver if required. But these notes were initially issued by private banks and sometimes were not backed by adequate precious metals, which led to frequent banking crises. This uncertainty largely went away with the establishment of central banks. Notes issued by central banks were covered by adequate reserves of precious metals. This system eventually led to the creation of an international fixed exchange rate system known as the “gold standard”.
The Gold Standard (1870-1914)
Under the gold standard system, countries fixed the value of their currencies in terms of a specific amount of gold. The government or the central bank ensured complete two-way convertibility between money and gold. That meant that the central bank would freely exchange money into gold at the specified rate and vice versa. To ensure this convertibility, the amount of money issued by the central bank was tied to the amount of gold in its reserve. Given that each currency was tied to a specific amount of gold, bilateral exchange rates were automatically fixed. For example, if Britain fixed the value of its pound to 10 per ounce of gold and the US fixed the value of the dollar to 20 per ounce of gold, then the bilateral dollar to pound exchange rate gets fixed as 2 dollars a pound. The international gold standard was established in the 1870s and it lasted till the First World War (1914).
The period of the gold standard was a period of remarkable exchange rate stability. Major countries like the UK, US, France and Germany did not have any currency revaluations/devaluation during this period. However, contrary to expectations, price and output stability was not achieved under the gold standard. The biggest shortcoming of the gold standard turned out to be the requirement that money created by the central bank had to be backed by gold reserves. As gold reserves did not grow adequately in the global economy, this restriction prevented the central banks from using monetary policy effectively when the situation demanded it. Eventually this constraint led to the demise of the gold standard.
The Inter-War Period (1914-44)
With the onset of the First World War, the US started displacing Britain as the dominant economic power. It has been argued that there were two broad reasons behind the rapid rise of the US during this period (rivera-Batiz and rivera-Batiz 1985). During the initial years of the war, the US had lower inflation compared to Europe. This allowed it to be more competitive vis-à-vis war-ravaged Europe. And dollar-denominated assets found favour among European central banks as the dollar was still linked with gold (the major European currencies by then were not). Consequently, by the mid-1920s, the dollar displaced sterling as the leading reserve currency. The most important and long-lasting fallout of the inter-war period was the “the rise of New York as a financial centre, rivaling London, and of the dollar as an international currency, rivaling sterling” (Eichengreen and Flandreau 2009).
After the war ended, there was a brief return to the gold standard in 1925. However, this new gold standard regime did not find the same level of stability as it managed during the period of the classical gold standard. In 1931 the new gold standard was abandoned by the UK. Other countries also moved out of the gold standard to a regime floating exchange rates.
During the Great Depression of the 1930s, countries tried to adopt policies to boost domestic demand. One such policy was currency devaluation. Once countries moved away from the gold standard, they were not under a fixed exchange rate. Countries could now adopt expansionary monetary policies and devalue their currency with the objective of gaining an unfair advantage in international trade. A currency devaluation makes exports cheaper in terms of the foreign currencies and makes the domestic price of imports higher. As a result, it switches demand in favour of domestic producers at the expense of foreign producers. That is why devaluation is also called a “beggar-thy-neighbour” policy. However, things can become complicated if other countries also go for retaliatory devaluation of their own currencies. This is known in economics as the “currency war” and it was observed for the first time during the Great Depression of the 1930s.
The Bretton Woods System (1944-1971)
Even before the Second World War ended, countries started planning for post-war reconstruction and development. A deal was signed in 1944 at the Mount Washington Hotel in Bretton Woods to design a new international monetary order for the post-war period. As Bordo (2017) argues, the Bretton Woods system sought to provide a framework of monetary and financial stability to foster global economic growth. The IMF was established during the Bretton Woods summit to supervise and monitor the global financial system.
The Bretton Woods system moved away from the flexible exchange rate adopted by most countries during the inter-war period. In economics, there is a theory called “the impossible trinity” which suggests that a country cannot simultaneously have a fixed exchange rate, free capital flows and an independent monetary policy. Consider the US; it has free capital flows and an independent monetary policy and hence its exchange rate cannot be fixed. On the contrary, a West Asian economy like Saudi Arabia has free capital flows and a fixed exchange rate but no monetary policy independence. As the gold standard was a regime of a fixed exchange rate and free movement of capital, countries had to give up their monetary policy. As monetary policy can be useful in tackling unemployment and slow economic growth, countries were handicapped during the period of the gold standard as they could not use that policy.
After Bretton Woods, the dollar officially emerged as the reserve currency of the world. The US was given the onus of providing adequate liquidity to the world as well as maintaining the gold parity of the dollar.
The Bretton Woods arrangement recognized this problem. But it also tried to move away from a flexible exchange rate system, which had led to competitive devaluations and large-scale economic instability during the inter-war period. Taking elements from both the systems, the Bretton Woods agreement created "an adjustable peg" system. The major stipulations of this model were:
- Each participant country would set a fixed value of their currency to the dollar. This fixed value is called the “par value”. However, countries could devalue/revalue if they faced any “fundamental disequilibrium” or chronic economic instability.
- The value of the dollar was fixed in terms of gold. But the dollar was redeemable for gold only by the central banks.
- Unlike the gold standard, the Bretton Woods system allowed capital controls.
The new system gave the US a special position in the global monetary system. After Bretton Woods, the dollar officially emerged as the reserve currency of the world. The US was given the onus of providing adequate liquidity to the world as well as maintaining the gold parity of the dollar.
The Bretton Woods system evolved in a gold-dollar system. But strains started appearing as the US changed from a trade surplus country to a trade deficit one. A persistent current account deficit of the US implied that more dollars accumulated in other central banks. As some countries redeemed the dollar, it led to a reduction in gold stock in the US. Consequently, by the mid-1960s problems started appearing with the Bretton Woods system. In 1971, the US suspended the dollar-gold convertibility and by 1973 the adjustable peg system was also withdrawn. The major currencies were set afloat. In 1978, the IMF officially allowed its members to adopt exchange rate arrangements of their own choice. Countries currently have exchange rate regimes of different degrees of flexibility -- from hard peg regimes to fully market determined exchange rates.
3. Indian Exchange Rate Regimes
Against such a historical backdrop let us now turn to Indian specifics.
Exchange Rate Regime until Independence
India was not on the gold standard and followed a different trajectory. In 1835, it was declared that the silver rupee would be the sole legal tender throughout British India. The country maintained the silver standard from 1835 to 1893. Adams and West (1979) suggest that India remained on silver because the nation was accustomed to silver. The problem with the silver standard started with a sharp fall in prices of silver after 1875. It has been argued that this depreciated silver came into the country in large quantities in India and was largely minted in rupee coins (Chandavarkar A 1983). This led to a rise in the price level in the country and depreciated the rupee in terms of gold.
The government started moving away from the silver standard and introduced a gold exchange standard in 1893. The value of the rupee was pegged to gold, but gold currency was not introduced. India muddled through the First World War and the inter-war period with this gold exchange standard. From 1925, the exchange rate of the rupee was based on a sterling-cum-gold basis and eventually in 1931, when the British officially abandoned the gold standard, the rupee was linked to sterling.
India is an “Original Member” of IMF as it was one of the countries to sign the Articles of Agreement of IMF on 27 December 1945. After Independence India followed a fixed exchange rate regime and the rupee was pegged to the pound sterling. Its dollar value was determined on the basis of the cross-rates of the dollar and pound sterling. It is sometimes argued that during its initial period of planned economic development, India showed an anti-export bias and maintained an overvalued currency. The pegged value of the rupee remained unchanged till 1966. However, by this time India’s inflation was high and the country was suffering from a sustained current account deficit. Subsequently, the rupee was devalued on 6 June 1966 by 36.5 percent. The value of the rupee was kept at this level till the collapse of Bretton Woods.
In 1975, in view of a declining importance of India-UK bilateral trade, the rupee was delinked from sterling and was pegged to a basket of currencies. The selection of currencies and the choice of weight was decided by the RBI and was not publicly disclosed. Since the early 1970s, India’s foreign exchange market was regulated by several strict legislations. The Foreign Exchange Regulation Act (FERA) of 1947 was replaced by the more comprehensive and almost draconian FERA of 1973.
From the early 1980s onwards, India maintained the basket peg but as it started opening up, it was recognised that the Indian exchange rate was misaligned. India gradually initiated devaluation and started moving towards a more realistic value. It has been pointed out that India’s real exchange rate depreciated by about 30 percent from 1985-86 to 1989-90.
Situation since 1991
It is well known that the exchange rate regime up to 1990 is best described as "an adjustable nominal peg to a basket of currencies of major trading partners with a band" (Rakesh Mohan 2006). India was hit hard by the 1991 crisis when its forex reserves reached a low of $1.2 million (capable of funding essential imports of just three weeks).
Following the crisis, there were significant changes in India's external sector. Its general philosophy was laid out in the Report of the High Level Committee on Balance of Payments (1993) which was chaired by C. Rangarajan, later RBI Governor. The Rangarajan committee recognized that trade policies, exchange rate policies and industrial policies were intimately interlinked and that these need to form "part of an integrated policy framework so as to boost the overall productivity, competitiveness and efficiency of the economy" (Mohanty, 2012).
The exchange rate regime in the new era was characterized by the following major changes:
- The exchange rate of the rupee was adjusted downwards in two stages on July 1 and July 3, 1991 by 9 per cent and 11 per cent, respectively.
- A dual exchange rate system, introduced in March 1992, was turned into a unified system in March 1993.
- Subsequently, India moved to "current account convertibility" in August 1994 by liberalising various transactions relating to merchandise trade and invisibles.
- In terms of legal reforms the earlier restrictive FERA of 1973 was replaced by the Foreign Exchange Management Act (FEMA), 1999, which is more liberal and market friendly.
Since India liberalised in 1991, its outlook towards exports has changed. Export promotion has become a key policy objective for India. This change in policy is manifested by a rapid increase in exports of merchandise goods from India. The exports to GDP ratio rose from about 5.8 percent in 1990-91 to about 16.8 percent in 2011-12 but declined to 11.4 percent in 2017. Moreover, this period experienced a rapid growth in exports of services from India. Inflow of remittances also contributed significantly to India’s current account.
While the capital account ... was liberalised from the late 1990s as well, the pace and extent of opening up of capital account was restrained and calibrated.
Exports of services and inflows of remittances are captured in the BoP by the “Invisible receipts” category. Invisible receipts have increased rapidly over the years. However, import growth has been high enough to offset all these positive flows in the current account. In 2017, India’s merchandise imports to GDP was 17.1 percent. Rapid growth in domestic economy has fuelled a strong demand for imports of oil. gold and manufactured goods 2Data on trade and GDP of India are from WTO Trade Profiles 2018. .
A note on the notion of convertibility is in order. The notion of convertibility typically refers to the ease with which people can convert a domestic currency to a foreign currency. Since foreign exchange is a precious asset (after all, a country cannot print it), often the ease of such a conversion varies with respect to use/purpose for which the foreign exchange is put. With the attainment of "current account convertibility" in 1994, there was significant liberalisation with respect to different items of India's current account, viz., trade of good, trade of services (like software), and remittances.
The situation with respect to items on the capital account, such as foreign direct investment, foreign portfolio investment in India's debt and equity market, external commercial borrowing and non-resident deposits was different. While the capital account (and its various subcomponents) was liberalised from the 1990s as well, the pace and extent of opening up of capital account was restrained and calibrated.
Thus, the exchange rate of the Indian rupee is reasonably market determined. The market is of course transacted by banks, which, in formal terms, are known as "Authorized Dealers". In fact, the IMF in its 2017 Annual Report on Exchange Arrangement and Exchange Restriction has classified the rupee as "floating".
This does not mean that the RBI does not intervene in the forex market. The RBI philosophy of intervention in the forex markets is best captured in former RBI Governor Bimal Jalan's following statement made in 2003:
RBI does not have a fixed ‘target’ for the exchange rate which it tries to defend or pursue over time; RBI is prepared to intervene in the market to dampen excessive volatility as and when necessary; RBI’s purchases or sales of foreign currency are undertaken through a number of banks and are generally discrete and smooth; and market operations and exchange rate movement should, in principle, be transaction-oriented rather than purely speculative in nature.
This has been the official RBI policy till date. For instance, the 2014 RBI Report of The Expert Committee to Revise and Strengthen the Monetary Policy Framework commented in 2014: “The RBI does not target a specific rate or level for the exchange rate … the RBI intervenes in the market only to smooth exchange rate volatility and prevent disruptions to macroeconomic stability.”
Before we consider the nature of movements in the Indian exchange rate, it is pertinent to note that traditionally India has had a current account deficit in its BoP, implying that India's earnings from export of goods and services and inward remittances typically fall short of import of goods and services and outward remittances. Interestingly, while India has a surplus on account of export of services and remittances, its substantial deficit in export/import of goods makes the sum (i.e., the entire current account) to be negative. This is quite visible from Figure 1, which plots the current account balance as a percentage of GDP since 1990-91. In fact, other than during a brief three-year period from 2001-02 to 2003-04, the Indian current account has always been in deficit.

But why is it so? It is to do with the structure of the Indian economy. First, unlike in China, the Indian manufacturing sector is not sufficiently dynamic and with limited capability we are unable to export sufficiently. Second, three are at least three items, where India's imports have gone up substantially over the years: oil, gold and electronics.
These two features of India's balance of payments, viz., the current account deficit, and the dominance of portfolio flows in financing such deficits have profound implications for the Indian exchange rate.
How could India finance such a deficit? Financing of such current account deficits has come primarily from foreign investment and then from inflows on account of external commercial borrowings as well as deposits of non-resident Indians. Interestingly, as foreign investment in India has often been dominated by portfolio investment (i.e., investment in the stock or bond markets), it has turned out to be quite volatile, experiencing sharp outflows in years when the global capital markets turn volatile. Illustratively, in 2008-09 it turned out to be negative, coinciding with the global financial crisis of the time.
These two features of India's balance of payments, viz., the current account deficit, and dominance of portfolio flows in financing such deficits, have profound implications for the Indian exchange rate. Since these are exchange rates of the rupee with respect to foreign currencies, any upward movement in Figure 2 is to be interpreted as depreciation of the rupee and a downward movement is representative of an appreciation of the Indian rupee.

What has been the movement of the exchange rate of the rupee? Figure 2 plots the exchange rate of the rupee with respect to four currencies, viz., the US dollar (USD), British Pound (GBP), Japanese Yen (Yen), and euro (Deutsche Mark before the birth of the euro).
A number of features can be discerned from Figure 2:
- There have been gyrations in the exchange rate of the rupee, implying a two-way movement. That is to say, the rupee has moved in both directions, sometimes appreciating and sometimes depreciating.
- Despite the fluctuating tendencies, a look at Figure 2 confirms the general long term trend of a depreciating rupee
There are episodes when there has been sharp depreciation in the rupee, e.g., April - August 2013, and May - September 2018.
But these are just bilateral exchange rates of the rupee with respect to four major currencies. Since India trades with many more countries, we have already pointed out that a useful tool in this context is the notion of the effective exchange rate -- real or nominal. What are the trends revealed from the index of the nominal effective exchange rate (NEER) or real effective exchange rate (REER, i.e., NEER adjusted for inflation differential between India and its trade partner)?

Unfortunately, long series data on REER or NEER are not available. Hence Figures 3a and 3b plot the RBI data on indices of REER and NEER of the rupee (base 2004=05 =100) that has been constructed with a weighted average of the exchange rate (with 36-currency bilateral trade / exports of India as weights) over the period May 2004 to January 2019.

Among these two charts, clearly the movement in the REER is more meaningful. Note that since both REER and NEER are index numbers, any movement in the upward direction would mean an appreciating rupee and any downward movement would mean a depreciating rupee. Figure 3(b) reveals interesting movements -- particularly, an appreciating rupee between August 2013 and August 2017. This is unlike the movements in bilateral exchange rates.
To sum up, variations in the exchange rate are quite sensitive to the variables chosen and need to be probed beyond the more commonly known rupee-US dollar exchange rate.
But what determines exchange rates in India? If one deciphers the structure of India’s balance of payments, four major economic factors seem to stand out:
- our increasing but less buoyant export earnings (dominated by gems and jewellery, mineral fuels including oil, and machinery including computers, and pharmaceuticals on the goods front; and software service and remittances in the invisibles front);
- our substantial import bill (dominated by oil, gold and electronics);
- the nature and quantum of our foreign investment, which can experience sudden outflows depending on the mood and fad of the global capital markets (geographically located in financial centres like New York, London, Singapore or Hong Kong); and
- the nature and quantum of RBI intervention.
Any change in the configuration of any of these factors will have an impact on the exchange rate. For example, an oil price hike will make our import bill larger and hence may have an impact on the exchange rate of the rupee -- so will a possible restrictive policy of H1B visas whereby fewer software engineers will be able to go the US for work. Even an announcement by the US Federal Reserve of a hike in US interest rate could make foreign capital flow out from India.
Nature of RBI Intervention
Since the RBI has forex reserves and since forex markets are dominated by commercial banks, buying and selling of forex by the RBI can have profound implications for the exchange rate in India. How have the RBI's forex reserves evolved over time? Figure 4 plots the reserves, showing a steady increase from $6 billion in 1991 to $425 billion by end March 2018. In fact, excepting 2008-09 and 2012-13, there was no year in which India's forex reserves declined.

The major purposes of keeping forex reserves are perhaps two: (a) to have the ability to intervene in the market to curb any abnormal volatility in the exchange rate and (b) to have the insurance to deal with a crisis. Hence, the purpose of the central bank keeping forex reserves is not to earn interest but to invest these in safe assets like securities/debt instruments of those governments which tend to have solid credit ratings. While the exact composition of forex assets is not revealed by the RBI, it is logical inference that these are primarily kept in government securities of the major advanced countries.
Since India is hugely dependent on foreign investment and borrowing to finance its current account deficit, any global turmoil could lead to capital flight causing a sharp depreciation of the rupee.
While India has a decent amount of forex reserves both in absolute terms and in terms of a cover for imports, the RBI has not been intervening in the forex market in a substantial manner. This seems logical to us. After all, in view of the substantial trade deficit and a significant current account deficit, it is not surprising that the rupee shows a depreciating trend. Thus, if the RBI wants to defend a particular value of the exchange rate of the rupee and intervenes in the forex market (e.g., buys or sells dollars from/to the commercial banks) then the players in the forex market will test RBI's capability. In the end the rupee may gain a few notches but at the cost of the RBI losing a substantial amount of forex reserves. A comparison: China with a forex reserves of $4 trillion (as of May 2014) could intervene to the extent of $1 trillion till February 2017 -- but with forex reserves of $425 billion India's capability to intervene/defend the rupee's exchange rate is much more limited.
4. A Tale of Two Crises
Since India is hugely dependent on foreign investment and borrowing to finance its current account deficit, any global turmoil could lead to capital flight causing a sharp depreciation of the rupee. We illustrate this phenomenon with the help of two crisis episodes.
June - August 2013 3For details on this crisis see Ray (2014)
The first episode was in June–August 2013 when the rupee-dollar exchange rate came down from 56.76 in the beginning of June 2013 to 67.88 on 29 August 2013, indicating a depreciation of nearly 16% over three months. The deprecating exchange rate has also been noticeable in the trend of the 36-country REER of India during this period.
The immediate trigger behind this depreciation was the news of a possible tapering of the rate of quantitative easing (QE) as read by the market into the statements of Ben Bernanke, the chairman of the US Federal Reserve in end-May 2013. Forex market participants read Bernanke’s statements as the US economy about to enter a upswing in its business cycle. This would imply an increase in the relative lucrativeness of the US economy via-a-vis many of the emerging market economies. This caused an outflow of foreign capital on both equity and debt. During the three-month period June - August 2013 foreign institutional investors (FIIs) pulled out a little over $12 billion from India. The rupee recovered later in the year after clarifications were issued by the US Fed chairman and the RBI took a number of initiatives like intervening in the forex market, imposing restrictive regulations on gold imports, opening a forex swap window for the oil marketing companies like Indian Oil, etc.
April - September 2018 4This section draws on Pal and Ray (2018).
Last year, the rupee-dollar exchange rate went from less than Rs.65 in early April 2018 to almost Rs.73 by the end of September 2018. This caused a fair amount of panic in the forex markets. More generally, during this period the rupee depreciated with respect to all the major currencies..
A number of important features of this spell of depreciation are discernible. First, there was a significant widening of the current account deficit during August 2017-March 2018, caused mostly by merchandise trade in general and massive increases in the oil import bill (due to the oil price rise), imports of electronics, and gems and jewellery (including gold). Second, there were substantial FII outflows. This could have been triggered by an increase in the interest rate by the US Fed as well as the threat at the time of a trade war between the US and China. Third, while the RBI did intervene in the forex market during this period, such intervention was somewhat limited. The rupee, however, recovered post-September 2018.
5. Conclusions
The exchange rate is the price of the domestic currency expressed in terms of a foreign currency. While from a narrow perspective it is determined by the demand for and supply of foreign exchange, in reality it reflects the history, geography and contemporary context of the domestic economy vis-a-vis the global economies. Also, the global political structure and pressure groups tend to play hugely important roles in influencing the exchange rate.
For example, the dollar maintains its hegemony over the global trading and payments system, and the US economy thus enjoys an "exorbitant privilege" having the dollar as its currency. Since financial market power (as against pure economic power) tends to play an important role in the determination of the exchange rate, contrary to their economic capability, some of the European countries like Switzerland have currencies that are important in the global market place.
In the Indian case, a perennial current account deficit makes India quite dependent on the vagaries of the global capital and commodity markets. Hence, while it is no wonder that the Indian rupee has been on a long-term depreciating trend, there are episodes of volatility of global capital when the exchange rate of the rupee tends to experience sharp gyrations. While a depreciating currency in general is beneficial to a country's exports, for India the large value of oil and gold imports makes the economy hugely vulnerable to fluctuations in the exchange rate. Moreover, some of the benefits of depreciation disappear when the export structure of a country becomes more import intensive. This has also happened with India.
Thus, exchange rates are much more than just relative prices. Unless properly managed they can harm a country's economy.