


In the seminal book An Uncertain Glory: India and its Contradictions, Jean Drèze and Amartya Sen lamented that "social failures that are of enormous importance for development" received scant attention in public debate and democratic politics in India (Drèze and Sen 2013: 282). Almost a decade later, we find issues such as hunger and undernutrition occupying the centre-stage of public debate, but with an unwarranted focus on sensationalised global rankings and indices.
“The Global Hunger Index 2022 reveals a dramatic hunger situation worldwide,” Welt Hunger Hilfe spokesperson Laura Reiner wrote on the Global Hunger Index (GHI) website. Indeed, what India witnesses in the name of public debate each year after the index is released is a repetitious drama, that is predictable, ill-scripted and misleading. The opposition and a large section of the media consider it an opportune moment to pounce on the ruling party, whose fetish for global rankings is well known. This year too, newspapers were flooded with headlines highlighting India’s ‘fall’ or ‘slip’ down the league table of countries to 107 from 101.
Predictably, the government saw this as a conspiracy to tarnish India’s image in international forums. A statement issued by the Ministry for Women and Child Development dismissed the index outright, claiming that it had serious methodological flaws: “Misinformation seems to be the hallmark of the annually released Global Hunger Index”.
[T]he ease with which GHI can be rubbished has an undesirable consequence: it diverts popular attention away from the extremely serious issue of persistent child undernutrition in India.
One may not have much quarrel with the argument that we need a deliberately constructed crude measure as a means of getting the ear of the world, as the advocates of United Nations Development Programme’s Human Development Index used to say. But there is a downside to this strategy. If a poorly designed index is used to criticise a certain adversary and the adversary launches a counte-rattack, very little can be done in defence.
We argue here that the GHI is indeed a rather poorly designed measure of the summary status of hunger in a country as it suffers from methodological errors and data limitations 1That the derivation of GHI is replete with methodological errors is something that development scholars, even the ones who have been critical of the government’s attitude towards unfavourable data, agree on. Yet, the publication of the index values and the country rankings continue to grab attention in various forums year after year. . The ease with which GHI can be rubbished has an undesirable consequence: it diverts popular attention away from the extremely serious issue of persistent child undernutrition in India.
In what follows, we first discuss how limited the GHI is as a measure of ‘hunger’. Next, we highlight the persistence of child undernutrition in India in its myriad manifestations, delving into different rounds of the National Family Health Survey data. This will help us approach the policy question in a more nuanced way than what is possible with the GHI.
Problems in the GHI
A composite index fulfils the need for a synthetic measure of achievements or deprivations. It presupposes a deliberate conceptual aggregation of separable facts. However, at the conceptual level, the GHI falls short of what it aims to capture.
GHI does not capture hunger
The four components of the index are the prevalence of undernourishment, child stunting, child wasting, and child mortality. While the first indicator, if measured accurately, would directly relate to hunger, the other three result not only from food intake but also from a host of other factors including awareness, dietary diversity, disease environment, and access to healthcare.
While data on child undernutrition and mortality for India comes from the latest round of the National Family Health Survey (NFHS), that on undernourishment comes from Food and Agricultural Organization's (FAO) estimates from Gallup World Poll’s Food Insecurity Experience Scale (FIES) survey of a mere 3,000 households in India. The survey asked eight questions about the respondents’ perceptions about adequacy of food. The government has been particularly dismissive of this survey.
[T]he [GHI] scores are not comparable between successive years. However, nobody seems to pay heed to such cautionary notes...
However, other surveys conducted during the lockdown also showed that while more extreme and overtly visible forms of hunger 2The typical questions on extreme hunger ask if a household ran out of food or had a member who had to go without food for a whole day (https://microdata.fao.org/index.php/catalog/1373). are less common in India, substantial sections of the population suffer from micronutrient deficiencies or hidden hunger, both which are further aggravated during a crisis. For instance, the World Bank-sponsored survey, "COVID-19-Related Shocks in Rural India 2020" shows that almost 30% of rural households in India had to reduce their intake during the lockdown in 2020.
GHI as a composite index
GHI uses a simple additive formula that assigns one-third weight to each of the indicators: inadequate calorie intake, child undernutrition, and child mortality. Child stunting and wasting are assigned one-sixth weight each. Based on the values of the four indicators, a GHI score is calculated on a 100-point scale, 0 being the best possible score (no hunger) and 100 the worst. A GHI score equalling or exceeding 50 is considered ‘extremely alarming’, that between 35 and 49.9 is ‘alarming’, and a score in the range 20.0–34.9 is ‘serious’.
Researchers have long pointed out that bundling different indicators to form an overall index and using it to rank countries may be problematic due to multiple reasons. As Sen (1987) remarked:
The passion for aggregation makes good sense in many contexts, but it can be futile or pointless in others. Indeed, the primary view of the living standard is in terms of a collection of functioning and capabilities, with the overall ranking being the secondary view (p 33).
The same logic applies to the GHI as well. Since the choice of the set of indicators is arbitrary, replacing a particular indicator with another or simply adding one indicator to the existing four may significantly change the ranking of countries.
For example, besides stunting (short in height for age) and wasting (underweight for height), one might also add 'underweight for age', since these three together are the standard anthropometric indicators of child undernutrition and are routinely reported by demographic and health surveys. Having added the third indicator, logically we should assign one-ninth weight to each of the three indicators, instead of the earlier one-sixth. Since among the three indicators, wasting is the worst in India to which we have now assigned less weight than before, the overall value of GHI for India is then likely to improve.
Similarly, because of the additive formula, a decline in the percentage of the calorie deficient by 1 percentage point is numerically equivalent to a 1 percentage point decline in child mortality, since both have the same contribution to the value of the composite GHI. But in terms of their intrinsic importance, we have good reason to believe that a 1 percentage point decline in child mortality is far more significant than a 1 percentage point decline in the percentage of the calorie deficient.
Data issues
One wonders why in the GHI the 2020 undernutrition figures are lower than the 2022 figures if the source of these figures are the Demographic and Health Surveys (DHS), which for India is the NFHS.
The NFHS-5 (2019–21) figures for both wasting and stunting are lower than the corresponding NFHS-4 figures (2015–16), although the difference is rather small. The data used for GHI 2019 and 2020 have been probably drawn from the Comprehensive National Nutrition Survey (CNNS) conducted by the health ministry in collaboration with the Population Council. This has to be guesswork since the GHI reports do not explicitly state the data sources used for different countries.
Comparing the incomparable
The GHI website clearly states that while inter-country comparisons may be done for each year, the scores are not comparable between successive years 3This is because of the fact that the data and methods are often revised and thus may be different for different years. For instance, the severity of hunger scale itself was revised in 2015. The scores for most countries before 2015 were lower than those since 2015. Obviously this does not imply that hunger rose all over the world since 2015. Also, there is often an overlap in the range of years for which the indicator values are calculated in the successive reports. Neither are the rankings comparable between years because the total number of countries may differ between years due to data availability. For instance, in 2021 the number of countries ranked was 116, which increased to 121 in 2022. Nobody seems to pay heed to such cautionary notes, with public debate in India hovering around the country’s movement along the league table of countries arranged with respect to their GHI scores. . However, nobody seems to pay heed to such cautionary notes: public debate in India focusses on the country’s movement along the league table of countries arranged with respect to their GHI scores. What the annual report on GHI does do is make the necessary calculations and provide comparable figures for countries across certain benchmark years.
[A] rise in the composite index does not imply a rise in all of its constituent indicators…
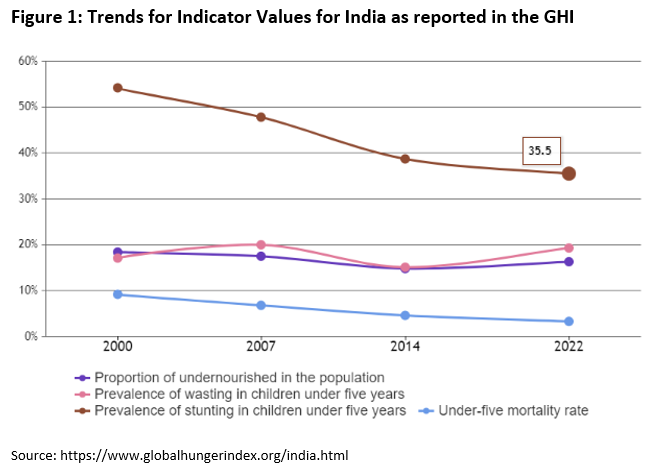
For 2022, the benchmark years are 2000, 2007, and 2014 (see Figure 1 for the change in the indicators for India over this reference period). It also provides the change (both absolute and percentage) in the values of the composite index between 2014 and 2022.
One needs to be extremely cautious while interpreting such changes. For instance, between 2014 and 2022 Argentina – which has low undernourishment, child undernutrition, and child mortality – saw an increase in the GHI score by 1.8 (a worsening), which meant an increase by 36%. A small increase from an already low initial level would unduly inflate the percentage change. The situation in Bangladesh (with low undernourishment, high wasting, very high stunting, and medium child mortality in 2014) offers the opposite picture. A fall in the GHI score by 6.7 (an improvement) between 2014 and 2022 translated to a decline by 25.5%.
Again, a rise in the composite index does not imply a rise in all of its constituent indicators. During the same period when Argentina’s GHI score worsened, its child mortality improved to 0.9% from 2%. One needs to be mindful of these nuances instead of overemphasising the changes in scores or ranks for a particular country.
The real issues in nutrition
The GHI classifies each indicator into five categories: very low, low, medium, high, and very high. From the GHI 2022 breakup, we find that India has a medium level of undernourishment, as captured by the Gallup survey. In terms of child mortality India fares better. Its child mortality rate of 3.3% is considered low. These indicators thus cannot be driving India’s placement in the ‘serious’ category of overall GHI or its rank of 107 amongst 121 countries.
India’s high figures of stunting and wasting amongst children (35.5% and 19.3%, respectively) seem to drive it to the bottom of the league table. 4Following the Waterlow classification scheme, stunting is low height-for-age and wasting is low weight-for-height. These indicators are expressed in standard deviation units (z-scores) from the median of the World Health Organization reference population. If the z-score is below minus two standard deviations (-2SD) from the median of the reference population, the child is considered to be undernourished in that dimension. Children below minus three standard deviations (-3 SD) from the median of the reference population are considered to be severely undernourished. Stunting is a cumulative indicator of nutritional deprivation from conception. It is relatively independent of current conditions, and indicates permanent or chronic undernutrition. Wasting describes current nutritional status and is an indicator of short-term undernutrition. (Child wasting rates above 15% and child stunting rates above 30% are considered ‘very high’ in the GHI). The country has the highest child wasting figures amongst all countries. Though stunting for children below five years has reduced substantially between NFHS-3 (2005–06) and NFHS-5 (2019–21) to 35.5% from 48%, much of the improvement was between 2005–06 and 2015–16 5The analysis has been restricted to the last three rounds of NFHS, since NFHS-2 measured the last two children belonging to the household who were below three years of age. The subsequent rounds provide anthropometric measurements for all children in the household below five years of age. . However, wasting in the same group of children stubbornly remains at a critical level: 19.8% in NFHS-3 and 19.3% in NFHS-5. It had in fact increased to 21% in NFHS-4 (2015–16). Even according to the Global Nutrition Report, while India is "on course" to meet the target for child stunting, it has made "no progress" as far as child wasting is concerned.
Issues in stunting
However, there are issues in child stunting in India that merit immediate policy attention. Though child stunting reduced substantially between 2005–06 and 2015–16 in all the major states of India, according to the NFHS, there was no evidence of convergence amongst states in child stunting during the period (Mukhopadhyay and Chakraborty 2020). Convergence was achieved only between 2015–16 and 2019–21, though the reduction in the national figure for child stunting was meagre, to 35.5% from 38.4%.
As Figure 2 shows, some of the high-stunting states, such as Rajasthan, Uttar Pradesh, and Madhya Pradesh, showed sharp declines. Yet, child stunting increased in five major states (Gujarat, Kerala, Maharashtra, Telangana, West Bengal) over the same period. This deserves policy attention since compared with international standards, undernutrition rates are still very high even in states with relatively better averages.
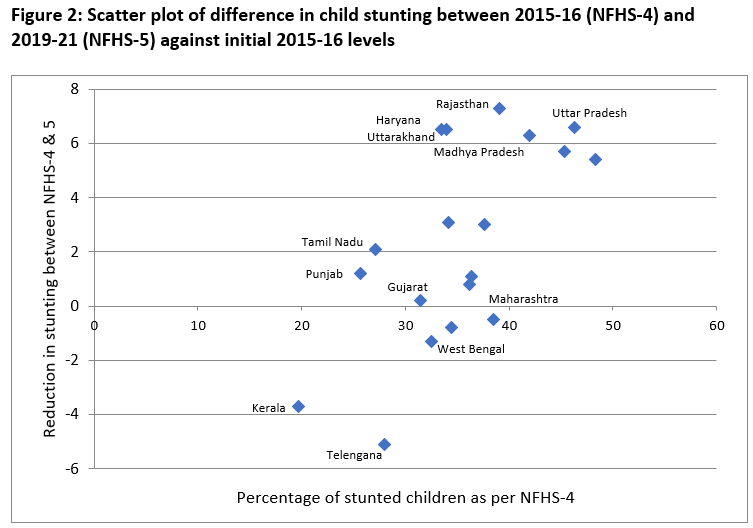
Despite greater reduction in the backward states, we find that states like Bihar, Jharkhand, Madhya Pradesh, and Uttar Pradesh still have the highest rates, which are much above the national rate of child stunting. Rajasthan is the only exception. The state had a child stunting rate (39.1%) that exceeded the national rate in NFHS-4, but the rate from NFHS-5 data (32.1%) was lower than the overall figure for the country. Another unusual state is Gujarat. It figures in the category of states where the extent of stunting is higher than the national average in both the rounds of NFHS. All other states in this category were the typically backward states (Bihar, Jharkhand, Madhya Pradesh, and Uttar Pradesh).
Child stunting has consistently been higher among the poorer wealth quintiles of the NFHS.
Severe stunting has grave implications for cognitive performance and adult life outcomes in the labour market. According to the latest, NFHS-5, figures, more than 15% of Indian children are severely stunted.
Wasting persistent at critical levels
Wasting is “the most immediate, visible and life-threatening form of malnutrition. It results from the failure to prevent malnutrition among the most vulnerable children.” The 2012 World Health Assembly target for on wasting urges countries to “reduce and maintain childhood wasting to less than 5% by 2025.” However, as Gross and Webb (2006) write, wasted children in non-emergency settings receive scant attention and continue to face higher risks of mortality.
A wasting rate exceeding 15% is considered a criterion to identify a public health disaster. The NFHS reports show that overall wasting has remained sticky in India around 19% between 2005–06 and 2019–21. However, severe wasting has actually increased over the three NFHS rounds during this period.
Socioeconomic gradient in stunting and wasting
Child stunting has consistently been higher in the poorer wealth quintiles of the NFHS. The NFHS reports show that the reduction in stunting in the poorest wealth quintile (the wealth size classes organised by possession of assets) between 2015–16 and 2019–21 has been only 4.5 percentage points. Severe stunting in the poorest quintile (22%) is more than twice that in the top two wealth quintiles (around 10%).
What is additionally worrying is the fact that stunting seems to have stagnated for the top two wealth classes around 25%. These are high levels compared to international standards. Stunting in the richest quintile has been more than double that in the poorest quintile for all the survey years since 2005–06. Though difficult to explain, severe wasting also has increased more amongst the children in the top two wealth quintiles compared with that in the bottom two quintiles. As a result, there is very little dispersion in the incidence of severe wasting across the wealth classes.
Amongst social groups, children belonging to the Scheduled Castes and Scheduled Tribes are particularly vulnerable due to the high incidence of stunting, with wasting being particularly serious among the Scheduled Tribe children.
Conclusions
Because of its weak methodology, the GHI fails to trigger meaningful public discussion that should ideally have focused on the persistent problem of child undernutrition in India. Using the available data from reliable sources such as NFHS allows us to go beyond the superficiality of the ongoing debate around the GHI.
Besides noting the rather small declines in both stunting and wasting amongst children between the two latest NFHS rounds (2015–16 and 2019–21), we have shown that there has been a remarkable stickiness in the indicator values at higher wealth quintile classes. On the other hand, the percentage of children who are undernourished has in fact increased in some of the better-off states. From the slow overall improvement and the apparently anomalous worsening amongst the better off, one might question the measurement standard itself, i.e. the reference standards for height and weight that are used for identifying the stunted and the wasted. This question has in fact been raised by commentators who are apparently oblivious of the fact that the question of appropriate standard has long been settled.
[I]nstead of questioning the standard itself we should investigate why the high levels of child undernutrition persist in India in spite of a perceptible decline in poverty.
The global standard has been derived by the WHO, and most countries of the world have adopted it. It is based on a sample of privileged children drawn from different countries including India. Panagariya (2013) had in the Economic and Political Weekly provocatively asked if the undernutrition figures for India were exaggerated and based on faulty international yardsticks. He argued that genetics had a crucial role to play and that children from Sub-Saharan Africa are in reality not better nourished than their Indian counterparts. A scathing criticism of his arguments followed in the EPW in a series of six articles by noted nutritionists and economists. These articles slated the methodology, analysis and findings of Panagariya’s paper and accused him of trying to manipulate measurement standards that would "conveniently underestimate the burden of child undernutrition" (Wable, 2013). Therefore, instead of questioning the standard itself we should investigate why the high levels of child undernutrition persist in India in spite of a perceptible decline in poverty.
Using the India Human Development Survey (2011–12) data, Desai and Vanneman (2015) showed that access to the Integrated Child Development Services (ICDS) had a positive effect on child undernutrition. Some connection between the two can be observed in Tamil Nadu. In contrast to the trend in better-off states where child undernutrition has generally worsened, Tamil Nadu has made consistent progress in reducing undernutrition. It is not a mere coincidence that the state is also known for successful implementation of the ICDS programme. The RajPusht project of the Rajasthan government can be another case in point. The programme functions in partnership with international agencies and community actors to reverse the diminishing marginal returns of ICDS so that maternal and child undernutrition may be reduced. Such sustained public action to improve the services of ICDS is perhaps what is needed, which can hardly be achieved by the emotive excesses that we have just seen around GHI 2022.
Achin Chakraborty is Director and Professor of Economics at Institute of Development Studies Kolkata; Simantini Mukhopadhyay, Assistant Professor of Economics at Institute of Development Studies Kolkata.