




Introduction
For more than two decades, the relatively modest contribution of the business sector to research and development (R&D) has been a major weakness of India’s national system of innovation. The latest National Science and Technology Management Information System (NSTMIS) statistics, however, indicate a substantial change. The Business Expenditure on Research and Development (BERD) increased from Rs 51,984 crore in 2020-21 to Rs 85,599 crore in 2021-22, a 64.7% increase, and rose further to Rs 120,609 crore in 2023-24. Business enterprises account for a much larger share of India’s Gross Expenditure on Research and Development (GERD).
These figures indicate a meaningful expansion of R&D expenditure, but they should not automatically be interpreted as evidence that corporate R&D behaviour changed by nearly two-thirds in a single year.
The central question is not whether Indian firms have increased their R&D expenditure. The evidence strongly suggests that they have. The more important question is whether the size and timing of the reported increase represent a comparable change in firms’ actual R&D behaviour, or whether improvements in survey coverage and statistical compilation account for a part of the apparent increase. This distinction matters because the policy implications of a genuine transformation in corporate innovation differ from those of a substantial improvement in measurement.
The article examines this question in three ways. First, it considers the changes in the NSTMIS survey methodology and their implications for measured BERD. Second, it compares the official BERD series with independent company-level data from the Centre for Monitoring Indian Economy (CMIE). Third, it examines whether the treatment of R&D undertaken overseas by Indian multinational enterprises is consistent with the territorial principle in the Frascati Manual of the Organisation for Economic Co-operation and Development (OECD).
1. Genuine Growth, With a Break
The NSTMIS figures show a sharp discontinuity in India’s BERD series. Between 2014-15 and 2020-21, annual BERD growth generally ranged between about 2% and 9%. Growth then rose to 64.7% in 2021-22, followed by increases of 13.9% in 2022-23 and 23.7% in 2023-24. The GERD also recorded an unusually large increase of 52.9% in 2021-22.
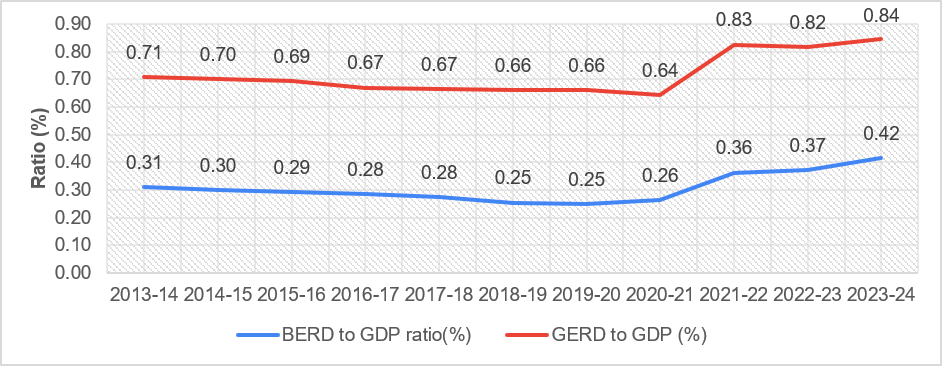
The BERD-to-gross domestic product (GDP) ratio, which had remained broadly around 0.25% to 0.31% for many years, rose from 0.263% in 2020-21 to 0.363% in 2021-22 and 0.416% in 2023-24 (Figure 1).
These figures indicate a meaningful expansion of R&D expenditure, but they should not automatically be interpreted as evidence that corporate R&D behaviour changed by nearly two-thirds in a single year. The scale and timing of the discontinuity coincide with major changes in the way the NSTMIS measured business R&D. Moreover, the GERD-to-GDP ratio had previously reached 0.84% in 2008-09 and remained close to 0.80% for several years. Thus, the recent rise, while important, should be interpreted against the longer historical trajectory rather than as an entirely unprecedented transformation of India’s R&D intensity.
Figure 1: Gross Domestic Expenditure on R&D as a percentage of GDP and Business Enterprise Expenditure on R&D as a percentage of GDP
2. Improved Measurement
The latest National Survey on Resources Devoted to Scientific and Technological Activities expanded the coverage of business enterprises substantially (NSTMIS 2025). The number of industrial R&D units covered increased by almost 38% compared with the previous survey, with much of the increase coming from private sector enterprises. Firms that had previously been outside the survey frame, or that had not responded in earlier rounds, were therefore more likely to enter the statistical system.
The key empirical issue is whether the revised NSTMIS estimates are broadly consistent with independent evidence on corporate R&D expenditure.
The NSTMIS also broadened the evidence used to compile the estimates. In addition to direct survey responses, it drew on company annual reports and audited financial statements, the CMIE database, Business Responsibility and Sustainability Reports, Department of Scientific and Industrial Research records, Public Enterprises Survey reports, and other administrative and official sources. Such supplementation can reduce non-response bias and fill gaps in survey returns.
This approach is consistent with the OECD’s Frascati Manual, which encourages statistical agencies to combine survey information with reliable administrative and secondary sources where this improves coverage (OECD 2015). A rise in the measured BERD following such methodological changes is therefore not, in itself, evidence of statistical error.
Firms may have been undertaking R&D before they were adequately captured by the survey. Better measurement can consequently raise the recorded level without implying a sudden behavioural change in the year in which the revised methodology is introduced.
The key empirical issue is whether the revised NSTMIS estimates are broadly consistent with independent evidence on corporate R&D expenditure.
3. CMIE Evidence
The CMIE Prowess database provides an independent benchmark because it derives R&D expenditure from companies published financial statements rather than from the NSTMIS R&D survey (Table 1). The two datasets differ in coverage and compilation, so their levels cannot be expected to coincide. Nevertheless, their broad movements should be reasonably comparable if they are capturing the same underlying expansion of corporate R&D.
Table 1: Comparison of Official Business Enterprise Expenditure on R&D and CMIE R&D Expenditure
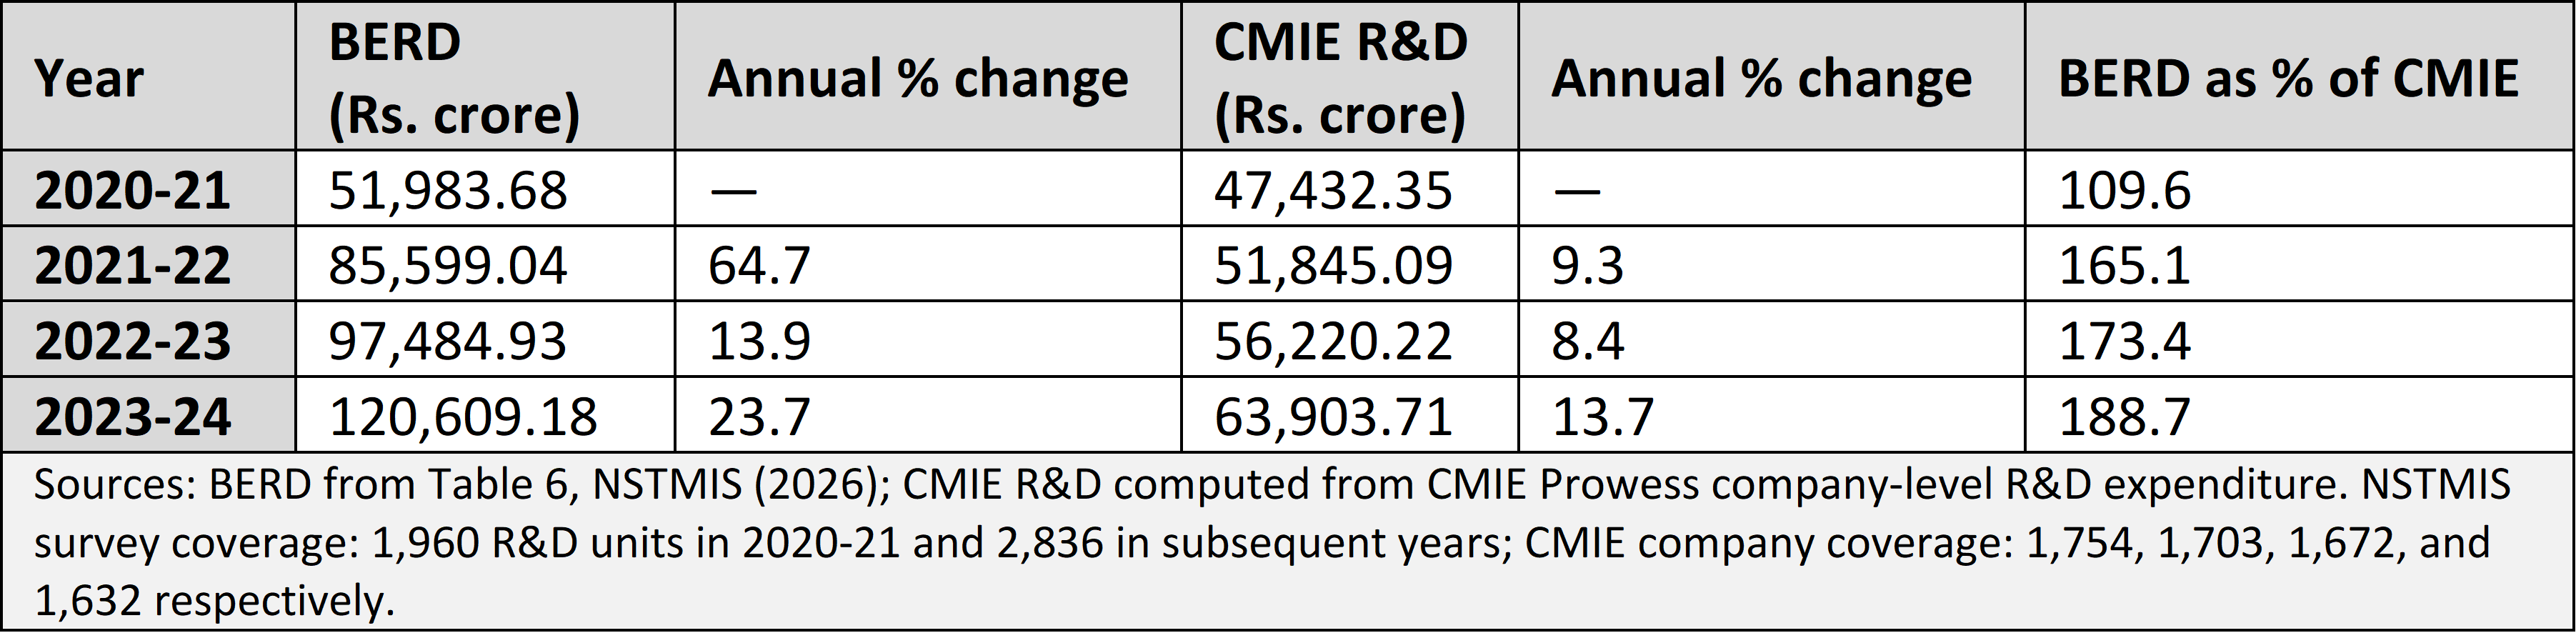
Both series show an increase in business R&D, but the magnitude differs substantially. The NSTMIS reports a 64.7% increase between 2020-21 and 2021-22, whereas the CMIE series increases by only 9.3%. The divergence persists thereafter. The NSTMIS BERD rises to Rs. 97,485 crore in 2022-23 and Rs.120,609 crore in 2023-24, while the CMIE R&D rises to Rs. 56,220 crore and Rs. 63,904 crore respectively. The ratio of official BERD to CMIE R&D therefore increases from 109.6% in 2020-21 to 188.7% in 2023-24.
The comparison does not imply that either dataset is necessarily incorrect. Rather, it suggests that two forces are operating simultaneously—genuine growth in corporate R&D and improved statistical coverage in the official series. The timing is particularly suggestive because the sharpest divergence appears immediately after the expansion of the NSTMIS survey frame and the increased use of secondary sources.
Also read: How Credible are India’s New Manufacturing GDP Estimates? by Jatinder S. Bedi and R. Nagaraj
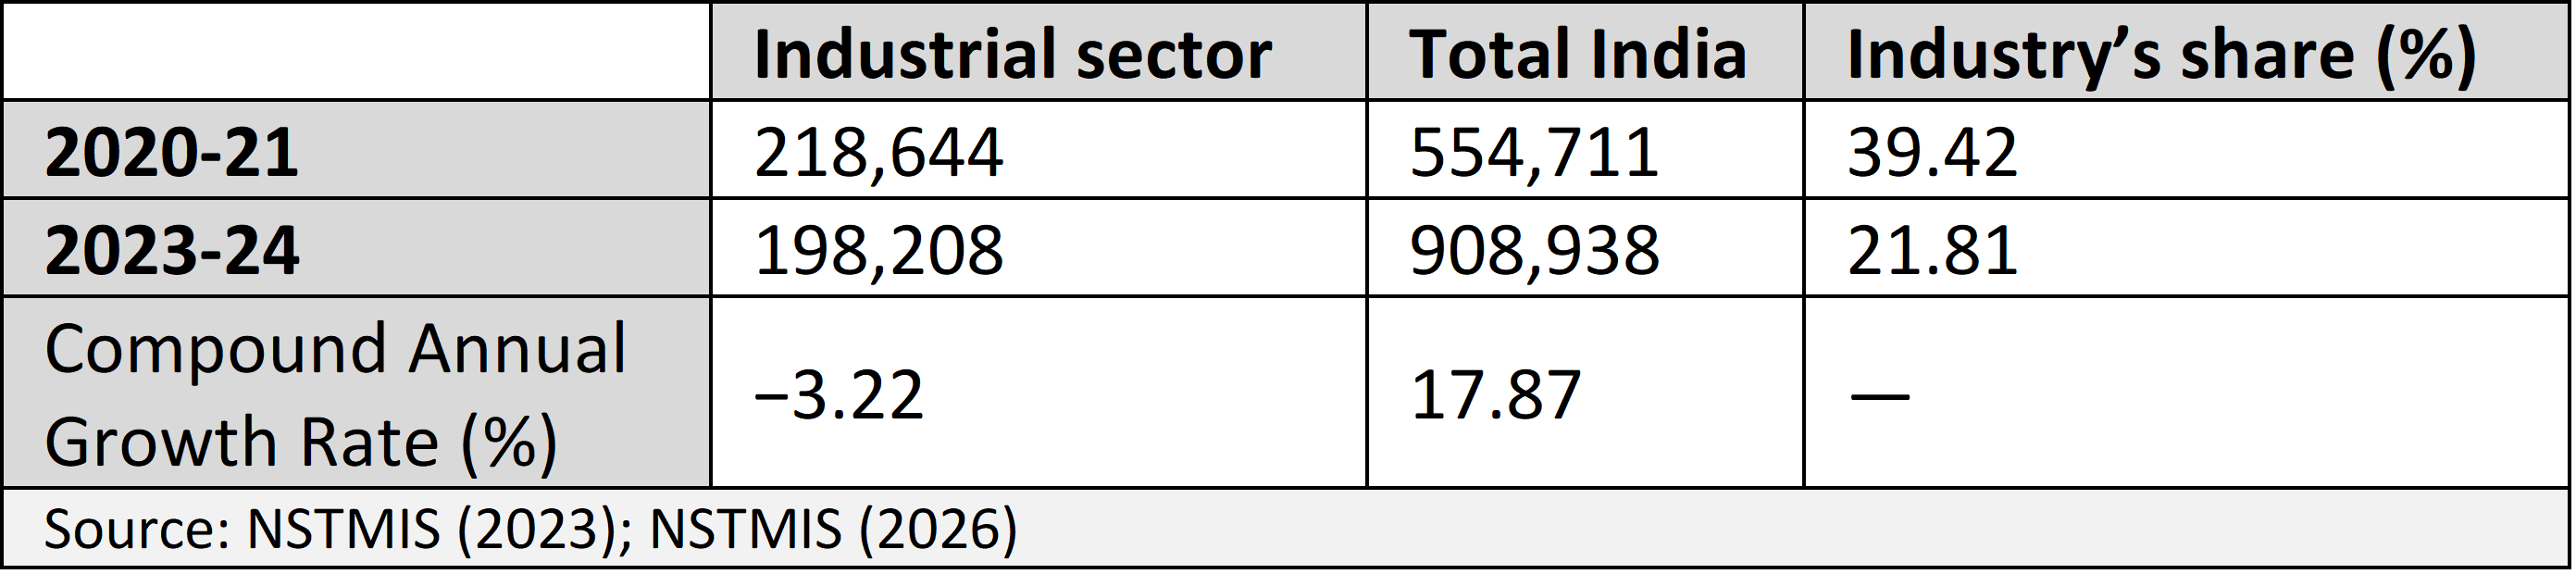
A second consistency check comes from R&D personnel. If the BERD nearly doubled because firms substantially expanded their research activity, one might expect the industrial R&D workforce to rise correspondingly. Instead, NSTMIS data show that industrial R&D personnel declined from 218,644 full-time-equivalent personnel in 2020-21 to 198,208 in 2023-24, a compound annual decline of 3.2% (Table 2). Over the same period, total R&D personnel in India increased from 554,711 to 908,938, or 17.9% annually. Industry’s share of total R&D personnel consequently fell from 39.4% to 21.8%.
Table 2: Industrial R&D Personnel vis-à-vis Total R&D Personnel in India (Full-Time Equivalent basis)
This does not prove that the BERD estimates are overstated. R&D expenditure can rise through higher salaries, more expensive equipment, software, laboratories, and other capital-intensive inputs. But a near doubling of business R&D alongside a shrinking industrial R&D workforce is difficult to reconcile with a simple story of an extraordinary expansion in the volume of corporate research.
Taken together, the CMIE comparison and the personnel data therefore support a cautious interpretation. Business R&D has increased, but the headline 64.7% rise also reflects improvements in statistical measurement.
4. Territorial Problem
A further issue concerns where R&D is performed. The Frascati Manual adopts a territorial principle—national BERD should measure R&D performed within the country’s territory. R&D undertaken by foreign subsidiaries of an Indian multinational should therefore be recorded in the country where that research takes place, rather than in India’s domestic BERD.
This distinction has become increasingly important as Indian firms have developed global innovation networks. The stock of India’s outward foreign direct investment rose from US$129 billion in 2013-14 to US$304 billion in 2025-26, and major Indian companies now operate engineering and research centres in Europe, North America and elsewhere (Reserve Bank of India 2026). Corporate financial statements quite properly report consolidated R&D expenditure, but national R&D statistics need to distinguish domestic from overseas activity.
Tata Motors illustrates the potential scale of the issue. In 2023-24, the company reported a consolidated R&D expenditure of Rs 29,380 crore. Its disclosures indicate that Rs 4,864 crore represented R&D performed in India, while approximately Rs 24,516 crore related primarily to overseas subsidiaries, notably Jaguar Land Rover. If the entire overseas component were excluded from the official 2023-24 BERD figure, the reported total would fall from Rs 120,609 crore to Rs 96,093 crore (Table 3).
Table 3: Tata Motors Illustration: 2023-24 BERD Adjustment
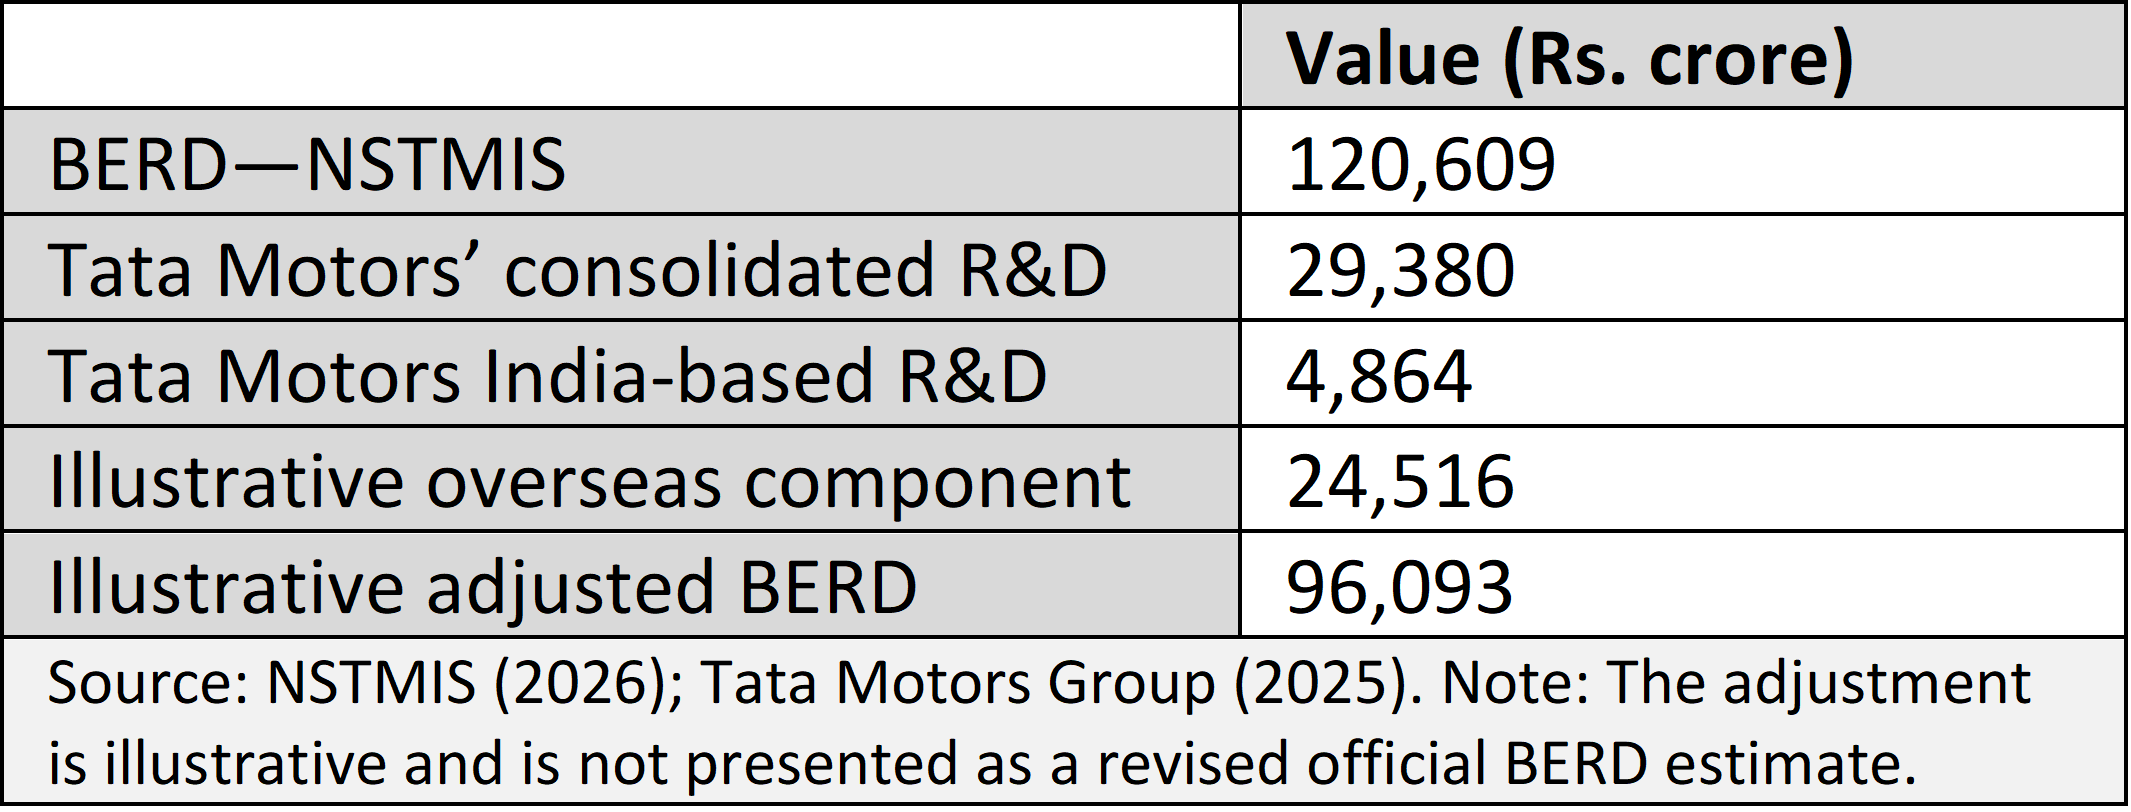
This calculation is not proposed as a revised BERD estimate. It illustrates the potential magnitude of the territorial issue. A proper adjustment would require equivalent information for all Indian multinational enterprises and for previous years. Firms with predominantly domestic R&D would require little adjustment, whereas firms with extensive overseas research networks could have a substantial effect on measured national BERD. The example points to the need for greater transparency about the geographical location of R&D undertaken by Indian multinationals.
The interpretation also has an important time-series implication. The unusually large 2021-22 increase should be treated as a potential break in the series rather than simply as an exceptionally high annual growth rate.
The subsequent increases in 2022-23 and 2023-24 show that the higher level of measured BERD was sustained. So, the argument is not that the post-2020-21 figures are entirely artificial. Rather, the evidence suggests that corporate R&D after the methodological change is higher because both actual expenditure and statistical coverage have changed. This distinction is important when comparing India with other countries or evaluating progress against national R&D targets.
Conclusion
The latest NSTMIS statistics indicate that Indian business enterprises have increased their commitment to R&D. The expansion is visible in both the official BERD series and independent company-level data, and it is consistent with the growing importance of technology-intensive activities such as electric mobility, pharmaceuticals, digital technologies, semiconductors, aerospace, and advanced manufacturing.
Together, these findings indicate that genuine growth and improved measurement are both contributing to the recent rise in official BERD.
The evidence nevertheless suggests that the headline 64.7% increase in BERD in 2021-22 should not be interpreted entirely as a change in corporate R&D behaviour. The NSTMIS survey expanded its coverage substantially and systematically incorporated administrative and company-level sources. These improvements are consistent with international statistical practice and should be regarded positively. They also mean, however, that part of the observed discontinuity reflects improved measurement of R&D that was already being undertaken.
The CMIE comparison reinforces this interpretation. While both sources show increasing corporate R&D, the CMIE records a much smaller increase in 2021-22. The decline in industrial R&D personnel despite the large increase in reported BERD provides a second internal consistency check. Together, these findings indicate that genuine growth and improved measurement are both contributing to the recent rise in official BERD.
The treatment of multinational enterprises raises a separate issue. National BERD should measure R&D performed within India, whereas consolidated corporate accounts may include substantial expenditure incurred by overseas subsidiaries. The Tata Motors example demonstrates how this can materially affect the level of measured BERD. The extent of any overall overstatement cannot be established without firm-level information from the statistical authorities, but the issue deserves explicit attention.
The appropriate response is not to question the credibility of India’s R&D statistics, but to make them more transparent and internationally comparable.
When methodological changes affect the comparability of a time series, the NSTMIS should clearly identify breaks, provide bridge information where feasible, and explain how multinational enterprises and overseas R&D are treated. Better measurement does not diminish India’s technological achievements; it makes claims about those achievements more credible and provides a stronger basis for industrial and innovation policy.
Sunil Mani (mani@cds.edu) is Visiting Professor, Centre for Development Studies, Thiruvananthapuram, and Ahmedabad University; Anurag Anand is an independent researcher.
Acknowledgement: We are grateful to R. Nagaraj for comments on an earlier draft. The usual disclaimer holds good. The views expressed are personal.