


Debates on income and wealth inequality in India have gained significant momentum over the past few weeks, in small part following the release of our study 'Income and Wealth Inequality in India, 1922-2023: The Rise of the Billionaire Raj' which revealed that economic disparities in India have reached historical highs (Bharti et al. 2024a). Public discussions that have followed have focused, amongst other things, on the lack of transparency of wealth statistics, on the types of policies fit to deal with rising inequality, and on the specific nature of the Indian context, where income and wealth inequality are closely intertwined with caste injustices.
In this brief follow-up note, we discuss the relevance and robustness of our results in the context of shortages of official economic statistics. Mobilising our novel estimates, we provide concrete wealth tax and redistribution proposals to curb extreme inequality in India and create valuable fiscal space for ramping up crucial social sector investments. Lastly, we show that such redistributive proposals would essentially entail support to the poor, lower castes, and middle classes, to the detriment of very few ultra-wealthy upper caste families.
Unprecedented inequality
Combining income tax tabulations, survey data (consumption, income, and wealth), national accounts, and rich lists in a consistent framework, we construct long-run income and wealth inequality estimates for India. In our study, incomes refer to annual flows earned from individuals’ labour or flows generated by capital they own (e.g. rent, dividends, interests or retained earnings). These are measured before income taxes, i.e. pre-tax incomes. Wealth refers to stocks, that is the market value of assets owned by individuals (such as housing, equity or directly owned businesses) net of any debt. We briefly summarise our methodological approach here and direct readers interested in further details to the full paper.
For the income series, given that income and consumption surveys do not capture the rich very well, we supplement them with tax tabulations published by the income tax authorities. 1There are numerous reasons for the non-coverage of the rich and wealthy in surveys. Besides the fact that the rich are often more likely to refuse to respond to such surveys (‘differential non-response’), usual surveys most often fail to include the ultra-rich in their samples simply owing to their miniscule numbers. Consequently, inequality estimates generated from survey data alone – a common practice in the Indian context - are likely to severely underestimate the true extent of economic disparities. Despite certain inherent issues with tax data (eg. compliance or non-taxable components), it proves to be the most reliable source to study incomes of the rich. The availability of tax tabulations going all the way back to 1922 (when the British administration passed the Income Tax Act) allows us to shed light on the dynamics of very top incomes (top 1%) over an entire century. Given strong growth of tax filing in recent decades, the tax data now covers nearly 10% of adults in recent years.
For the rest of the distribution, we rely on consumption expenditure surveys that have been conducted at regular intervals by the National Sample Survey Organization (NSSO). To move from a consumption distribution to an income distribution, we construct a mapping between them based on data from two rounds of the India Human Development Survey (IHDS).
On the other hand, our wealth series begins in 1961 when the NSSO began conducting the All-India Debt and Investment Survey (AIDIS) tracking household assets and liabilities. Much like the income series, and for the very same reasons, we top-correct AIDIS using Forbes billionaire lists. Published annually by the Forbes magazine, these lists track all individuals with net wealth exceeding $1 billion at market exchange rates. In the absense of any administrative data, such rich lists (see also the one published by Hurun since 2012) have turned out to be a valuable source of information on the net worth of the wealthiest Indians.
How do we use this Forbes data? We first fit a Pareto distribution to the billionaire list and then use the estimated tail parameter to estimate wealth for the top 0.5% of the distribution (top 0.1% in earlier years). 2The ‘tail parameter’ in a Pareto distribution can be thought of as capturing the extent of inequality. Given the power law property of such distributions, we can use the tail parameter to estimate the full distribution after a certain threshold, 99.5% in our case. Note that till 2017, we only top-correct AIDIS for the top 0.1%. However, owing to the growing non-coverage of the very wealthy in AIDIS, we reduced the threshold a little to the top 0.5% from 2018 (latest AIDIS) onwards. In effect, we assume that the bottom 99.5% of the distribution is well represented by the AIDIS.
As we highlight in our paper, this is most likely a conservative assumption as the AIDIS has been performing worse over time in terms of capturing the very wealthy, consistent with the results in Anand and Kumar (2023). Nevertheless, given the limited coverage of the Forbes billionaire lists, we restrict ourselves to only correcting the AIDIS for the top 0.5% of the wealth distribution in recent years.
The total wealth of the top 0.001% (less than 10,000 persons) is nearly 3 times the total wealth held by the entire bottom 50% (46 crore individuals). Please pause, if need be, to let that sink in.
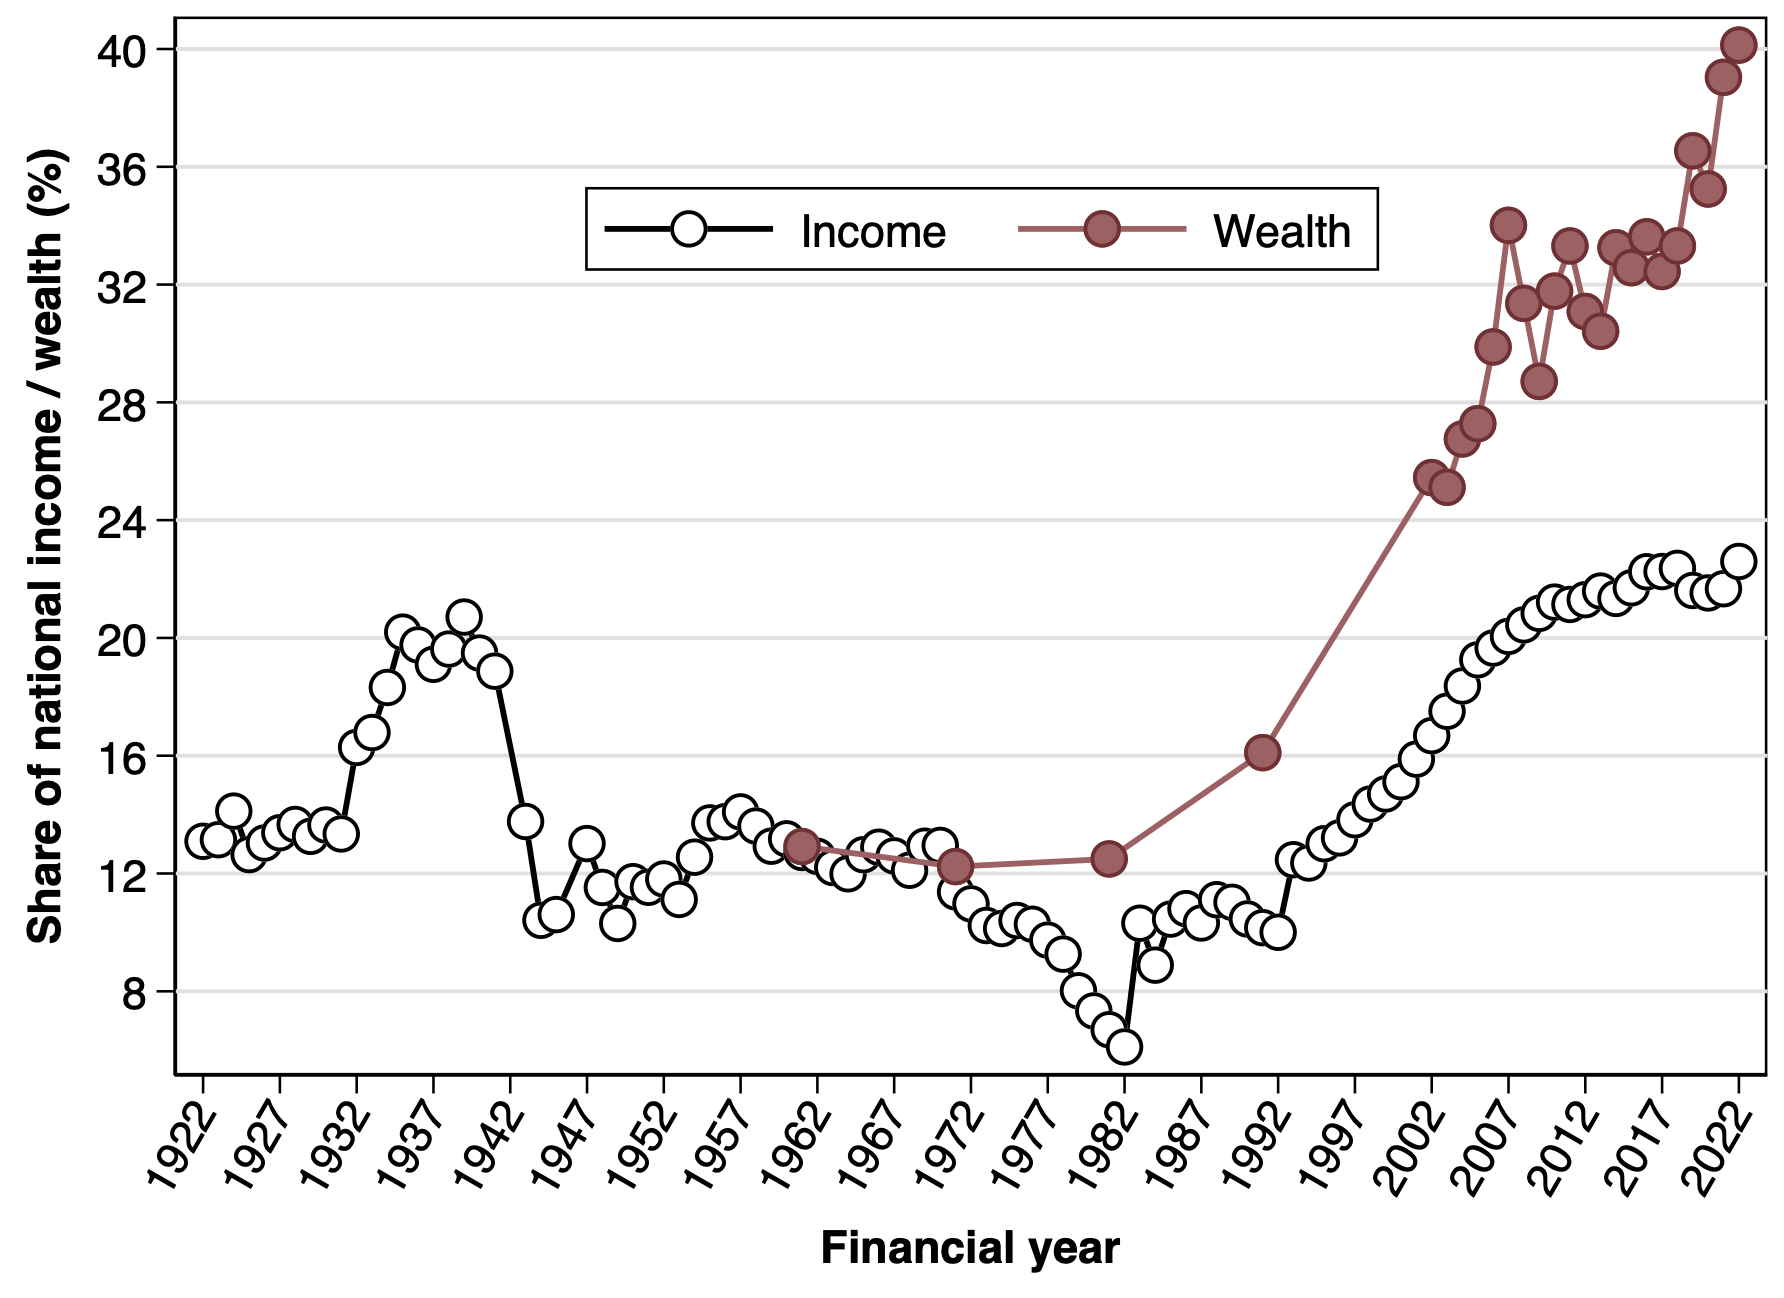
What do we find? Overall, income and wealth inequality declined post-Independence, began rising in the 1980s and has skyrocketed since the 2000s. Between 2014–15 and 2022–23, the rise of top-end inequality has been particularly pronounced in terms of wealth concentration (see Figure 1). India’s top 1% income and wealth shares are now at their highest historical levels.
More precisely, the top 1% control over 40% of total wealth in India, up from 12.5% in 1980. The top 1% income earners made 22.6% of total pre-tax income, up from 7.3% in 1980. This spectacular rise of inequality makes the Billionaire Raj headed by India’s modern bourgeoisie more unequal than the British Raj headed by the colonialist forces. It also squarely places India amongst the most unequal countries in the world.
Figure 1: The rise of extreme inequality: Top 1% shares
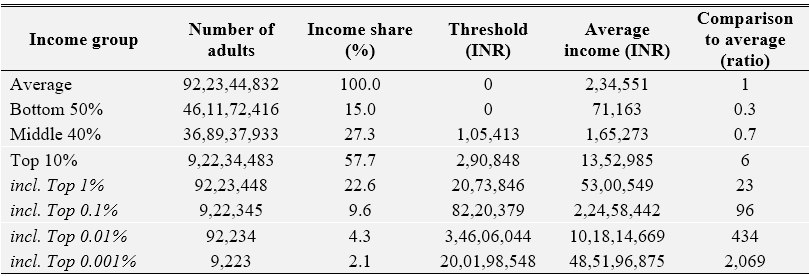
According to our latest estimates, it takes just Rs 2.9 lakhs per year to make it to the top 10% of income earners and Rs 20.7 lakhs to make it to the top 1%. By contrast, the median adult earns only around Rs 1 lakh a year, while the poorest of the poor have virtually no incomes. The bottom half of the distribution (50% of adults) earns only 15% of the total national income (see Table 1).
To get a sense of just how skewed the income distribution is, one would have to be very close to the 90th percentile to earn the average income.
Table 1: Income inequality in India, 2022-23
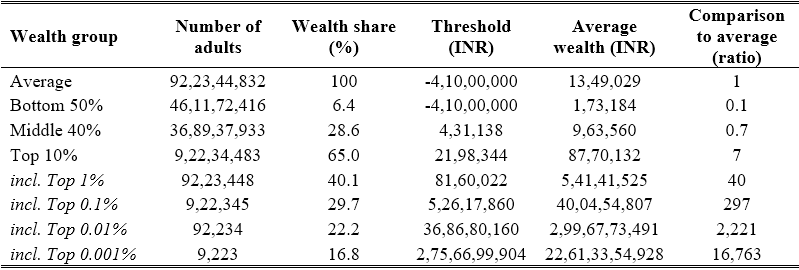
Looking at wealth, we find that an adult needs to own Rs 21 lakhs to belong to the wealthiest 10% and Rs 82 lakhs to break into the top 1%. The median adult holds about Rs 4.3 lakh worth of wealth. A significant share of adults owns close to no wealth at all. The bottom 50% of the population owns only 6.4% of the total wealth (see Table 2).
On the other hand, we observe extreme concentration at the very top with shockingly high wealth shares. The top 1% own 40% of the total wealth, the top 0.1% hold 30%, the top 0.01% own 22%, and finally the top 0.001% alone control a whopping 17%. The average net wealth amongst the top 0.001% exceeds Rs. 2 thousand crores.
As a result, the total wealth of the top 0.001% (less than 10,000 persons) is nearly 3 times the total wealth held by the entire bottom 50% (46 crore individuals). Please pause, if need be, to let that sink in.
Table 2: Wealth inequality in India, 2022-23
Inequality denial in action
In Bharti et al. (2024a), we repeatedly stress that our estimates should be interpreted with care given the current lack of good quality economic statistics in India, especially for the last decade. At the same time, we argue that our method combines the best available data sources in a consistent framework to capture long-run trends of economic inequality in India. Moreover, our benchmark estimates are plausibly conservative in the sense that we might be underestimating the true extent of income and wealth concentration in recent years.
For instance, we are unable to account for offshore wealth when estimating the wealth distribution. We know, however, that over 1% of India’s GDP worth of wealth is parked as offshore assets by Indians in Dubai alone (Alstadsæter et al., 2024). Further, Indians account for over 20% of all foreign-owned real estate in Dubai (Alstadsæter et al., 2022). These strongly indicate that we are likely under-estimating wealth at the very top of the distribution.
Given that the quality of economic statistics in India is not great, there is no doubt our inequality series can be improved upon with better and more transparent data.
A handful of commentators, many with close links to the current government, have criticised these findings in the media. 3Among others, see Bhalla and Bhasin (2024) and Nageswaran and Bisht (2024) for the shrillest critiques. A more recent and intriguing criticism levelled against us is that, by highlighting that income inequality in contemporary India is worse than under the British colonial Raj, we are in effect “whitewashing colonial cruelties” (Singh 2024). We stress once again that political power, poverty, and economic inequality are connected although separate challenges. We direct readers to in-depth work by some of us on these important matters (Piketty 2019). We have already dealt with these criticisms in detail arguing that they amount to nothing more than a broader strategy of “inequality denialism” (Bharti et al. 2024b). More precisely, after carefully reviewing these articles, we found little constructive criticism but plenty of misrepresentation and misunderstanding. The authors pick one element irrelevant to our inequality estimates and use it out-of-context to cast doubt over our general results which are hard to discredit.
The objective of these criticisms is clear: deflect and avoid a much-needed debate on the ballooning inequality crisis and policies suited to tackle it.
Nonetheless, given that the quality of economic statistics in India is not great, there is no doubt our inequality series can be improved upon with better and more transparent data. In that regard, proposals aimed at carefully measuring economic and social inequalities, for example via a socio-economic caste census, are welcome steps in the right direction. In the meantime, however, we think our estimates can already provide a reliable basis for informed discussions about fair taxation and redistribution in India.
Progressive wealth tax
Global historical evidence suggests that the wealthy usually manage to earn significantly higher returns on their capital stocks than the growth rate of the economy (Piketty 2014; Piketty and Zucman 2014; Jordà et al. 2019). Under a broad class of economic models, if left unchecked, such dynamics lead to greater concentration of wealth (Benhabib and Bisin 2018). Worryingly, we find exactly these dynamics playing out in India. Between 2014 and 2022, growth rates at the very top of the distribution – the top 0.1%, top 0.01%, and beyond – far outstripped growth in the middle and bottom of the distribution (Bharti et al. 2024a, Figure 17b).
The magnitude of potential revenues from [... our] proposals is phenomenally large despite taxing only 0.04% of the adults, that is, leaving 99.96% of the population unaffected by the tax.
To fight these growing inequalities and create fiscal space for crucial social sector investments, we propose a tax justice package comprising of an annual wealth tax and an inheritance tax. Much has been written about the possible pros and cons of such taxes and the debate must continue. Given the extreme concentration of wealth at the very top, coupled with deeply rooted caste inequities, we believe such policies would be an important step towards a more equitable growth path for India. 4Among others, see Drèze (2024), Ghosh (2024), Moharir and Narayanan (2024), and Ramakumar (2024) for a spirited defence of such proposals.
The two components of the package are meant to be complementary to each other. An inheritance tax would directly tackle the unfair advantage that unearned dynastic wealth renders to individuals solely based on the accident of birth. This is only exacerbated by the caste system. An inheritance tax, however, only comes into force when wealth is bequeathed (i.e. upon the death of the dynast) and hence delivers relatively small tax revenues on an annual basis. On the other hand, a small wealth tax would deliver significant annual revenues (given the larger base) while also dampening accumulation at the very top.
A “crorepati” tax justice plan
At the outset, we emphasise that our proposals involve taxing only the very wealthy. We recommend that these taxes kick-in only for those with net wealth exceeding Rs 10 crore in 2022–23. Based on our latest estimates (Table 2), only the top 0.04% of adults would fall above this threshold.
Table 3 presents a summary of three possible variants of a tax justice package, that we refer to as the ‘baseline’, ‘moderate’, and ‘ambitious’ variants.
Table 3: Proposals for tax justice packages
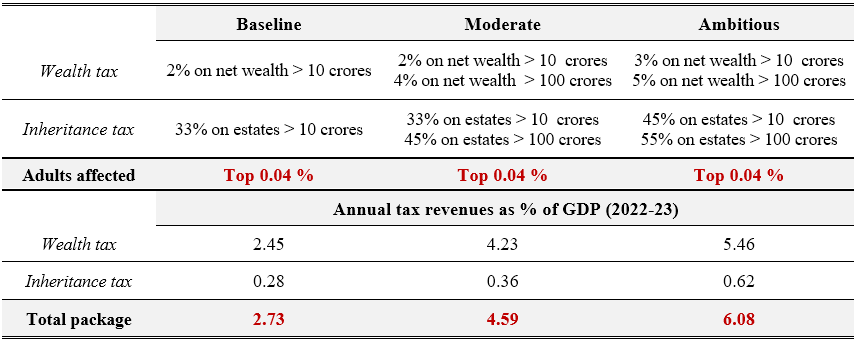
In the baseline variant, we propose a 2% annual tax on net wealth exceeding Rs 10 crore and a 33% inheritance tax on estates exceeding Rs 10 crore in valuation. As per our estimates, this alone would generate a massive 2.73% of gross domestic product (GDP) in revenues.
Under the moderate and ambitious variants, we introduce further progressivity in the tax schedules along with increase in tax rates. In the moderate variant, for instance, we propose increasing the wealth tax to 4% from 2% for those with wealth exceeding Rs 100 crores. This would be coupled with a 33% inheritance tax on estates between Rs 10 and 100 crore and a 45% tax on estates exceeding Rs 100 crores. This package would yield 4.6% of GDP in annual tax revenues.
Under the ambitious package, with identical thresholds but higher tax rates (3%–5% for wealth tax and 45%–55% for inheritances), tax revenues could be as large as 6.1% of GDP.
We strongly believe the exact specifics of such a tax package – exemption thresholds, degree of progressivity, tax rates, inflation indexation, etc. – should emerge from a broader democratic debate.
The magnitude of potential revenues from such proposals is phenomenally large despite taxing only 0.04% of the adults, that is, leaving 99.96% of the population unaffected by the tax. What makes this possible? The extreme concentration of wealth at the very top. The top 0.04% alone (i.e. roughly those with net wealth exceeding Rs 10 crore) hold over a quarter of the total wealth. Their total wealth amounts to a whopping 125% of India’s GDP. In other words, the total wealth of the top 0.04% is 25% larger than India’s entire economy.
It is then no surprise that a flat 2% wealth tax on just the top 0.04%, as in the baseline variant, could alone yield nearly 2.5% of GDP in revenues. While we stress that these numbers should be interpreted with care, the orders of magnitude are likely to be largely robust. 5These estimates assume that such taxes would have relatively muted effects on reporting and migration. Recent credible evidence from the Scandinavian context suggests “… a one percentage point increase in the average wealth tax rate on the top 2% decreases the stock of wealthy taxpayers by at most 2% in the long run, and lead to a reduction of at most .03% in aggregate employment and at most .1% in aggregate value- added. Hence, our results suggest that trickle-down effects of tax-induced migration by the wealthy do exist, but that they are quantitatively small” (Jakobsen et al. 2024). It of course remains to be seen whether these results apply fully to the Indian context.
At this point it is worth clarifying that we strongly believe the exact specifics of such a tax package – exemption thresholds, degree of progressivity, tax rates, inflation indexation, etc. – should emerge from a broader democratic debate. By illustrating the broad design contours and the quantum of potential revenues, our proposals are meant to provide a concrete basis for further discussion and debate on tax justice and wealth redistribution in India.
Fiscal space for welfare spends
While progressive wealth taxation should be an important part of the fight against extreme inequality, it is not going to be enough. It must be accompanied by explicit redistributive policies. Besides more direct measures like cash transfers to the poor, this could take the form of increased investment in health, education, and other social sector spending.
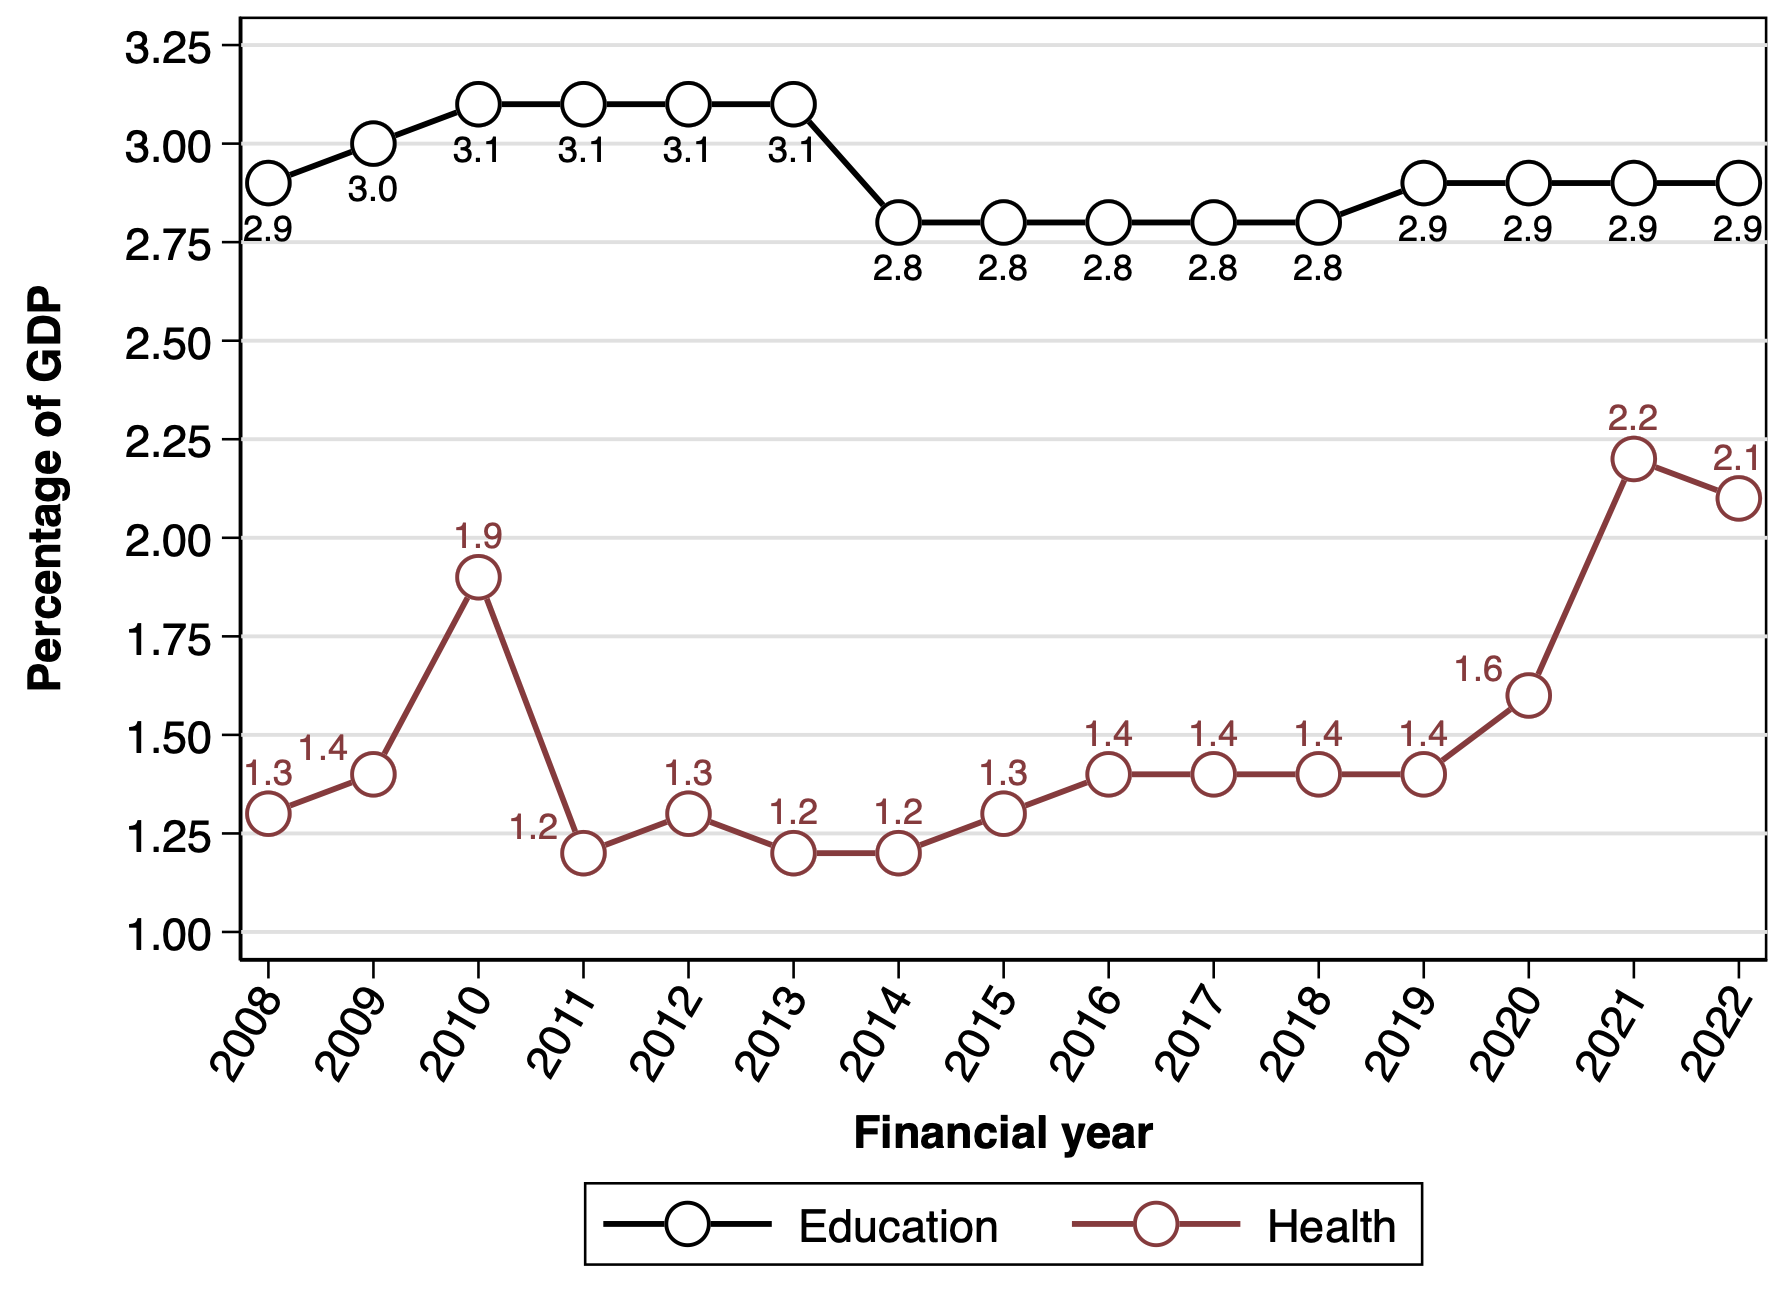
Between 2008 and 2019, the total government expenditure (centre and states) on health as a percentage of GDP remained stagnant around 1.4% of GDP, after which it saw a slight up-tick in the aftermath of the Covid-19 pandemic (Figure 2). Education expenditures have stagnated at 2.9% for the last 15 years. Moreover, it appears that only a minority of this education expenditure is borne by the central government (Centre for Budget Governance and Accountability 2024). These levels are far below – less than half – the 6% target laid out in the government’s own New Education Policy 2020 (NEP).
Figure 2: Central & State government expenditures on health & education
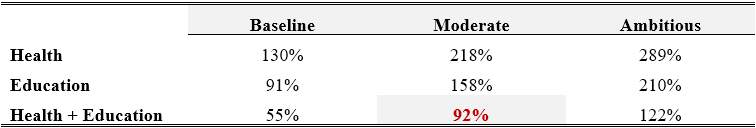
If the average Indian is to truly benefit from the ongoing wave of hyperglobalisation, there is an urgent need to ramp up broad-based investments in health, education, and nutrition that benefit the masses and not just the elites. Combining our estimates of potential tax revenues with estimates of government expenditures, we find that wealth tax packages of the kind proposed here would create significant fiscal space to expand social sector expenditure (see Table 4).
For instance, the baseline variant alone would allow nearly doubling the current public education expenditure, while the moderate variant would allow nearly doubling the combined health and education budget (or more than triple the health expenditure alone). The ambitious variant would allow doubling the government’s combined budget on health and education and still leave plenty extra. As should be evident from these estimates, the magnitudes of potential tax revenues are truly quite large while those affected by the taxes are truly quite few (top 0.04% only).
Table 4. Tax revenues as percentage of key public expenditures, 2022-23
Wealth inequality, caste, and redistribution
An undeniably unique feature of economic inequalities in India is that they are closely intertwined with the deeply rooted caste system. Yet, even after 75 years of India’s independence, we do not have a carefully quantified understanding of the interplay between economic and caste inequities. In such a context, we try to shed some light on this crucial issue using the available data sources currently at hand.
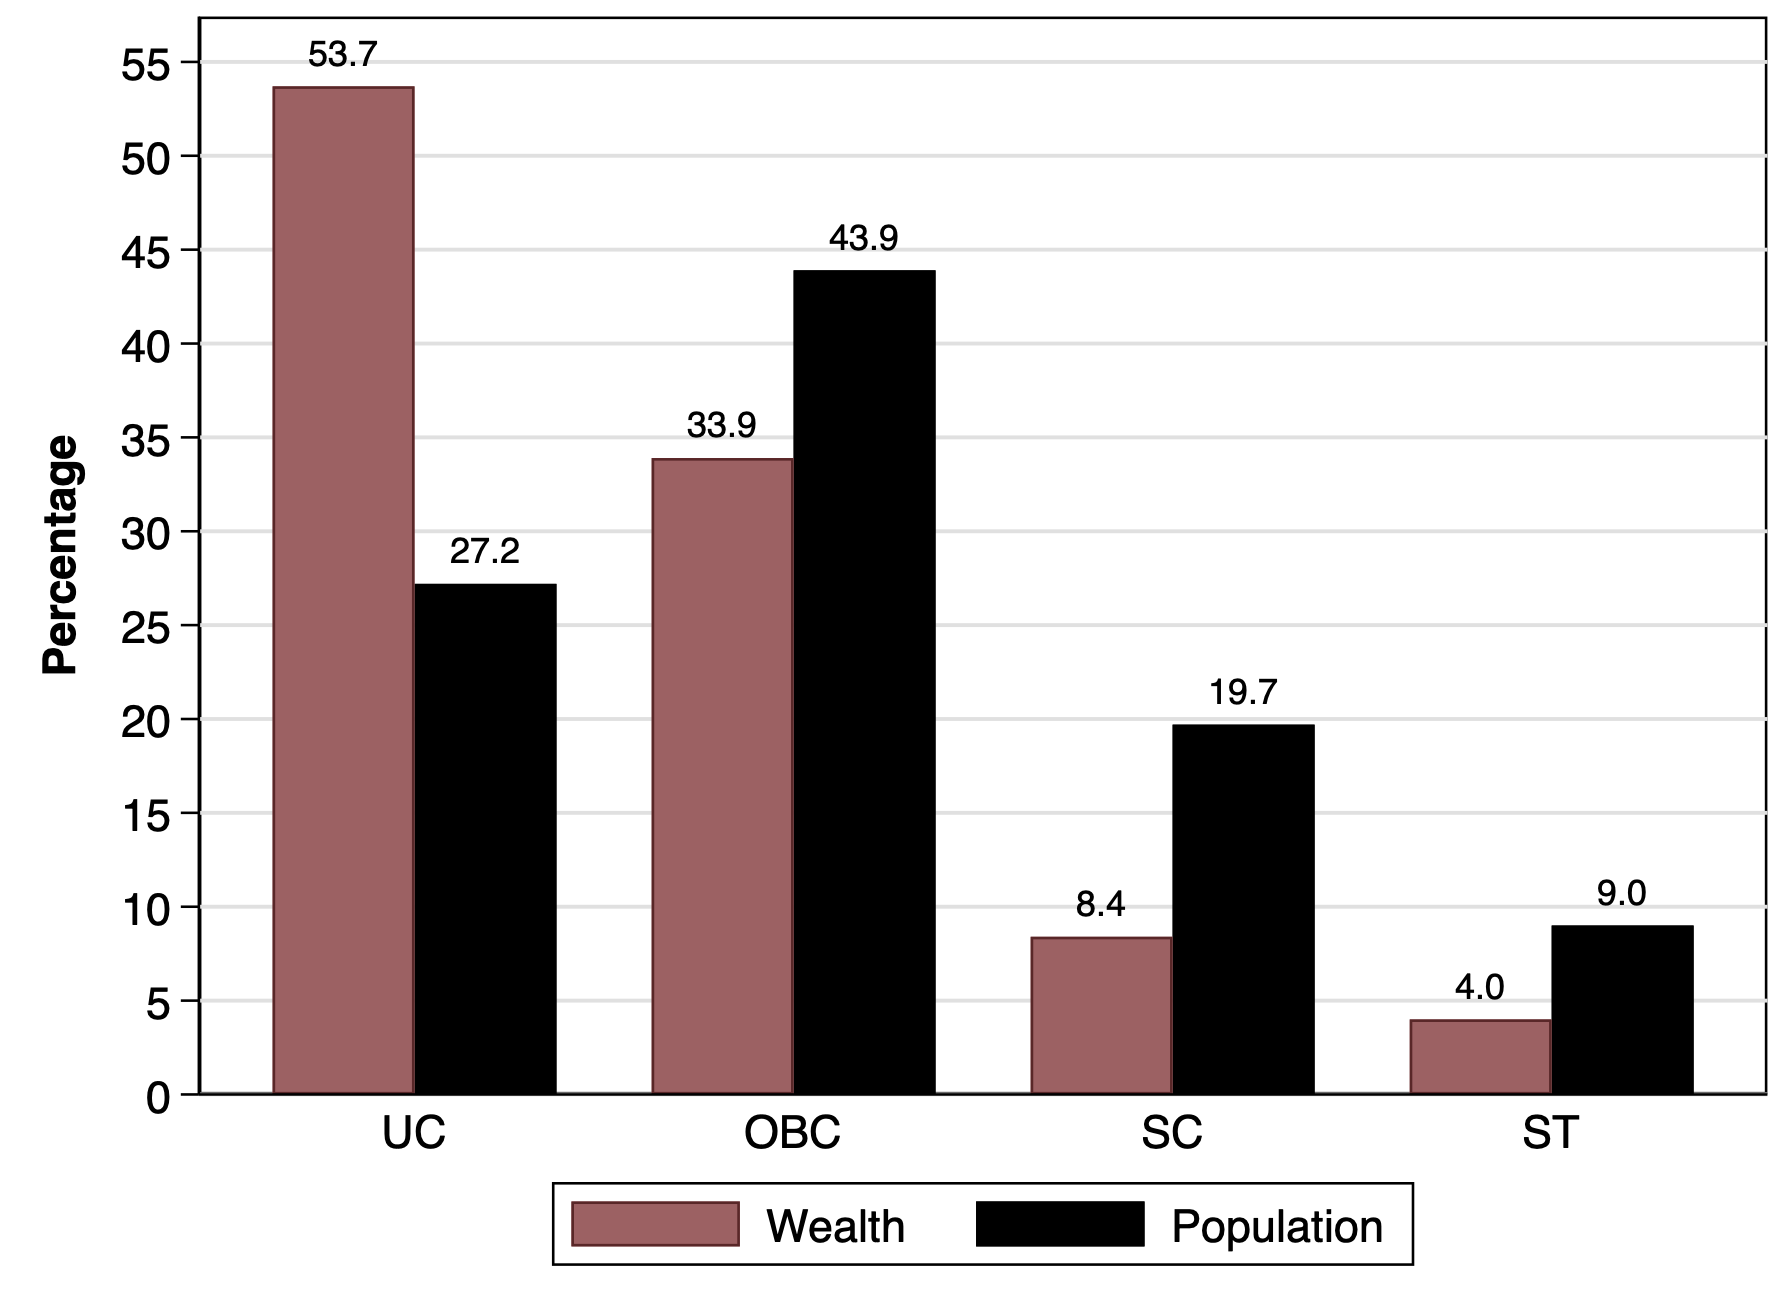
Compared to a population share of just over 25%, upper castes own nearly 55% of national wealth – the only caste group whose wealth share exceeds its population share.
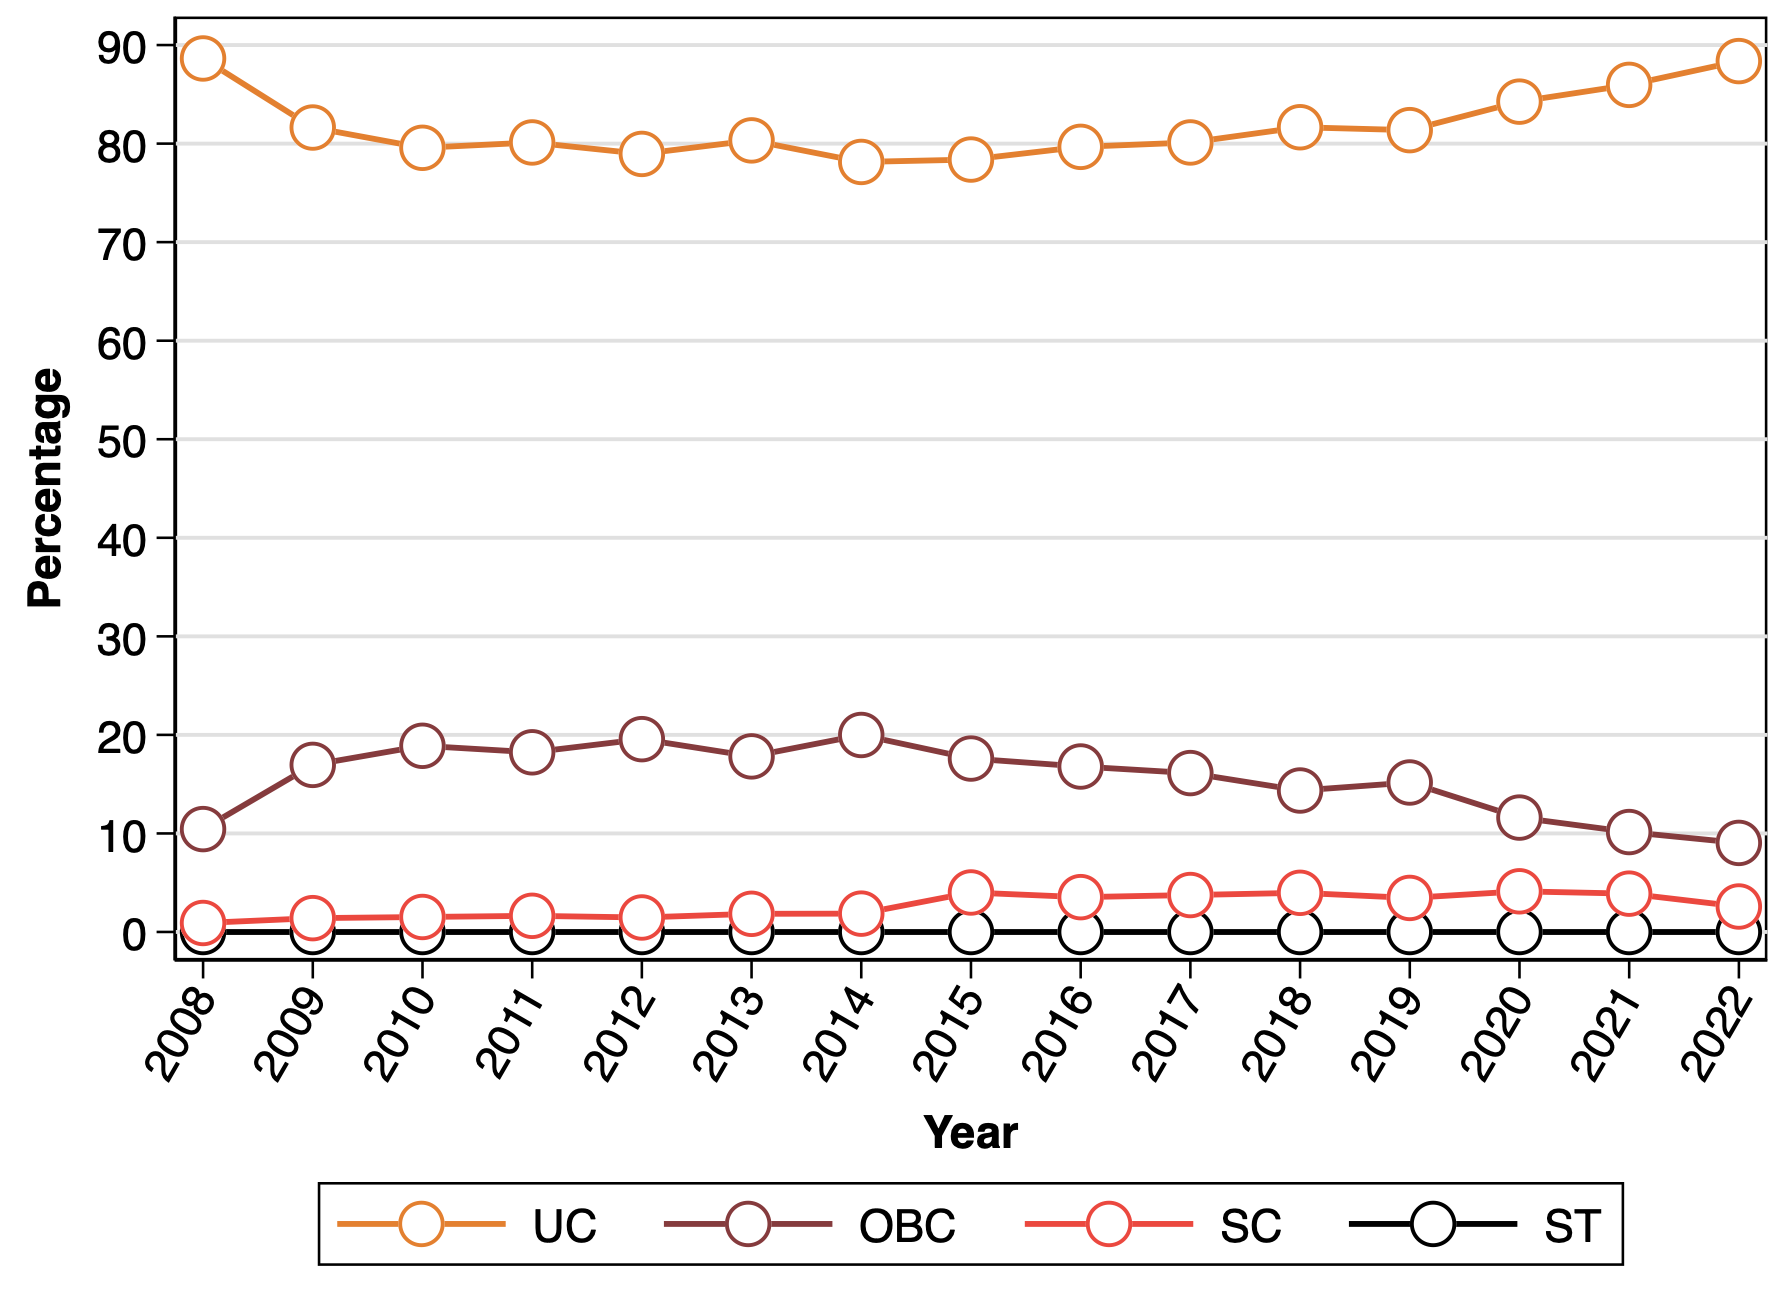
To begin with, we code the surnames appearing in the Forbes billionaire rankings into four major caste categories: scheduled caste (SC), scheduled tribe (ST), other backward classes (OBC), and upper castes (UC). 6The Forbes billionaire rankings track all individuals with net wealth exceeding USD 1 billion at market exchange rate. We first manually coded the surnames appearing in the Forbes list using publicly available information sources like government notifications, news reports, etc. For some cases where ambiguity remained, we relied on the ‘outkast’ algorithm which relies on data from the 2011-12 Socio-Economic Caste Census to assign caste probabilities. We find that a large chunk - nearly 90% - of the billionaire wealth in 2022–23 is held by upper castes (Figure 3). At the other end of the spectrum, scheduled tribes find absolutely no representation amongst the wealthiest Indians. Other backward classes own only about 10% of the billionaire wealth while scheduled castes only a meagre 2.6%.
Not surprisingly, this suggests that upper castes are significantly over-represented amongst the ultra-wealthy. Interestingly, during the Modi years between 2014 and 2022, the OBC share in billionaire wealth fell to below 10% from 20% while the upper caste share rose to 90% from 80%.
Figure 3: Caste-wise share of total wealth in Forbes billionaire rankings
Next, we combine the caste-coded Forbes billionaire data with the All-India Debt and Investment Survey (AIDIS) for the year 2018–19 (the latest year for which AIDIS is available). This allows us to estimate the full distribution of wealth and allocate it across the four major caste groups.
Compared with a population share of just over 25%, upper castes own nearly 55% of national wealth – the only caste group whose wealth share exceeds its population share (Figure 4). On the other hand, the wealth share of schedule castes and scheduled tribes is well below half their respective population shares. OBCs hold just under 35% of national wealth, about three-quarters of their population share.
Figure 4: Caste-wise share of national wealth and population, 2018-19
All in all, Figures 3 and 4 suggest that upper castes hold a significantly disproportionate share of national wealth, and that Indian billionaires are largely an upper caste club. This suggests that a progressive wealth tax package of the kind we propose is most likely to benefit lower castes and the middle classes at the detriment of only a tiny number of ultra-wealthy upper caste families. In that respect, besides addressing extreme wealth inequality, such taxes could also play a small role in weakening the rigid link between social and economic inequalities in India.
Conclusions
As per our benchmark estimates, India’s top 1% income and wealth shares (22.6% and 40.1%) are at their highest historical levels on record, making the Billionaire Raj more unequal than the British Raj and squarely placing India amongst the most unequal countries in the world.
There are various reasons to be opposed with such extreme concentration of economic resources.
From a purely instrumental perspective, income inequality could even negatively affect medium and long-term growth prospects by dampening demand amongst the poor and middle-class. Widening disparities could also provide fertile ground for political and social unrest. Moreover, extreme concentration of resources is likely to facilitate disproportionate influence on government and society. Lastly, from an ethical and moral standpoint, is it just for a society to let the top 1% amass 40% of national wealth while child malnutrition remains a pressing concern?
In this short article, we have put forward a basic tax justice plan as way to fight the extreme economic inequalities and create fiscal space for enhanced social sector investments. Our proposals consist of an annual wealth tax and an inheritance tax, both applying only above a very high exemption threshold of wealth of Rs 10 crores in 2022–23. Based on our latest inequality estimates, we show that such a tax package, with low to moderate tax rates and progressivity, could earn anything between 2.5%–5% of the GDP. These revenues could potentially be large enough to nearly double the combined public education and public health budgets, areas where India has invested too little compared to global standards.
Finally, by caste-coding the Forbes billionaire lists and combining it with AIDIS, we show that such a tax package would effectively support the poor and lower and middle castes to the detriment of only a tiny fraction (top 0.04%) of largely ultra-wealthy upper caste households.
From an ethical and moral standpoint, is it just for a society to let the top 1% amass 40% of national wealth while child malnutrition remains a pressing concern?
To those willing to objectively engage with reality, India’s vulgar inequalities are staring back at us from all directions. The 2024 Lok Sabha election has presented itself as a unique moment when both the political elite and the electorate have actively engaged with these crucial issues.
Despite sustained attempts from certain sections to derail this much needed conversation, a vibrant public debate has nonetheless emerged. It would, however, be a shame if after coming this far, this momentum is not translated into policy. Progressive wealth taxation, effective redistribution, and broad-based social sector investments are going to be crucial for an equitable and prosperous India.
Nitin Kumar Bharti is at New York University, Abu Dhabi. Lucas Chancel is at Harvard Kennedy School and Sciences Po, Paris. Thomas Piketty is at EHESS and Paris School of Economics. Anmol Somanchi is at the Paris School of Economics. All authors are also affiliated to the World Inequality Lab.
The authors are grateful to Aashish Gupta for clarifications regarding mortality rates, Resuf Ahmed for support with the ‘outkast’ algorithm, and Ravi for assistance in manual coding of caste surnames using publicly available sources.
This article is being simultaneously published with the Economic and Political Weekly.


