
Air pollution is widely reported in North Indian cities such as Delhi, but pollution is also a growing concern in southern cities, including Bengaluru. Reliable monitoring is the first step in addressing the problem. However, the density of air quality monitoring stations in Indian cities remains low compared with international standards.
The three main sources for air pollution data are public monitoring stations that are maintained by the government, private organisations that collect data for mobile apps like IQAir and AQI, and data collected by individuals not associated with any organisation.
The official source for air pollution data is from public monitoring stations maintained by the Central Pollution Control Board (CPCB) and state pollution control boards. Bengaluru, a city spread over 720 square kilometres, has just 12 monitoring stations—one for every 60 sq km. These large gaps in coverage make it hard to measure how pollutant concentrations vary at a local level.
New Delhi with an area about twice the area of Bengaluru collects data from 50 monitoring stations. A study in 2019 compared the low density of air quality monitors per million in India with the ratio in other countries and supported the use of measurements from low-cost sensors to supplement the data from public monitoring stations. Another study recommended at least 41 air quality monitoring stations in Bengaluru. The results of satellite data are useful to detect annual trends in pollution levels but are not a substitute for ground monitoring stations.
One solution is to supplement the data collected by the central and state pollution boards with data from portable air quality monitors owned by citizens.
Accurate data collection and analysis is the first and critical step in solving the air pollution problem. A 2018 study of air pollution in Bengaluru cited the lack of reliable and sufficient monitoring stations as a deterrent to understanding the severity of the crisis.
Given the high cost of land acquisition in Bengaluru and the hardware for a monitoring station, it is unlikely that the density of monitors will increase to match the recommended density. One solution is to supplement the data collected by the central and state pollution boards with data from portable air quality monitors owned by citizens.
After proper calibration, the accuracy of some low-cost monitors can approach that of official monitoring stations for certain pollutants such as PM2.5. Tests of low-cost air quality monitors have shown that accuracy is not necessarily proportional to the cost of the monitor. Current air quality monitors range from industrial models costing Rs. 100,000 or more to portable models costing several thousand rupees.
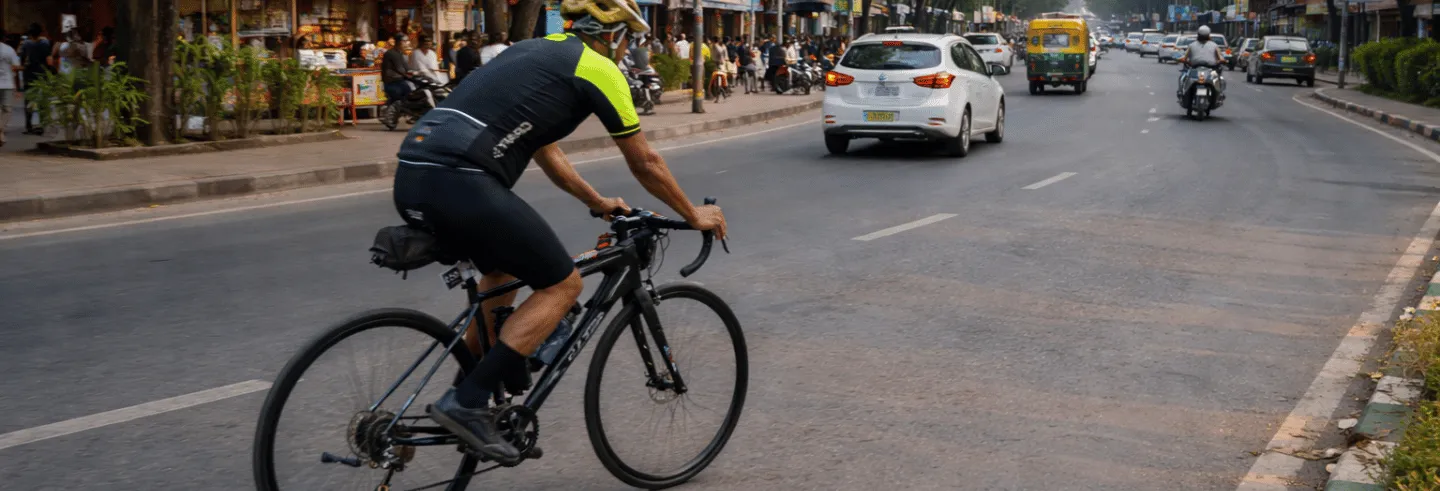
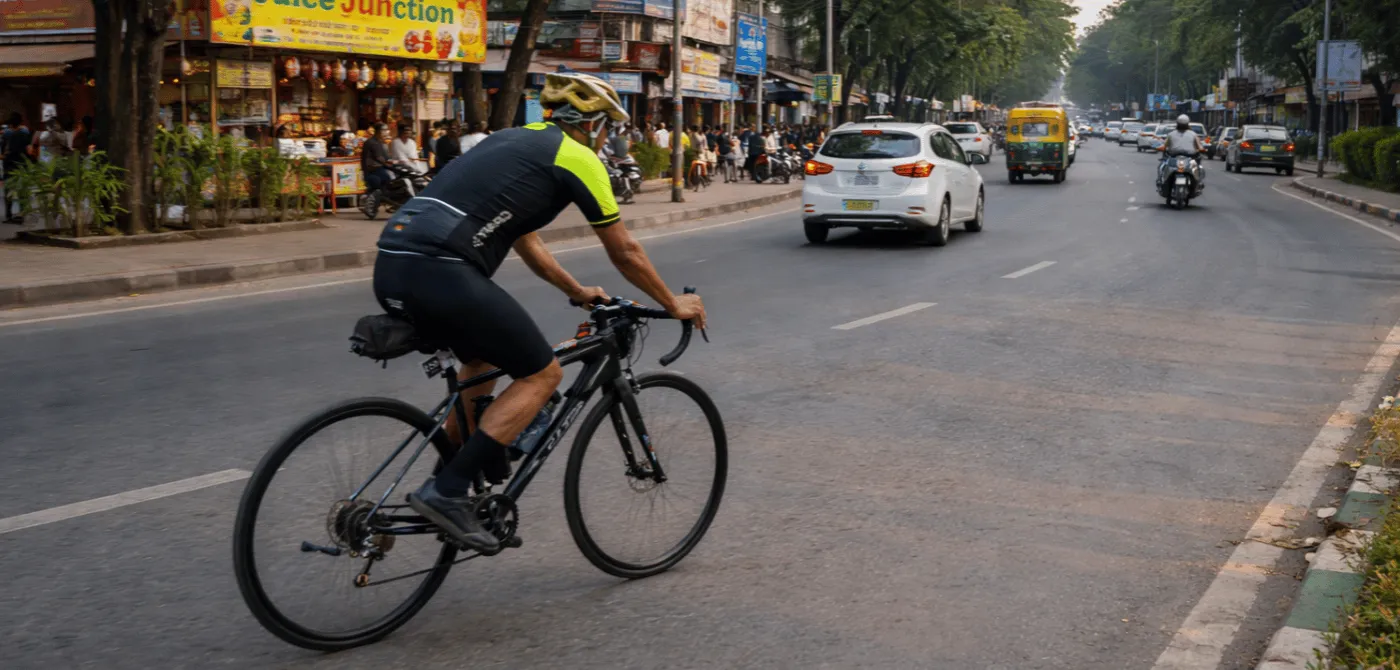
In this article, the measurements from a portable Temtop M2000 model with a reported accuracy of 80% were used to measure air pollution in Bengaluru city. The measurements were captured using a portable monitor mounted on a bicycle in January 2026.
Key Observations
The observations below from a Temtop monitor are likely to be of lower precision than the observations from a premium monitor at an official station. The collected data may also be sensitive to humidity and temperature. Despite issues with precision, data from low-cost and affordable sensors empower the average citizen to report the severity of air pollution at the local level. The results can be used to persuade the government to invest more in monitoring air pollution.
▶ The data collected from low-cost sensors offers a perspective of air pollution at the road level that is not available from the data collected at monitoring stations alone.
▶ The exposure to pollution on different routes to the same location depends on the route and some routes do have a lower exposure than other routes.
▶ The air quality close to a monitoring station can vary and is not related to the distance from the station. The Air Quality Index (AQI) on the road within a few hundred metres from the monitoring station can be significantly higher than the AQI measured at the monitoring station.
▶ Air quality varies by season and time of day as well. During the monsoon months from June to November, the AQI is significantly better than during the remaining five months of the year. The air quality in the mornings and late evenings tend to be worse than the air quality during the rest of the day.
Types of Air Pollutants
The CPCB tracks eight air pollutants—particulate matter smaller than 2.5 micrometers (PM2.5), particulate matter between 2.5 and 10 micrometers (PM10), nitrogen dioxide, sulphur dioxide, carbon monoxide, ozone, ammonia, and lead. The particulate matter pollutants, PM2.5 and PM10, are extremely small and visible only when concentrations are large. Particulate matter, PM2.5 and PM10, exist in the form of solids and liquids and are considered more harmful than the remaining six gaseous pollutants.
Calculating the AQI
The calculation of the AQI for each of the eight pollutants is based on a unique table and explained in this document. India uses a slightly different system to calculate AQI compared to the system in the US. The first three categories—Good, Satisfactory, and Moderate—have wider ranges in the Indian AQI formula.
The AQI published by a monitoring station is not a composite of all eight pollutants. Instead, it is computed from whichever single pollutant is dominant—in most cases, PM2.5.
Data from Monitoring Stations
The CPCB publishes air quality data that can be downloaded for cities in India, organised by monitoring station and frequency (hourly or daily) of data collection.
The map shows the AQI data collected from 11 monitoring stations for 2025 in Bengaluru city. The first four categories for the AQI are defined as Good (green), Satisfactory (yellow), Moderate (orange), and Poor (red) by the central Ministry of Earth Science.
The figure shows the percentage of time during 2025 that the air quality fell into one of the four categories by region and time of year at each of 11 monitoring stations. At the Hebbal monitoring station in North Bangalore, the AQI was Good (50%), Satisfactory (35%), Moderate (13%), and Poor (2%).
AQI Data from 11 Monitoring Stations in Bengaluru City for 2025
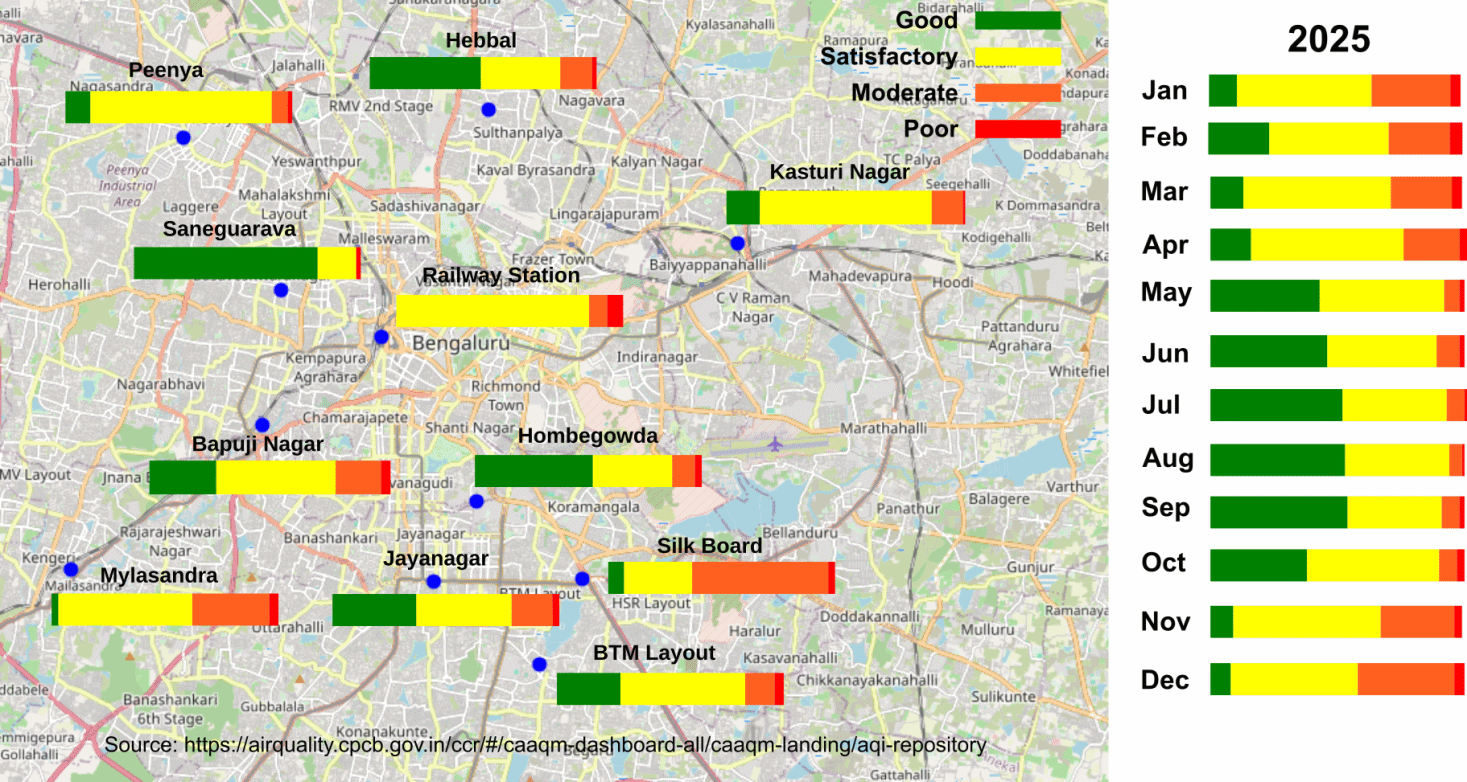
This data can give the impression that the air quality in North Bangalore was reasonably good compared to the rest of the city. However, this can be misleading. The AQI measured on the road close to the Hebbal monitoring station can be substantially higher than the reported AQI.
The map shows that air pollution is not evenly distributed across the city. Further, pollution is not concentrated in the centre of the city and locations on the edges of the city can have poor air quality. Pollution in the gaps between monitoring stations can be estimated using interpolation methods. However, air pollution data with sensors from a higher number of locations in a large city like Bengaluru would more accurately reveal the distribution of pollution.
The cumulative AQI data from all 11 stations for each month varies, with the best air quality occurring during the months from May to October. The worst months for the AQI are from November to January. This seasonal variation in AQI aligns with wind patterns during the monsoon. The stronger winds during the monsoon season coincide with periods of better air quality.
The air pollution data collected from monitoring stations and devices mounted on rooftops of houses can be supplemented with data from monitors mounted on a bicycle.
The average cumulative PM 2.5 concentrations by the hour of day also follow a predicted pattern. The early morning and late night hours tend to have the worst air quality of the day. Air quality is generally worse in the early morning and late night because cooler air can trap pollutants generated during the day near the ground.
The quality of the data collected from monitoring stations is presumed to be accurate since the Government of India has specific technical guidelines for the type of hardware at an official monitoring station. Still, there are anomalies such as the AQI data from the monitor at the Bengaluru Railway Station.
On several days the same identical AQI was reported hour after hour at the Railway monitoring station, which would appear unrealistic. Notwithstanding the occasional discrepancy, data from monitoring stations is a baseline to collect more detailed information about air pollution.
Low-cost Sensors
One of the drawbacks of depending on data from a limited number of monitoring stations is that air pollution is rarely evenly distributed across several square kilometres in a city. Data from a monitoring station will not capture the differences in air pollution at the street or neighbourhood level.
The process of collecting and integrating data from low-cost sensors with the data from monitoring stations to assess the variation in air pollution is documented.
A case study in 2019 pointed out that the air quality monitor density of 0.14 monitors per million in India was well below the density in several other countries. The study also mentioned that small-scale variability in air pollution levels in densely populated urban areas would not be identified. In 2023, only 12% of Indian cities and towns had monitoring stations.
One way to address this gap in air quality measurement is to supplement the data collected from public monitoring stations with data collected from low-cost but reasonably accurate sensors. A good sensor must also be precise—that is, it must give consistent readings for the same environment.
A simple way to verify the accuracy of a low-cost sensor is through calibration. Comparing the over 100 different models of air quality monitors that are sold online is not feasible for a potential buyer. The Council of Scientific and Industrial Research (CSIR) was tasked with certifying air quality monitors, but this information was not found on the Web.
Sensor on a Bicycle
The air pollution data collected from monitoring stations and devices mounted on rooftops of houses can be supplemented with data from monitors mounted on a bicycle. Air pollution data collected at the street level reveals the degree of exposure to pollution for commuters, which cannot be collected from a monitoring station.
The idea of using a bicycle to collect air quality data has been implemented in Germany, Netherlands, Spain and the US. The main benefit was the collection of data at a higher spatial resolution in cities that are fairly densely populated.
The results from a bicycle-based monitor also show how pollution can vary on a street at intervals of a few hundred metres. The results here show how air quality collected from a monitor on a bicycle varies within Bengaluru city.
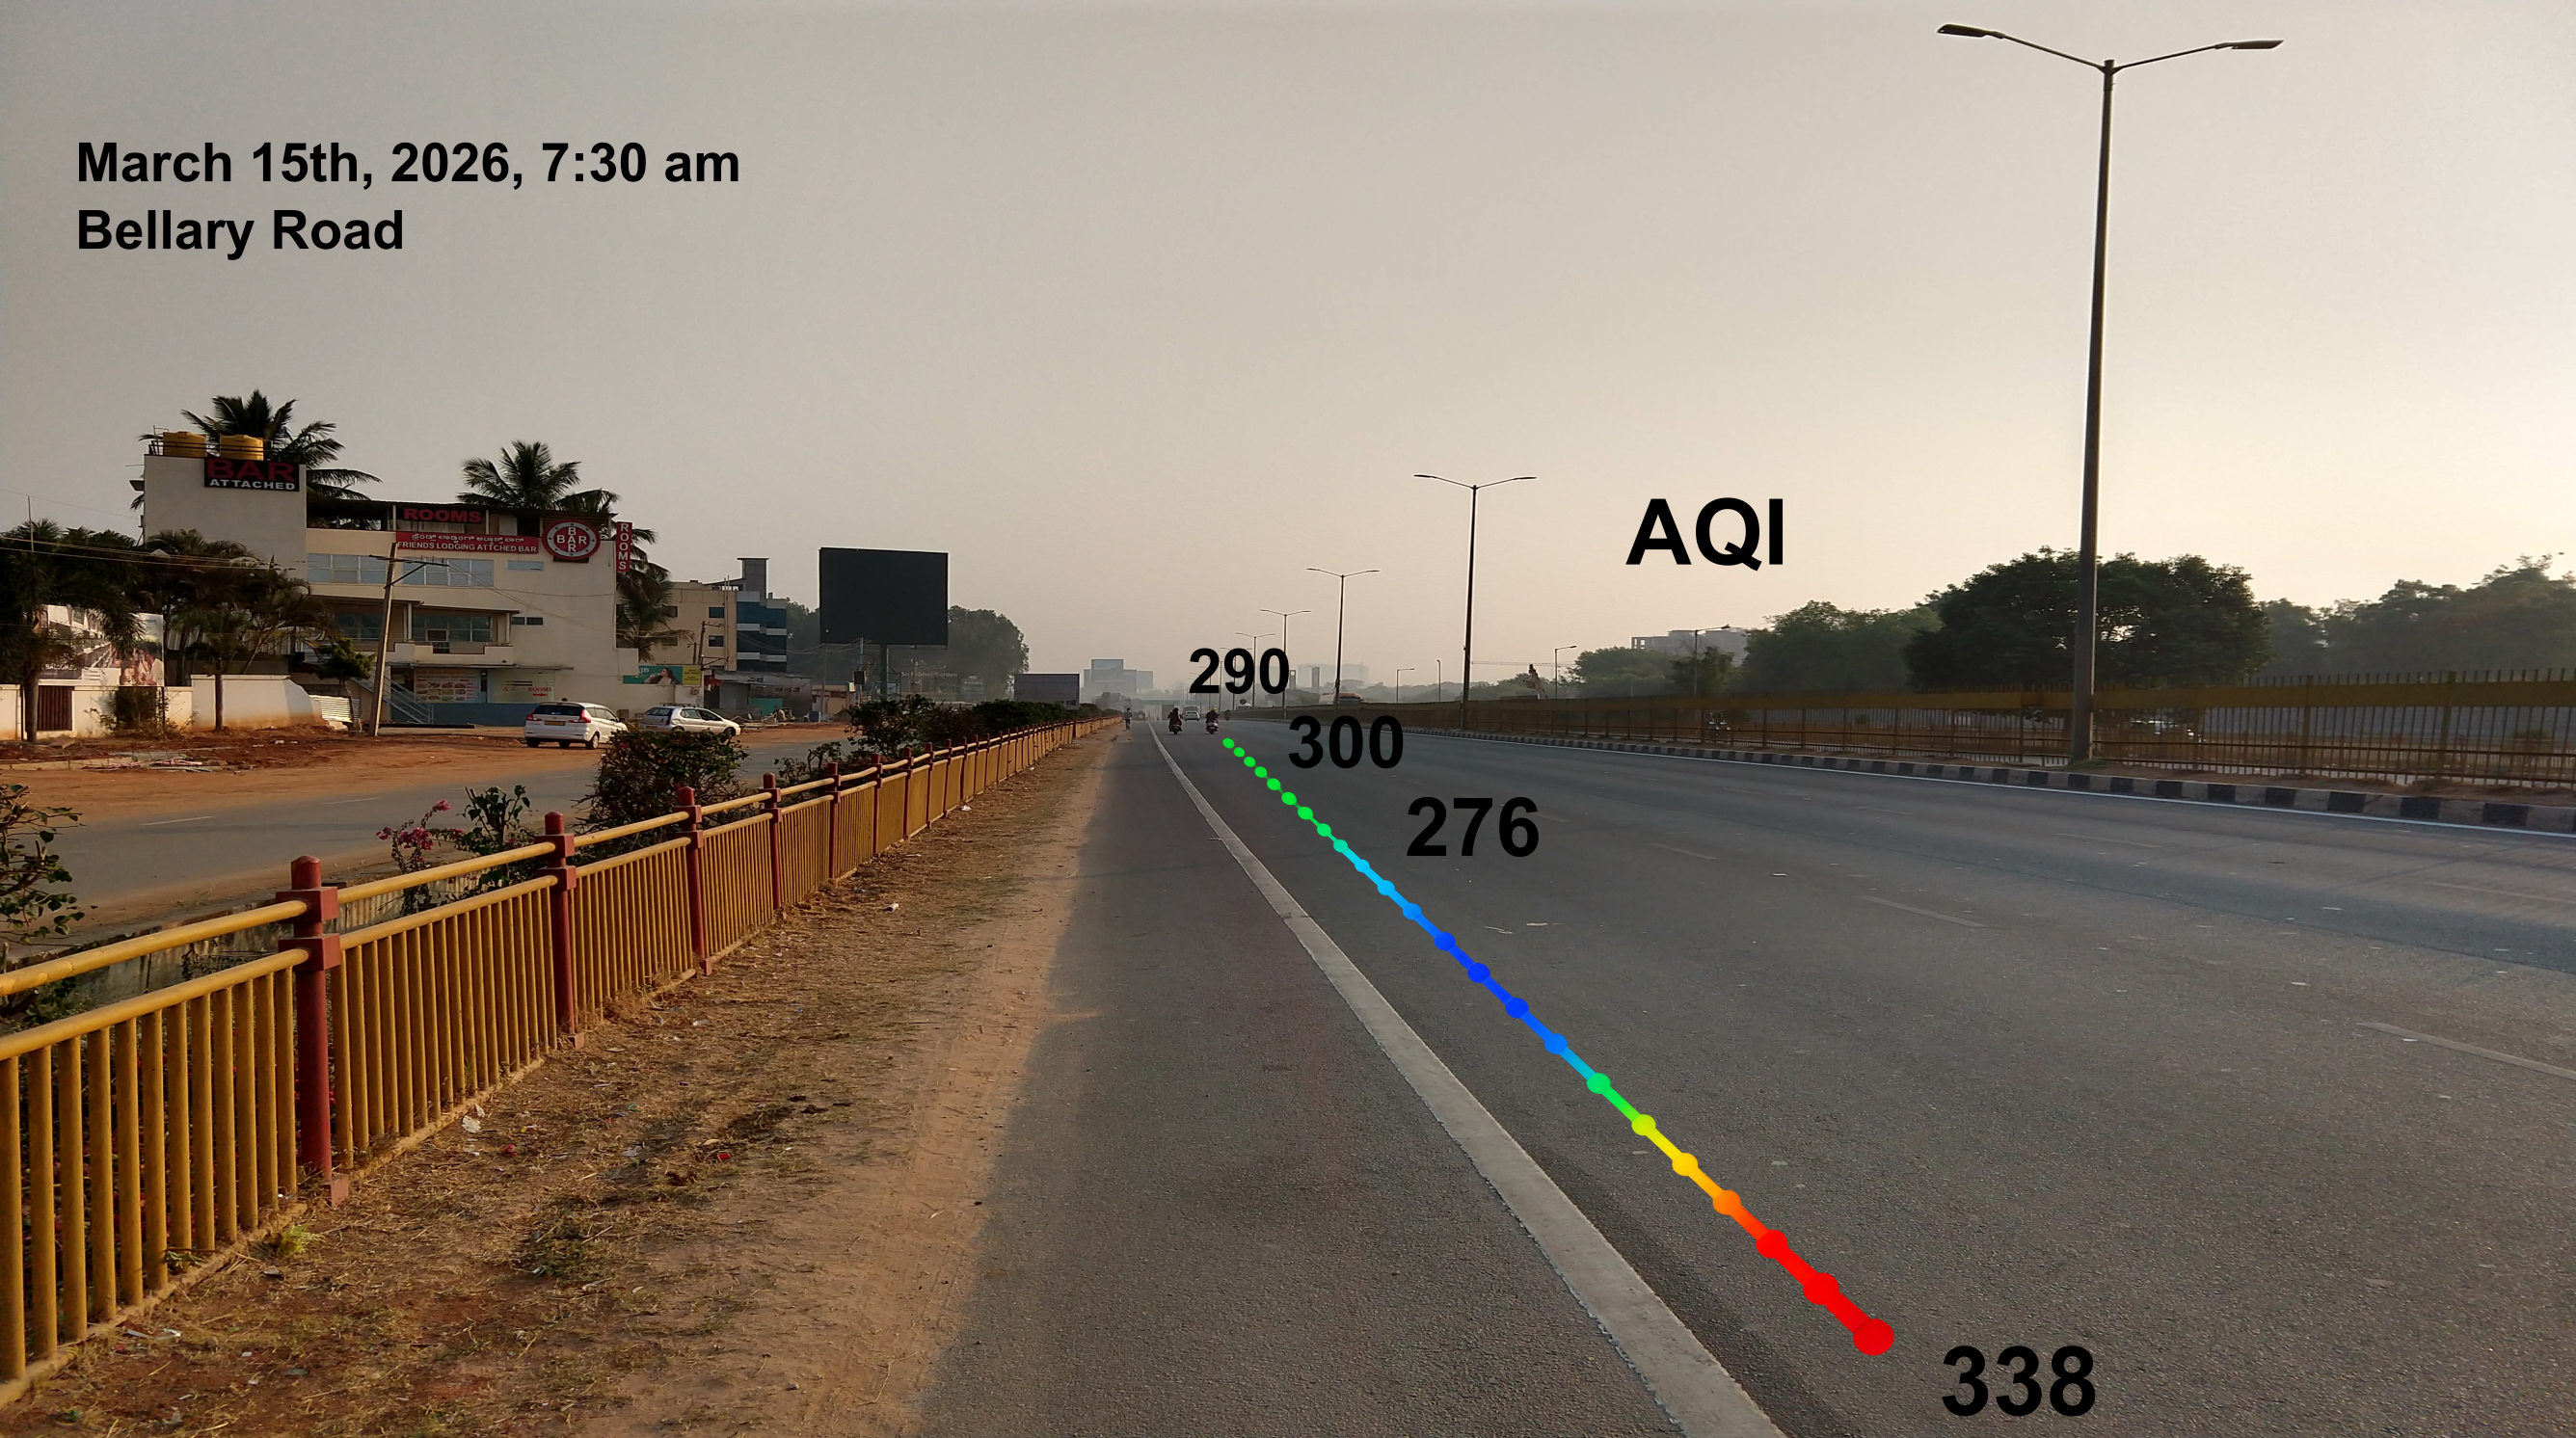
Pollution on Three Routes
Measurements along three different routes to the central business district in Bengaluru showed that the shortest route along major traffic corridors had the highest pollution exposure with the AQI in the poor category for 80% of the route.
The remaining two routes were along secondary roads with slightly less traffic. These two routes had exposure to the AQI in the poor category 30% and 5% of the time. The least polluted route was also the longest route with an additional three kilometres compared to the shortest and most polluted route.
The routes suggested by mobile apps like Google Maps find an optimal route that saves time. Exposure to air pollution is not a consideration when computing an optimal route.
Near a Monitoring Station
The monitoring station at Hebbal, Bengaluru is located a few hundred metres from a main road. The CPCB does not specify a radius from the monitor for which readings will be valid. In urban areas where pollution varies across locations, there is no single fixed radius from a monitor that can universally define the maximum distance for a valid reading.
AQI near Monitoring Station at Hebbal, Bengaluru
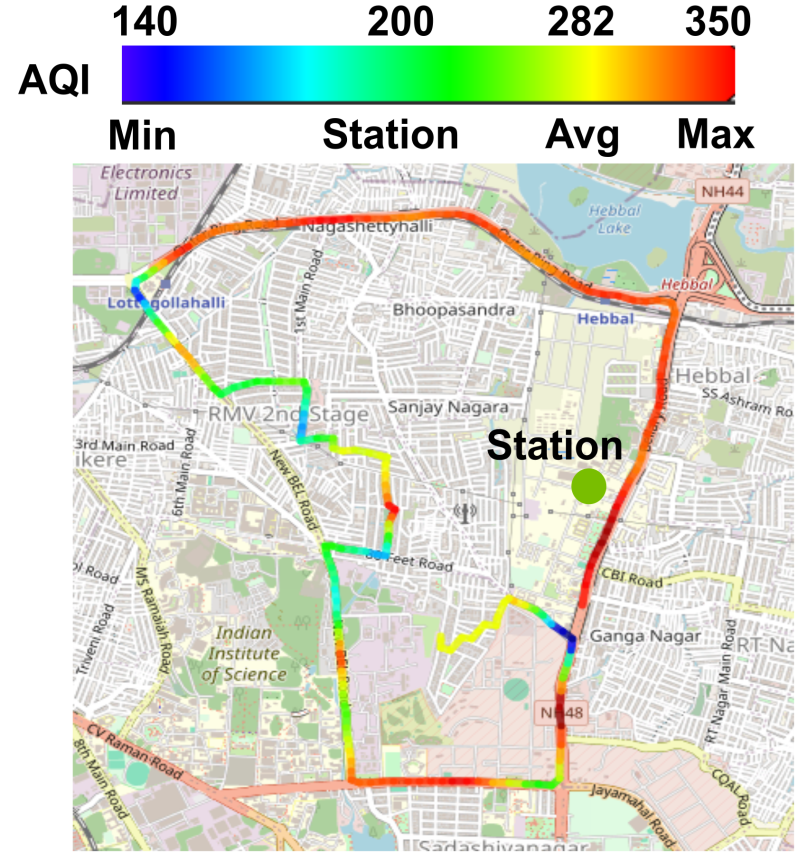
The map shows that the AQI (in red) on the busy road close to the monitoring station in Hebbal is much larger than the AQI of 200 at the monitoring station. A few locations on the road have a lower AQI (in blue) and the remaining locations have an AQI that is slightly above the AQI of the monitoring station.
The roughly 15 sq km on the map shows how the AQI can be significantly different from the AQI reported at the monitoring station. Without data from a larger number of sensors, these differences in air quality cannot be mapped.
Community Monitoring
While data from public monitoring stations is usually freely available, data from private organisations is often restricted and subscription based. Use of citizen data collected from low-cost sensors can provide a better understanding of the distribution of pollution than the data from widely distributed public monitoring stations alone.
Air quality monitoring through calibrated low-cost sensors cannot replace regulatory stations, but it can provide a clearer picture of the air that citizens actually breathe.
Citizens can collect air pollution data, not necessarily on a bicycle, but even on a morning walk. The collected data from affordable sensors, even though of low accuracy, has value and can be used to highlight the severity of the problem of air pollution, which is not obvious from the data collected at official monitoring stations alone.
The initiative by AQI.IN to create a large community of citizens who will support and maintain supplied air quality monitors is laudable. However, air quality monitoring is the responsibility of the government and measures to protect public health can be undertaken when detailed information about air pollution is freely available to all.
With better data collection, an optimal route that minimises exposure to pollution for a commuter can improve public health. Currently, most suggested routes optimise travel time alone.
The AQI on a road used by thousands of commuters, delivery workers, and others is often higher than the reported AQI from a monitoring station. The risk of exposure to air pollution is not limited to riders on two-wheelers alone. Although cars do have air filters and the air inside a car with an air conditioner is likely to be less polluted, commuting in a car will not necessarily reduce the exposure to air pollution.
A more formal evaluation of portable air quality monitors would include calibration to verify that the results from such low-cost sensors are accurate and also to run tests under similar environmental conditions. Air quality monitoring through calibrated low-cost sensors cannot replace regulatory stations, but it can provide a clearer picture of the air that citizens actually breathe.
The results from pollution data collected using a low-cost sensor on a bicycle in coastal Karnataka (Manipal), Kudremukh Forest, and the Western Ghats reveal patterns in air pollution that are not obvious from the two monitoring stations for the 7,500-sq km region.
Manu Konchady is a software developer specialising in data analysis.


