









The release of India's rebased National Accounts Statistics (NAS), with 2022–23 replacing 2011–12 as the base year, has reopened a dispute over manufacturing sector measurement that has run since the 2011–12 revision first introduced Ministry of Corporate Affairs (MCA-21) company filings as the primary data source for private corporate-sector value added (Nagaraj and Srinivasan 2016; Sapre and Bharadwaj 2023). In their recent article “How Credible are India's New Manufacturing GDP Estimates?”, Bedi and Nagaraj construct an Alternative Estimate (AE) of manufacturing GVA for 2023–24 from Annual Survey of Industries (ASI) and Annual Survey of Unincorporated Sector Enterprises (ASUSE) data, and compare it against the official NAS figure of ₹38.6 lakh crore released in the Second Advance Estimates of 27 February 2026. Their AE of ₹27.4 lakh crore is 40.9% lower; after attempting to account for workers and companies excluded from the ASI/ASUSE sampling frames. An adjusted upper-bound AE of ₹31.0 lakh crore remains 24.5% below the official figure.
This is a substantively important claim: a 24–41% overstatement of a sector contributing roughly 14% of aggregate GVA would materially distort the measured size, growth rate and sectoral composition of the Indian economy, with direct consequences for fiscal projections, monetary policy calibration, and the credibility of India's data infrastructure.
This comment does not adjudicate which estimate is closer to the truth — that needs MCA-21 microdata that has not been made public. It instead asks how robust the reconciliation is, and how its inputs hold up against independent official data.
Structure, Data, and Headline Claims
This verification exercise makes its argument in three steps. We look at each one separately, because the problems raised later don't apply equally to all of them — some steps hold up well, others rest on shakier ground. Breaking it down this way makes it easier to see which parts are solid and which parts are weaker.
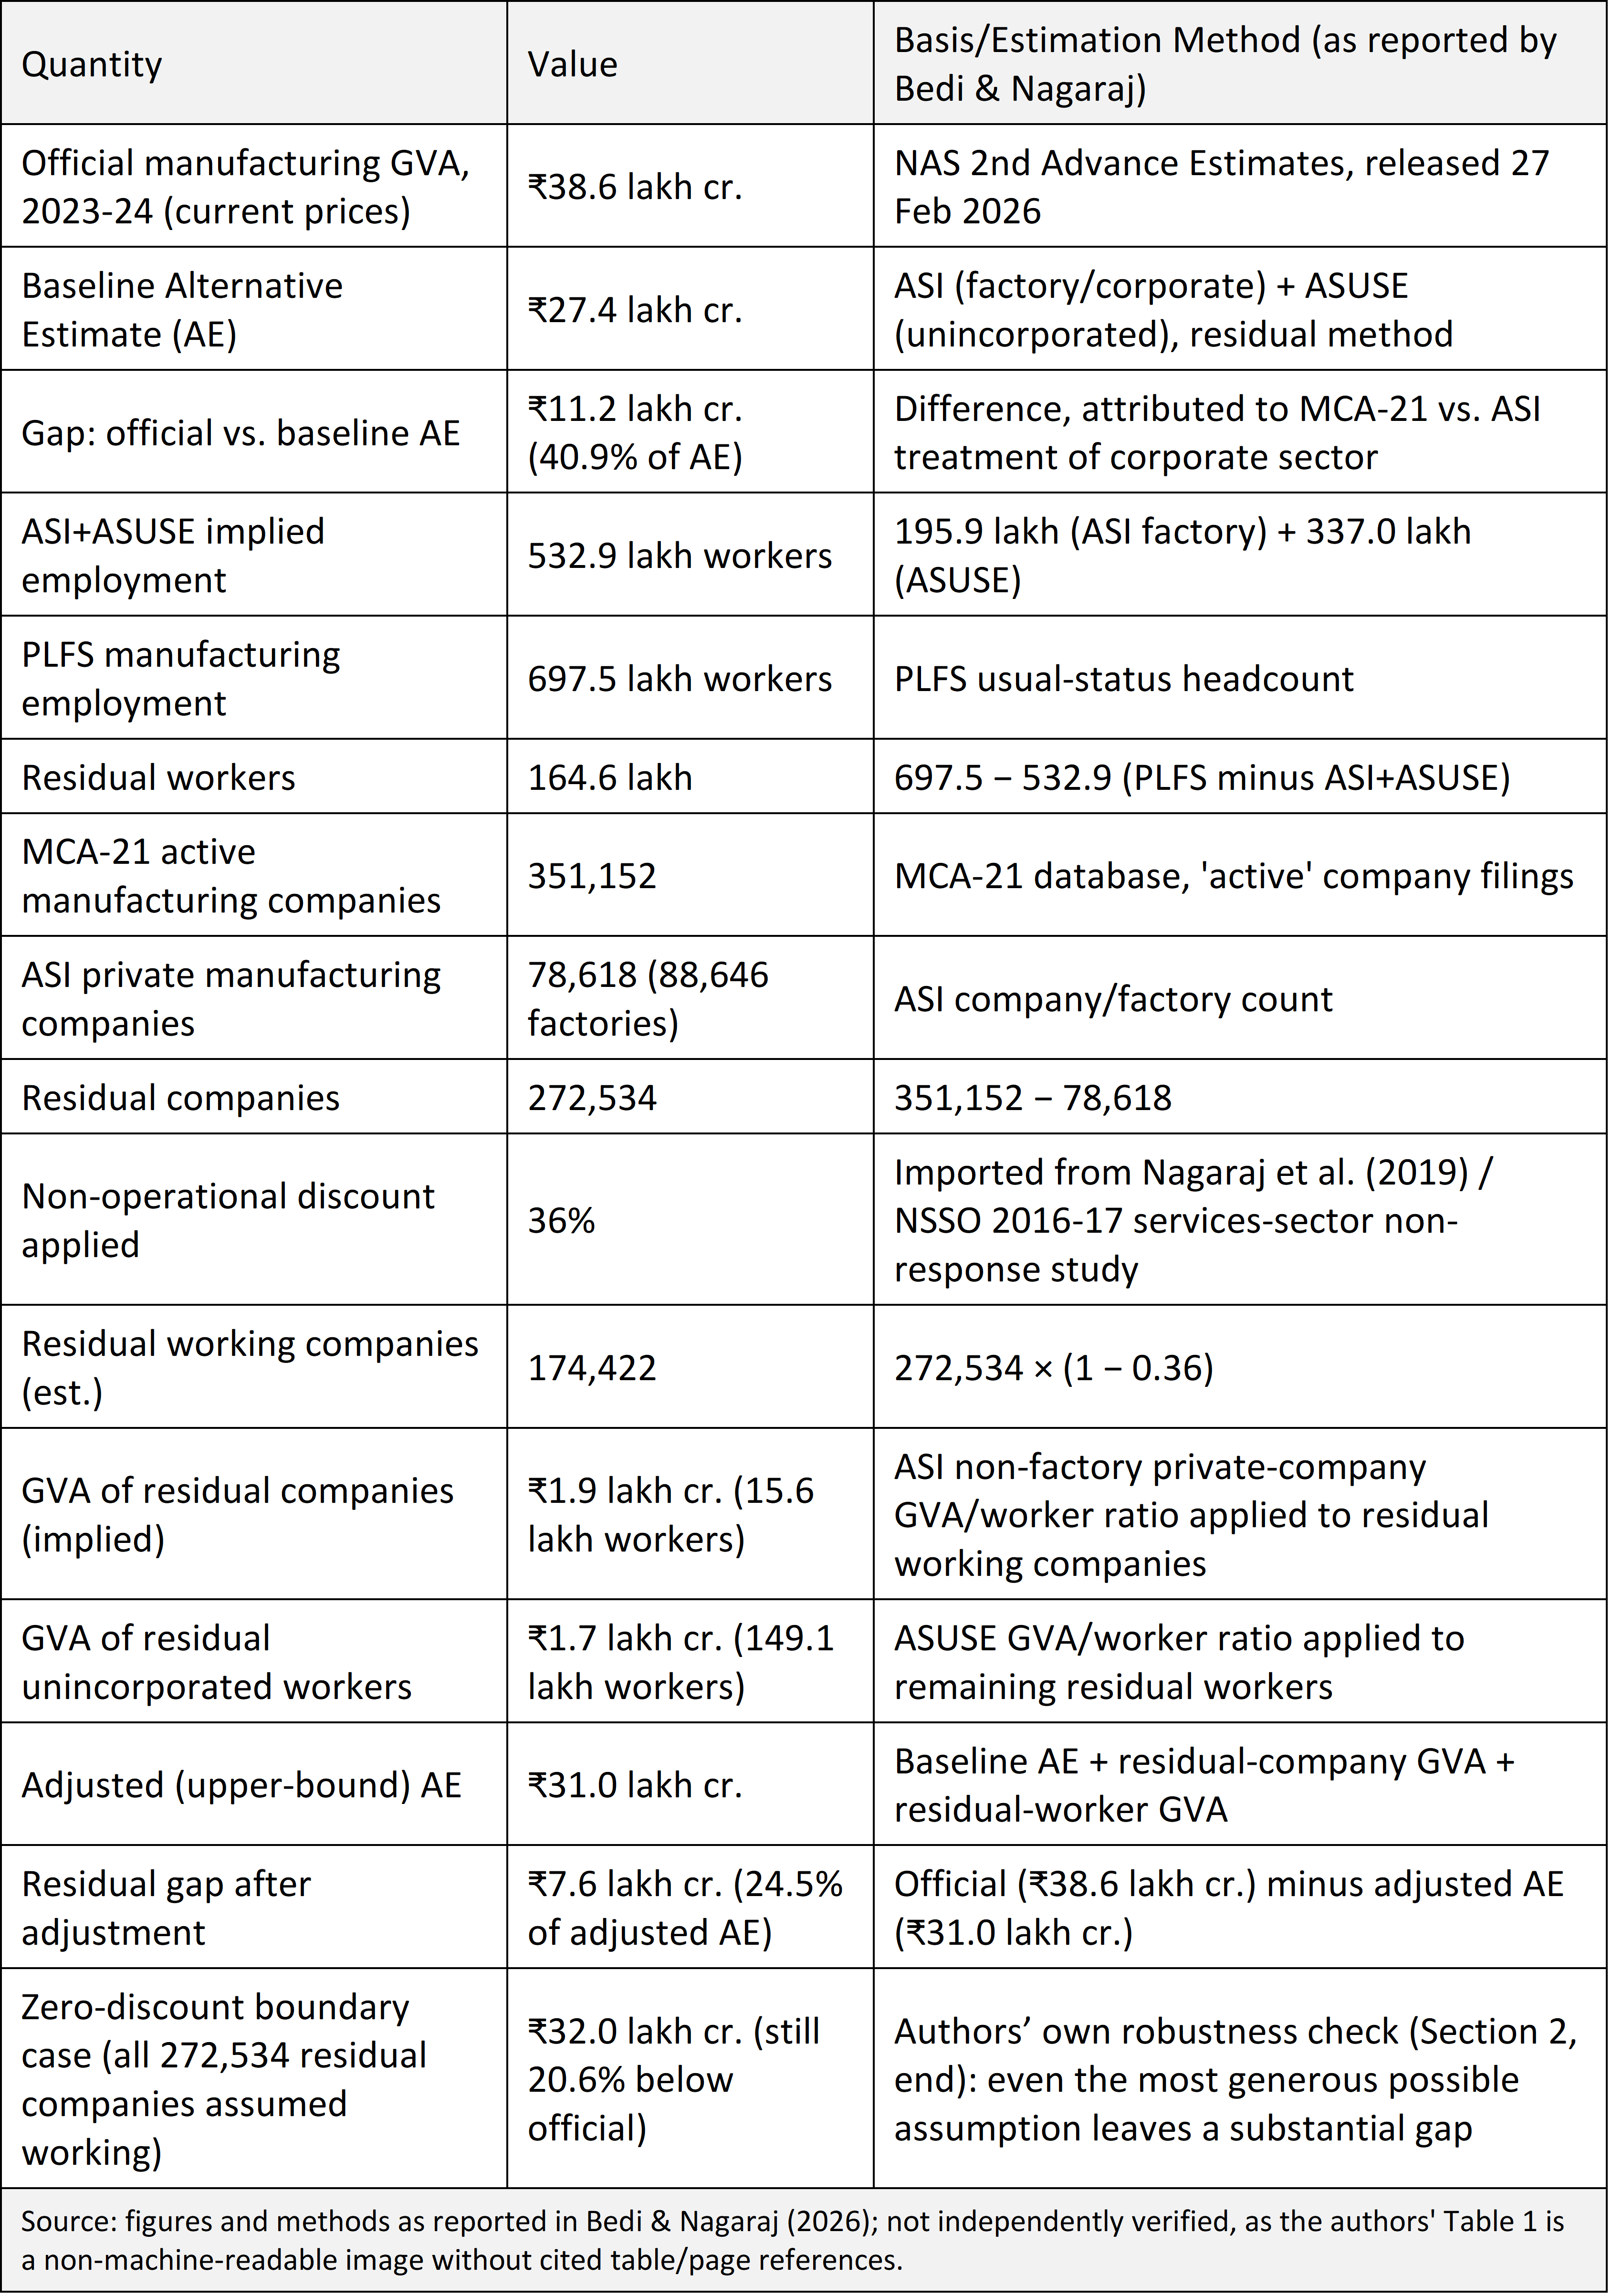
Stage one: the baseline Alternative Estimate: Using ASI for the factory/corporate sector and ASUSE for the unincorporated sector, the authors construct a baseline AE of ₹27.4 lakh crore, against the official ₹38.6 lakh crore — a gap of ₹11.2 lakh crore (40.9% of AE). Since ASUSE is common to both estimates, the gap is attributed entirely to the corporate segment, where NAS uses MCA-21 and the AE uses ASI.
Stage two: the employment residual: ASI plus ASUSE imply 532.9 lakh workers (195.9 lakh factory, 337.0 lakh unincorporated) against PLFS's 697.5 lakh — a 164.6-lakh 'residual worker' gap the authors hypothesise may generate the residual GVA.
Stage three: the company residual and the bounded re-estimate: Separately, MCA-21 records 351,152 active manufacturing companies against 78,618 ASI-captured companies (88,646 factories). A 36% non-operational discount — from an unrelated NSSO finding on 2016–17 services companies (Nagaraj et al. 2019) — applied to the 272,534-company difference yields 174,422 residual working companies, employing 15.6 lakh workers and generating ₹1.9 lakh crore at the ASI non-factory ratio. The remaining 149.1 lakh residual workers, assumed unincorporated, add ₹1.7 lakh crore at the ASUSE ratio, lifting the adjusted AE to ₹31.0 lakh crore — still 24.5% below the official figure.
Table 1. Reconstruction of the Bedi–Nagaraj Reconciliation Chain
Methodological Assessment
We identify seven points where the exercise relies on a single point assumption, an unstated homogeneity condition, or an unaddressed definitional mismatch. None individually invalidates the core finding of a substantial gap; collectively they mean the 24.5%–40.9% range is one plausible reconstruction, not a statistically bounded estimate.
Cross-sectoral, cross-temporal transplantation of the 36% non-operational ratio: The 36% discount applied to the 272,534 residual companies is carried over from an NSSO finding (Nagaraj et al. 2019) that 36% of MCA-21 services companies sampled for an abandoned 2016–17 survey were closed, untraceable or non-responsive. Applying a services-sector ratio to manufacturing in 2023–24 assumes non-operational rates are stable across sector and across seven years of registry-enforcement change, including tightened INC-22A compliance MCA itself cites as improving accuracy. To their credit, the authors do test one boundary of this assumption: at the end of Section 2, they show that even under the unrealistic assumption that every one of the 272,534 residual companies is working — a zero discount — potential GVA rises only to ₹32.0 lakh crore, still 20.6% below the official figure. That is a genuine robustness check, and it shows the headline finding does not hinge on the 36% figure being exactly right. But testing one extreme is not the same as estimating a distribution across the plausible range, and it leaves open why the gap persists even at this most generous extreme — a question that points more toward the assumptions in 3.2–3.6 below than toward the operating-status ratio itself.
Productivity-ratio homogeneity and the selection-bias problem: To estimate the output of these leftover companies and workers, the exercise borrows productivity numbers from companies that were already surveyed — smaller ASI companies and ASUSE establishments. In effect, it assumes a typical leftover company produces about as much per worker as a typical surveyed one. That assumption is worth questioning. A company lands in the 'leftover' group for a specific reason: it registered as a company, which is easy, but never registered as an ASI factory, which is harder. The companies that clear one bar but not the other aren't a random sample — some may simply be too small or new to run a factory, while others may be trading arms, holding companies, or firms that function more like services businesses despite being classified as manufacturers. Either way, this group probably isn't representative of the ASI companies already being measured, and it's genuinely unclear whether it's more productive or less. Treating the difference as zero, as the exercise does, is a real assumption — not a safe default — and it deserves to be argued for, not simply assumed.
Definitional incommensurability between PLFS and ASI/ASUSE employment concepts: The authors note that PLFS counts persons once each while ASI/ASUSE count workers at the establishment level, so a worker at multiple sites may be double-counted, understating the true ASI/ASUSE headcount. This is acknowledged but not quantified. Since the 164.6-lakh residual-worker figure is a subtraction of an establishment-based count from a person-based one, even a modest correction would materially shrink the residual and its downstream GVA.
A residual-method critique built on residual-method inputs: The NAS itself derives its ASUSE unincorporated-sector estimate using a residual approach, as the authors note. The AE's unincorporated component is thus a re-application of that logic, not an independent check; genuine leverage comes only from the ASI-versus-MCA-21 comparison — a single data-source substitution, not two verifications.
No propagation of sampling error: ASI, ASUSE and PLFS carry published standard errors; MCA-21's 'active' status is itself an imperfect proxy for operating status (3.1). None of the reported figures carry a confidence interval. The gap is unlikely to be pure noise, but without error propagation it is impossible to say how much of the range is stable versus an artefact of parameter choice. Section 5 offers an illustrative first step.
Formalisation dynamics are not addressed: The exercise also omits India's formalisation dynamics. Since 2017, GST rollout has pushed businesses to register formally, and digital tools have made MCA-21 filings easier to track — inflating company counts independent of real production. It compares a 2011–12 survey frame against a live 2023–24 register: some newly visible companies reflect genuine output; others are dormant, compliance-only entities. These opposing effects are not separated — the entire gap is read as overestimation, when part is simply the expected result of formalisation.
Reproducibility of the underlying data table: Table 1 of the original article is published as a static image without citation to specific report tables or extraction dates. This limits replication — a limitation the authors' own call for NSO transparency implicitly concedes applies to official data too, and which should apply symmetrically to verification exercises.
Independent Triangulation
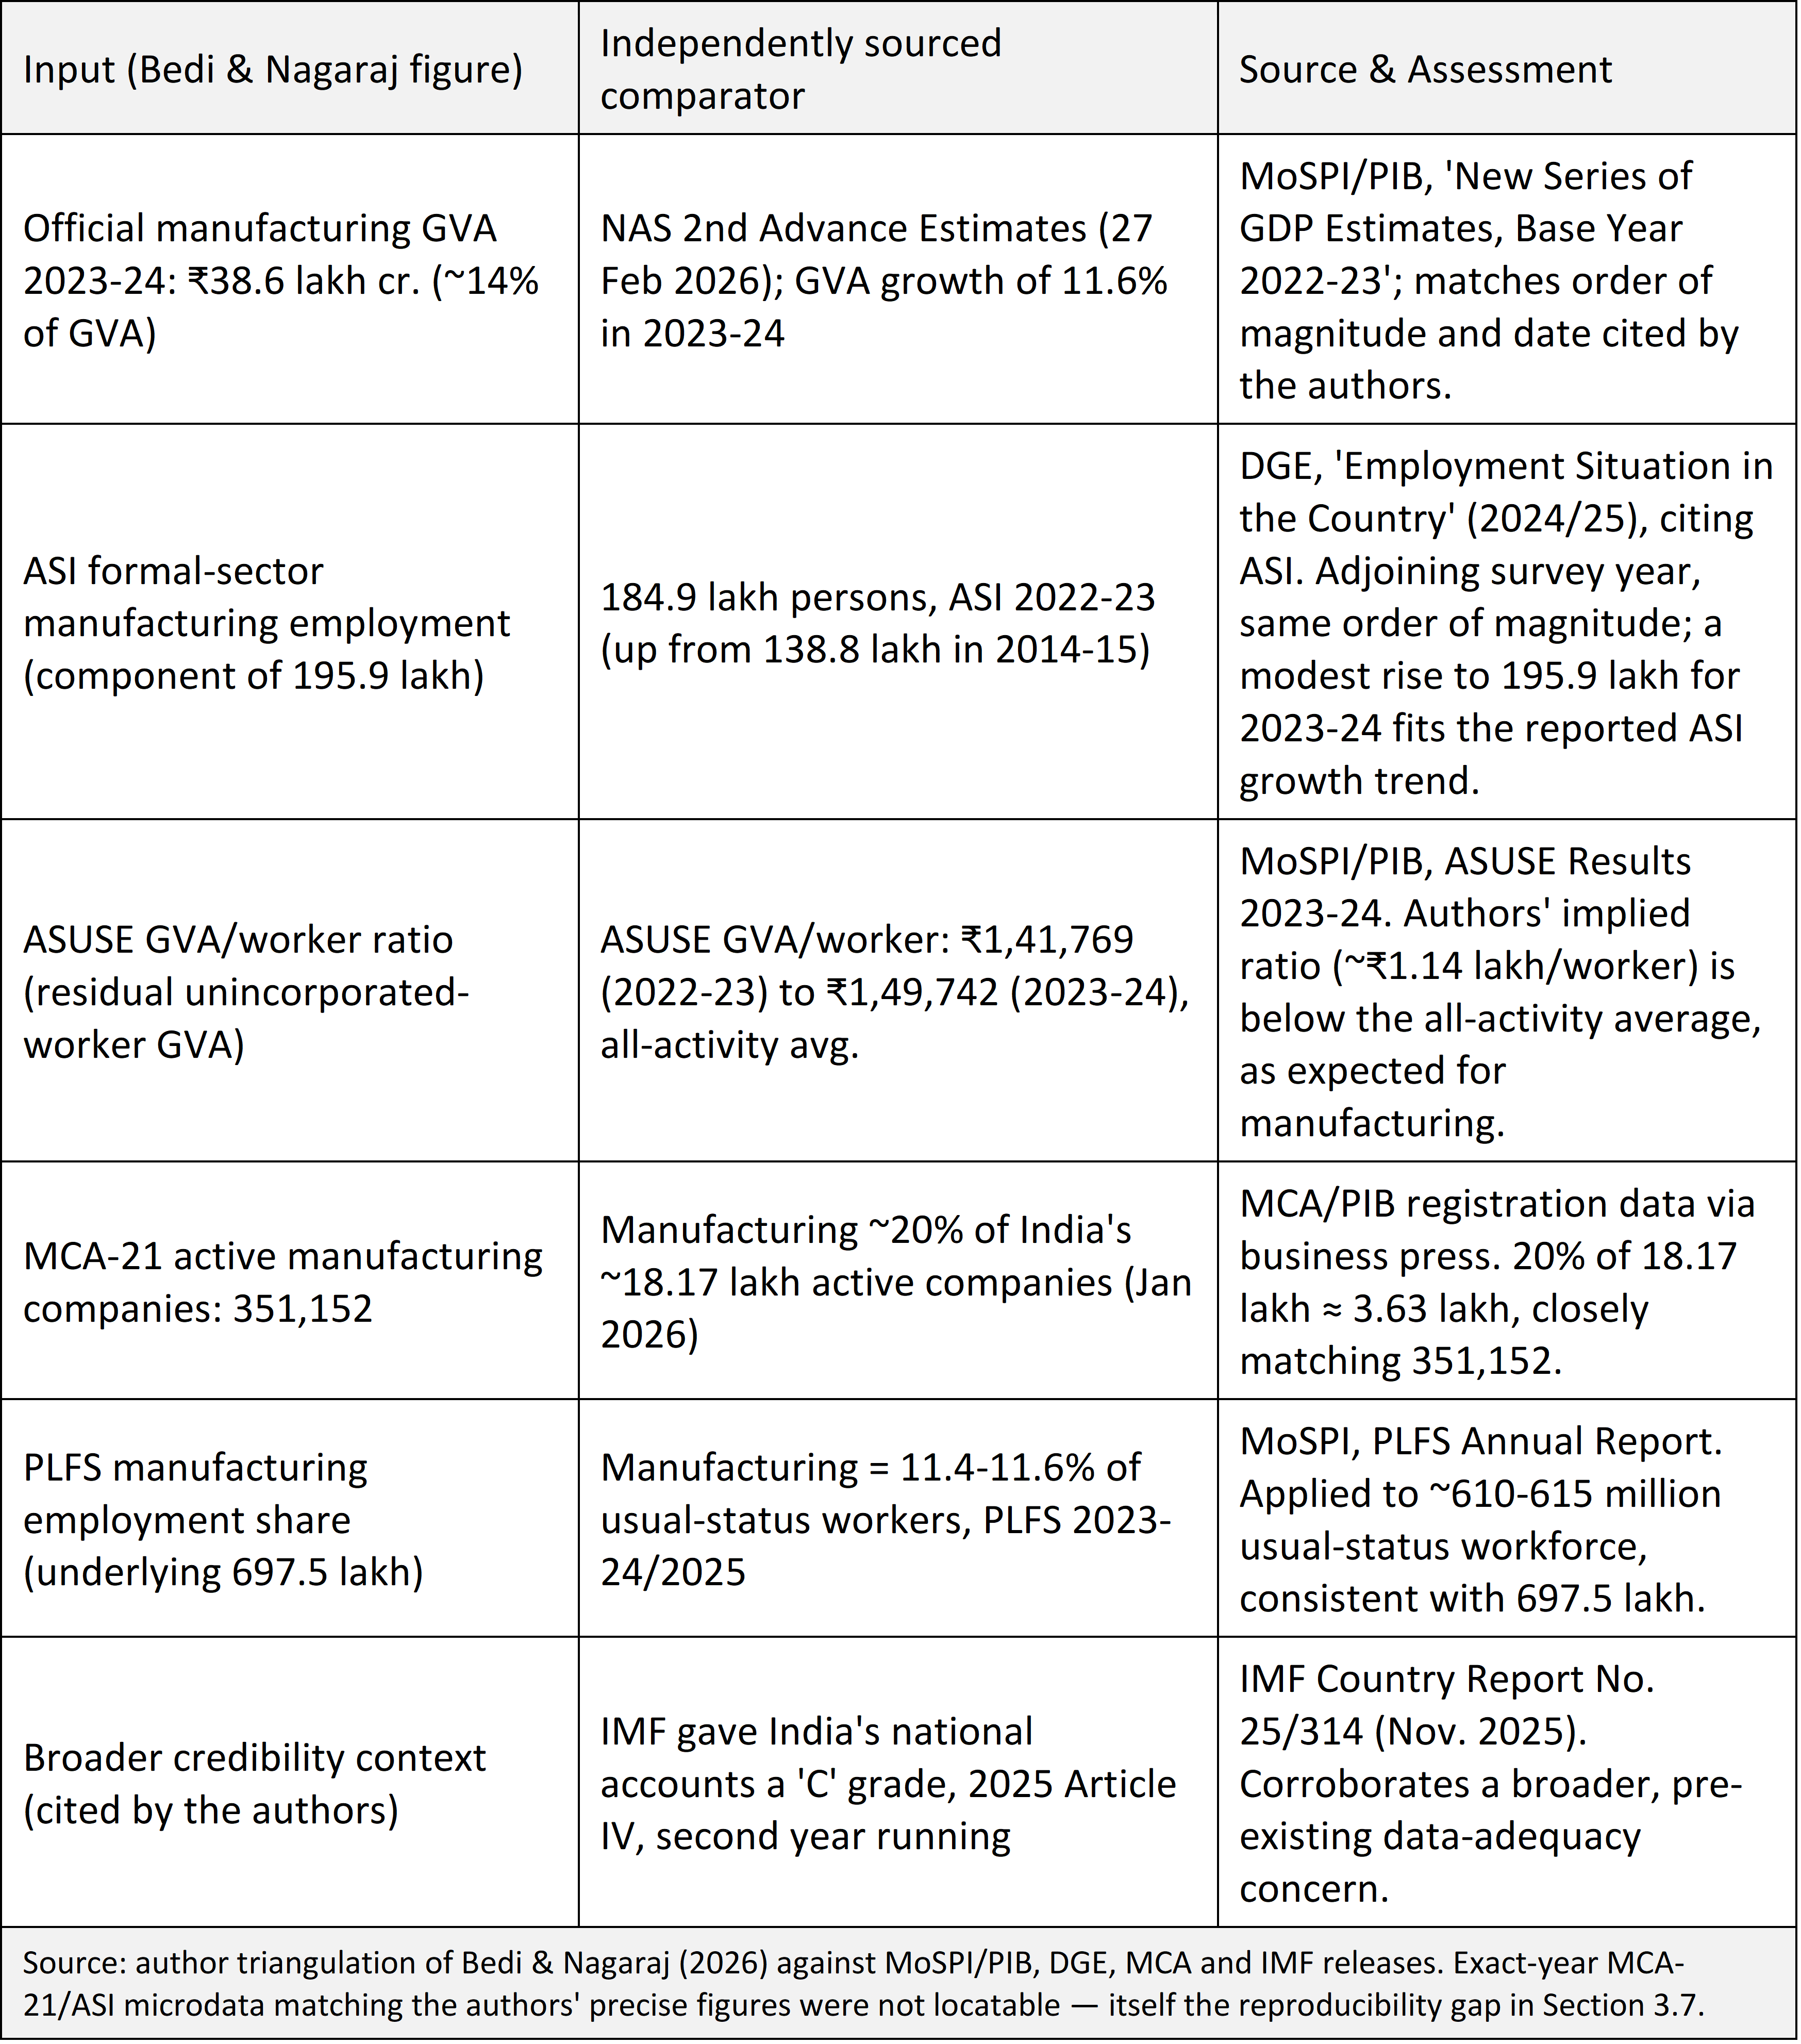
Table 2 cross-checks the exercise's key inputs against independently sourced NSO, MoSPI, PIB and MCA releases, to assess consistency with the broader official data ecosystem. The exercise performs well: every checkable figure is an exact match or within a plausible range, strengthening confidence in its factual foundation even as the assumption-driven reconciliation in Section 3 remains open to challenge.
Table 2. Independent Triangulation of Key Data Inputs Against Published Official Sources
A Bounded Re-Estimation
Because the underlying microdata are not public, a full re-estimation is not possible. The authors themselves already report one boundary of the non-operational assumption — a zero discount, which still leaves a 20.6% gap — so the exercise here instead fills in the middle of the range: using only the authors' own reported ratios (a workers-per-company ratio of 8.95 and a GVA-per-worker ratio of ₹12.18 lakh for the ASI non-factory segment), Table 3 recomputes residual-company employment and GVA across an illustrative ±9 percentage-point band (25%-45%) around their 36% point estimate, holding these ratios constant.
Table 3. Sensitivity of Residual-Company GVA to the Non-Operational Discount Assumption
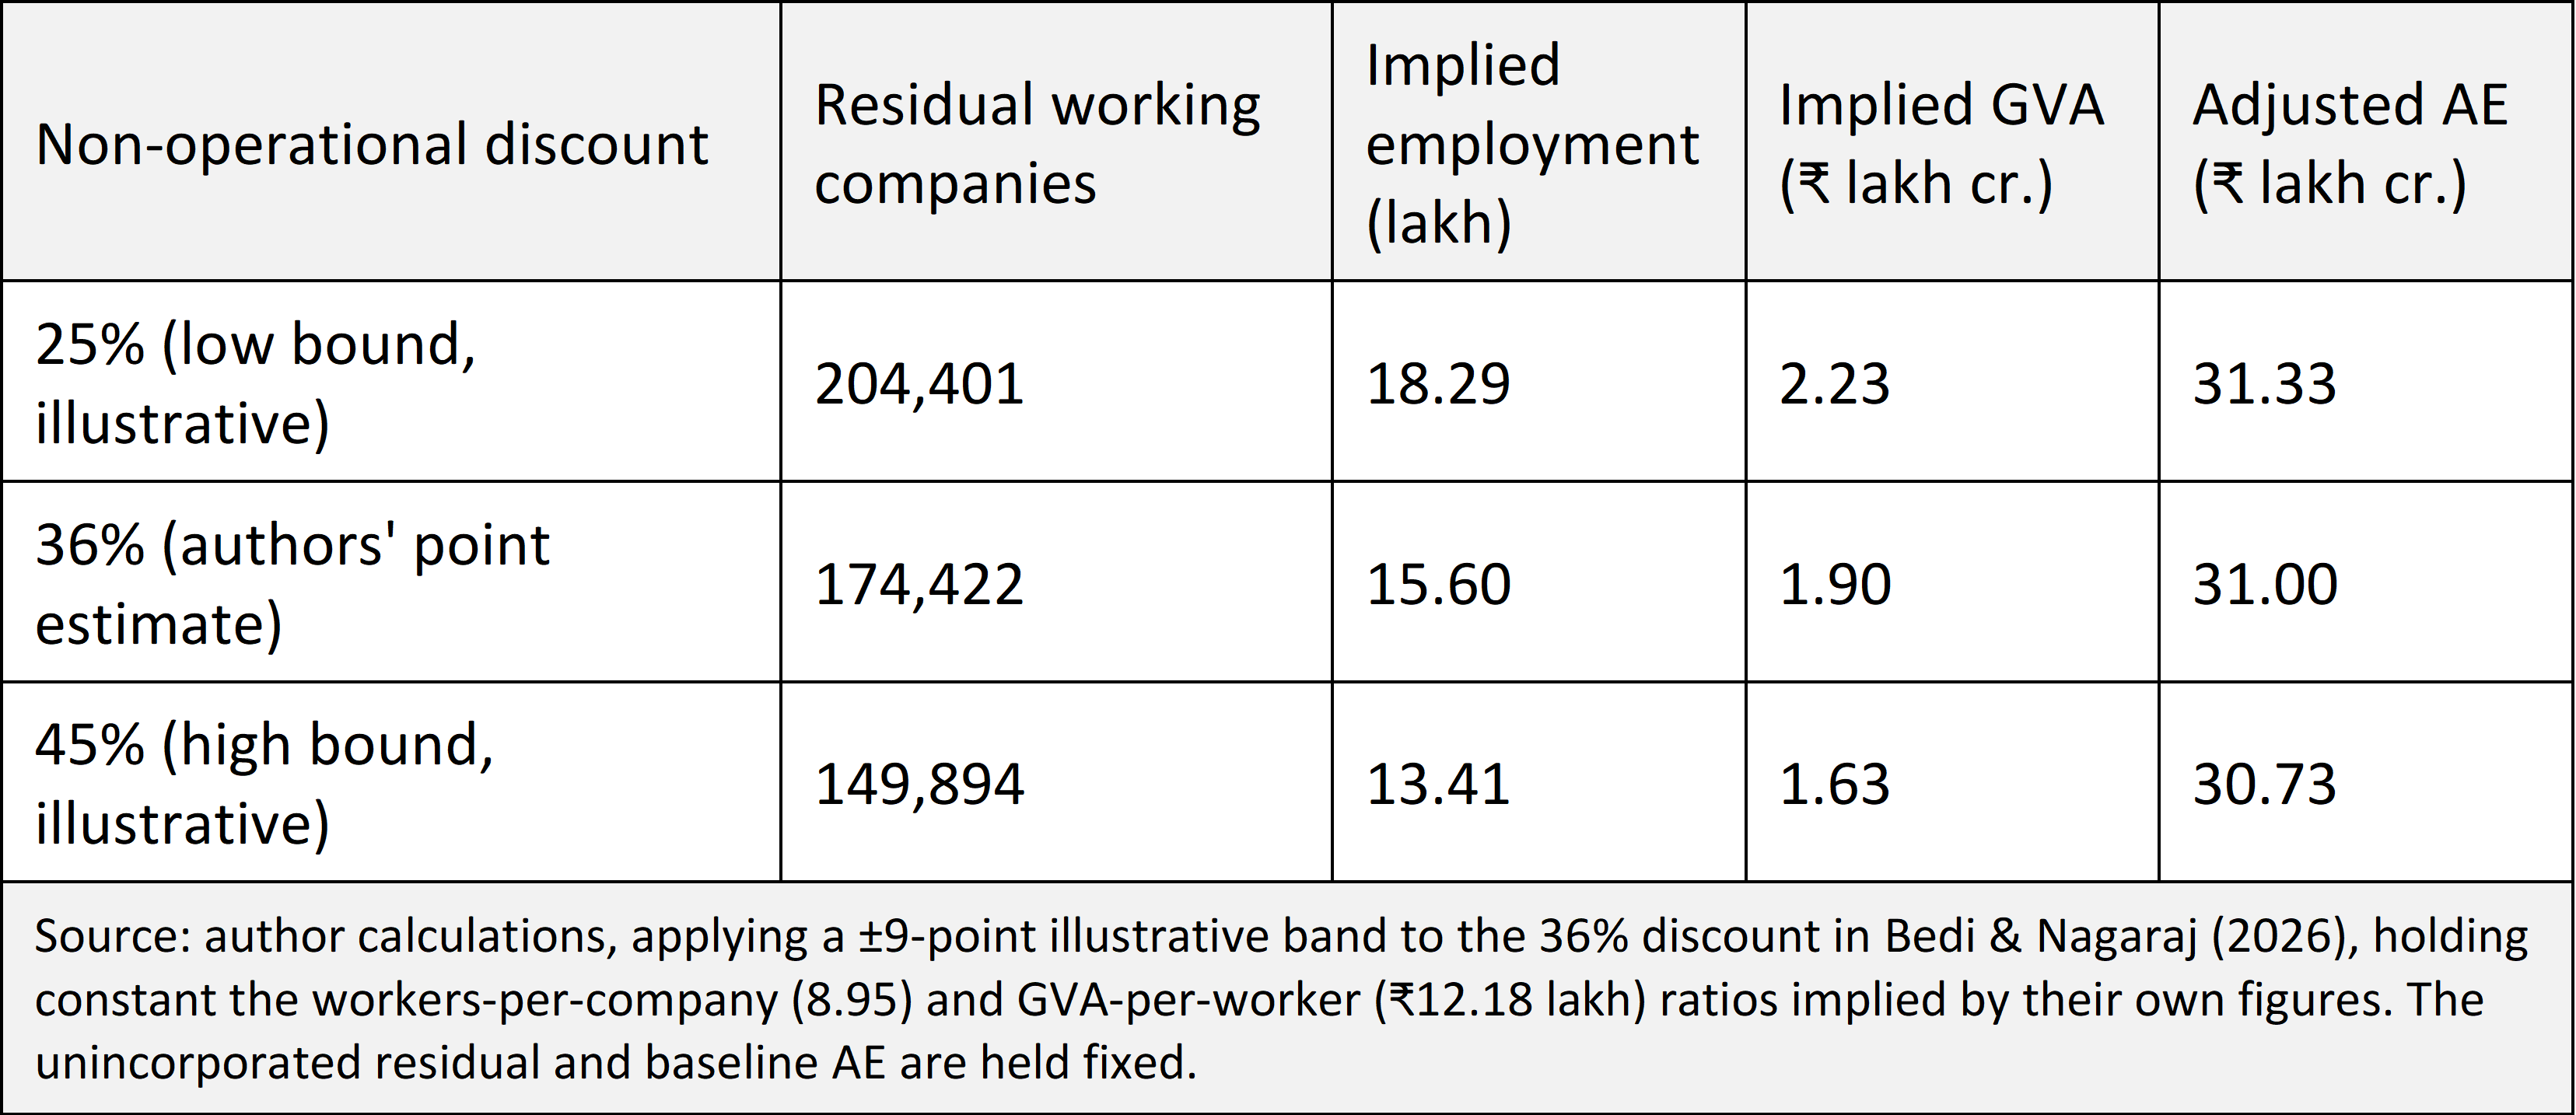
Two things follow from Table 3. First, across this range, the adjusted estimate barely moves — from ₹30.73 to ₹31.33 lakh crore — because the discount only affects the smaller of the two leftover components (companies), not the larger one (workers). This is consistent with the authors' own zero-discount boundary case (₹32.0 lakh crore, still 20.6% below official): together, the two exercises show the finding is not especially fragile to this one assumption anywhere across its full plausible range. Second, and more importantly, this shouldn't be mistaken for proof that the 24.5% figure itself is accurate. Together with the authors' own boundary test, it rules out the operating-status ratio as the main driver of the gap — but it tests only one of the seven assumptions flagged earlier, while leaving the others — including the productivity assumption, the employment-count mismatch, and the formalisation issue — completely untested. A full check would need to vary all seven together, which isn't possible without data that neither this paper nor the original authors currently have.
What Would Resolve the Dispute
Bedi and Nagaraj call on the NSO to open MCA-21 data and methods to scrutiny. Our comment reinforces that on narrower grounds: the highest-leverage disclosure would be a published distribution, not a point estimate, of the operating-status rate of MCA-21 manufacturing companies filing no ASI return — ideally a manufacturing-specific audit, not the transplanted services-sector figure. A second would be the NSO's own reconciliation of PLFS person-based counts against ASI/ASUSE establishment-based counts, since the 30.9% employment gap is currently treated as fully residual when part is likely a definitional artefact neither side can quantify.
Until these are available, both sides are working with limited information: the official GVA figure is not fully transparent about its MCA-21 construction, and the challenging estimate is, in its own way, equally opaque. Transparency should be demanded evenly, not only of the official statistics.
Conclusions
Bedi and Nagaraj point to a real puzzle: the manufacturing GDP figure that India's official statistics build from company filings is much higher than the alternative figure they build from survey data — by somewhere between 24.5% and 40.9%. That's too large a gap to shrug off as noise.
We checked their main data inputs against publicly available government sources and found them broadly sound — a point in the exercise's favour. But when we looked at how those inputs get combined into the final numbers, we found seven places where the argument leans on a single assumed figure rather than a properly tested one. The most important is a non-response rate borrowed from an unrelated 2016–17 study of services companies and applied, years later, to manufacturing — even though it was never actually measured for manufacturing.
The authors themselves already test one edge of that borrowed assumption, showing that even a zero discount still leaves a 20.6% gap. Our own test of the middle of the range, using only their published numbers, points the same way — the headline finding does not hinge on this one assumption. But that is just one of seven weak points, and the persistence of the gap even at the most generous extreme shifts the open question toward the other six, not toward this one. Testing all seven together would need data neither Bedi-Nagaraj nor we currently have. Until that data is available, the honest reading of the 24.5%–40.9% range is that it's one plausible reconstruction built on reasonable but largely untested assumptions — not a figure that's been proven.
Gulab Singh (dr_gulabsingh@yahoo.com) is Former Director, Central Statistical Office, Government of India, and Former Senior Statistician, United Nations Statistics Division.






A Response to the Critique