
India has an inequality problem. In 2020–21, India’s economy experienced the largest annual contraction (7.3%; NSO, MOSPI 2021) in the post-Independence period due to the health and economic fallouts of the Covid-19 crisis. Yet, the stock market has recovered from an initial dip and is up by 75% from a year ago. The total number of Indian billionaires rose to 140 last year from 102 and their combined wealth nearly doubled to $596 billion. India has the third largest number of billionaires in the world after the US and China. Yet, the number of poor in India is estimated to have increased by 75 million due to Covid-19, accounting for nearly 60% of the global increase in poverty.
After accounting for population and economic differences across countries, an earlier analysis showed that India does have more than its expected share of multimillionaires (Ghatak and Ray 2014). Additionally, India’s share of the world’s extreme poor is higher than its share of the world population. India accounts for 139 million of the total 689 million people (20.17%) living in extreme poverty in 2017 (World Bank 2020), with its population being 17.8% of the world population (World Bank 2019).
India’s share of the world’s extreme poor is higher than its share of the world population.
The fact that there are many Indians who are rich and many who are poor, however, does not necessarily mean that there is greater inequality in India compared to other countries. Further, looking at the very top and bottom tails of the wealth distribution gives us a limited glimpse of the problem of inequality. Moreover, the pandemic is a once-in-a-century phenomenon and, hence, we need to dig deeper to see what the story with inequality in India is.
The World Inequality Database, developed by Thomas Piketty and his colleagues, provides a relatively comprehensive picture of wealth and income inequality over time and across countries. 1 WID combines national accounts and survey data with fiscal data sources. Hence, the inequality estimates are more reliable — from the bottom to the top of the distribution of income and wealth — and also span over longer periods. Analysis of the data points to an alarming rise in both wealth and income inequality in India.
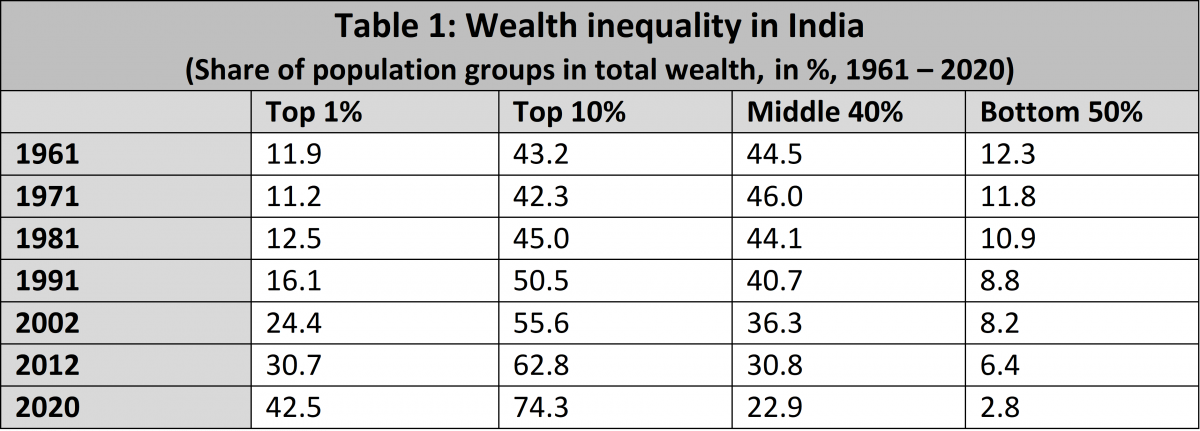
We first delve into the evolution of wealth inequality over time (Table 1). The share of total wealth of the top 1% of the population was fairly constant around 12% from 1961, the earliest year for which we have numbers, to 1981. Since 1991, the year of liberalisation, it has steadily increased and reached 42.5% in 2020. The share of total wealth of the bottom 50% fell marginally to 10.9% from 12.3% between 1961 and 1981, and then started declining sharply and stood at a mere 2.8% in 2020. The share of total wealth of the middle 40% follows a similar pattern, hovering around 45% till 1981 and then falling steadily to 22.9% in 2020.
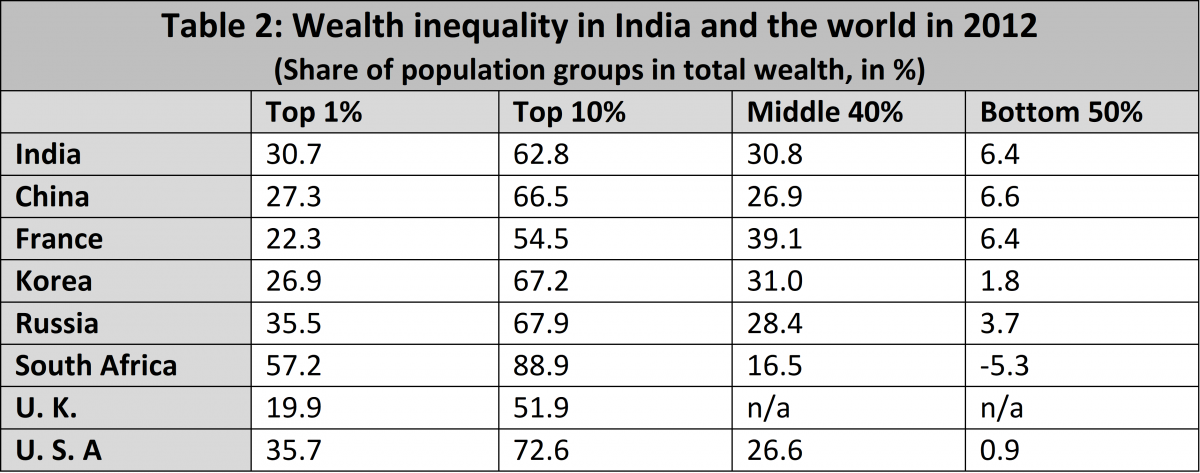
Comparing the wealth inequality in India with that other major economies (Table 2), India has a relatively large gap between the top 1% and bottom 50%. While the US stands out in this respect, India has a larger gap than France and China, and is only marginally behind Russia.
From wealth inequality, let us now turn to the evolution of income inequality in India over time (Table 3). Here, the share of the top 1% in total income was 13% in 1961, and, in fact, declined gradually to 6.9% in 1981. Then, it started climbing up from the 1990s onwards, going up from 10.4% in 1991 to 21.7% in 2019. In general, wealth tends to be more concentrated than income as it reflects a cumulative process spanning across generations via inheritance. India is no exception. The share of the bottom 50% in total income stayed somewhat constant between 21% and 23% between 1961 and 1981, but thereafter it started declining, going down to 14.7% in 2019 from 22.2% in 1991. The share of the middle 40% shows a similar pattern— it fell to 29.7% in 2019 from 42.6% in 1961.

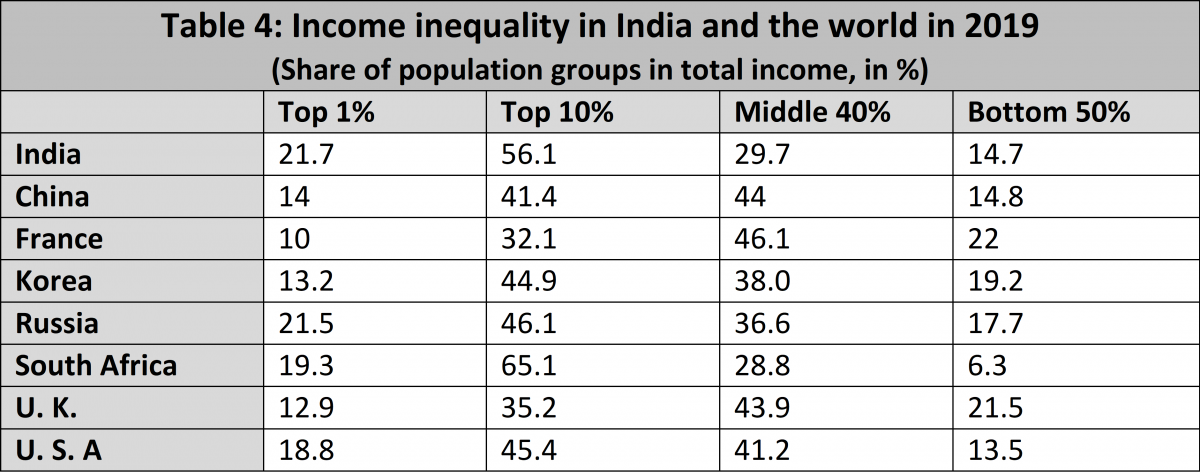
In terms of the gap between the top 1% and the bottom 50%, India stands apart among major economies (Table 4). The gap is wider in India than, for example, in the US, China, Russia, France, and the UK.
Clearly, since the economy started growing faster in the 1990s, inequality has shot up. The empirical regularity that economic growth leads to an increase in inequality was first established by Simon Kuznets, whose pioneering work with national income data earned him a Nobel Prize in Economics in 1971. In the initial stages of development, as new opportunities arise, the richer take better advantage of them. At the same time, a large population of unskilled workers keeps wages down. Therefore, inequality goes up. This empirical regularity is now being witnessed in India. The income of the rich has grown at a faster rate than that of the poor. If we compare the GDP per capita between 1998 and 2019, it has gone up 8.5 times. Yet, if we look at rural wages, it has gone up only 5.4 times.
The fact that inequality has gone up commensurate with growth does not mean we should abandon growth. Since the early 1990s, the percentage of people below the poverty line has gone down from nearly 45% to nearly half of that in the last year for which official statistics are available, 2011–12. 2 Computed according to the Tendulkar method. According to the Rangarajan method, the all-India poverty headcount ratio was 29.87% in 2011–12. According to the draft National Statistical Office (NSO) survey on the distribution of consumption expenditure in the rural and urban areas of the country for 2017–18 (75th Round) — which was not officially published — the all-India poverty headcount ratio in 2017–18 was 22.8% according to the Tendulkar method and 30.92% according to the Rangarajan method, both showing marginal increases with respect to 2011-12 (Subramanian 2019). Therefore, while growth may have increased inequality, it has also reduced poverty.
The discussion so far brings out an important tension that is often reflected in our policy debates: the growth-based narrative versus the inequality-based narrative. The problem with focusing on a single narrative is that without understanding the relationship between growth and inequality, mechanically trying to reduce inequality or increase growth might lead us into a blind alley.
Let us look at the inequality-based narrative through, for example, a redistribution argument. Redistribution might reduce inequality but it will fail to make a lasting dent on poverty. The ratio of total billionaire wealth to GDP stood at 22% in 2021 (starting with 1% in the mid-1990s), a tidy amount considering that the tax revenue as a percentage of GDP is only about 12%. 3 The data on total billionaire wealth ($569 billion) is obtained from Forbes. The GDP of India in 2021 (Rs.197,456.7 billion) is obtained from NSO, MOSPI and converted to $2,663.15 billion (using the exchange rate $1 = Rs 74.14 as of 20 June 2021). If we took the total billionaire wealth and divided it among the poor (139 million Indians), each individual would receive Rs. 317,930 ($4,288). 4 The estimate of the extreme poor in India, 139 million, is obtained from the World Bank. Thus, the amount transferred to each individual under extreme poverty, for this redistribution exercise, is calculated as $596 billion/139 million = $4,288 (alternatively, Rs 317,930, using the exchange rate as of 20 June 2021). The poverty line is calculated based on the Rangarajan Committee estimates for 2011–12. The rural monthly poverty line, adjusted for 5% inflation until 2020–21 is Rs 1,489, while the urban monthly poverty line, adjusted for 5% inflation until 2020-21 is Rs 2,187.
The problem with the growth-centred narrative is that while growth is necessary for poverty alleviation, it is not sufficient.
While this sounds like a large amount, a poor individual living in a rural area can be brought up to the poverty line with this amount for 18 years and a poor individual in an urban area can be brought up to the poverty line with this amount for 12 years. Considering the life expectancy of an individual at birth in India, which is 70 years, this redistribution, while offering temporary support, would not make a lasting dent on poverty. More importantly, this will be a one-time affair.
Before we jump to the other end and conclude that growth will eventually lift everyone above poverty and that inequality does not matter, we should pause. Let us now take a look at the growth-based narrative in isolation. The fact is that it takes a long time for the benefits of growth to trickle down and make a real difference to the lives of the poor. To see this in another way, suppose instead that we increase the income level that defines the poverty line by 20% (still an extremely low amount). Yet, according to the latest estimates we have of poverty, even after several decades of relatively high growth since the early 1990s, more than 50% of the population falls below this threshold.
The problem with the growth-centred narrative is that while growth is necessary for poverty alleviation, it is not sufficient. For example, suppose we ignore the pandemic and contraction in GDP, and assume a dream annual growth rate of 10%. It will take 22 years of sustained 10% growth per year in incomes to bring an individual who is now right on the rural poverty line up to merely the level of per capita income (which is low by global standards to start with). For an individual on the urban poverty line, this would take 18 years. And, no country in history has had two decades of sustained double-digit growth!
The real questions then are: What makes growth inclusive? And, to the extent this does not happen automatically, what policies can facilitate inclusive growth? Kuznets argued that the process of growth would reduce inequality in the long run. He argued that with capital accumulation, the demand for labour would eventually go up sufficiently and, thus, increase wages. The returns from acquiring skills would go also up, which would not only encourage greater investment in human capital on average, but also open up doors for upward mobility. All of this would tend to reduce inequality as well increase growth.
[W]hen inequality creates impediments for the poorer sections to take advantage of economic opportunities… it hurts the prospects for growth.
Focusing on mobility allows us to step beyond the stale debate about inequality versus growth. It also highlights what aspect of inequality is especially harmful. Inequality directly hurts growth prospects when the potential of those who are born poor but are talented is wasted. Instead of becoming successful entrepreneurs and creating jobs, they spend their lifetime in low-return occupations. In a society where everyone has a minimum decent standard of living and opportunities are available for all, inequality can still arise due to differences in skill, effort, enterprise, and luck. In such a society, our views on inequality and policies relating to it may largely be a matter of ideology or what kind of social values we have: for example, the degree of our concern for the disadvantaged or aversion to inequality. However, when inequality creates impediments for the poorer sections preventing them from taking advantage of economic opportunities (for example, by not being able to send their children to good schools), it hurts the prospects for growth . Of course, economic inequality is not the only barrier to mobility and social norms relating to gender and caste, for example, can accentuate the problems significantly.
Is there evidence for limited upward mobility in India? Evidence suggests that while average levels of income and educational outcomes have improved following economic liberalisation, upward mobility in India has remained low over time (Asher, Novosad, and Rafkin 2021). Those who are born in poorer sections tend to stay poor, leading to persistence of inequality.
[W]hile average levels of income and educational outcomes have improved following economic liberalisation, upward mobility in India has remained low over time.
There is also evidence of limited intergenerational upward mobility across caste, location, and gender (Asher, Novosad, and Rafkin 2021). Across caste lines, upward mobility has risen for Scheduled Castes (SCs) and Scheduled Tribes (STs) owing to affirmative action and has remained high for those from forward castes and Other Backward Castes (OBCs) over time. Among the various sub-groups, however, Muslims experience the least upward mobility. 5 The authors divide the population into Scheduled Castes, Scheduled Tribes, Muslims, and forwards/others. Across locations, urban and southern regions with high average educational levels experience the highest upward mobility. Also, regions with high values of development attributes (education, consumption, manufacturing employment, and school supply) have higher upward mobility, while regions with caste segregation and land inequality have lower upward mobility. Across gender, men experience higher upward mobility than women. Looking at gender and spatial differences together, however, reveals that women in urban areas have greater upward mobility than men; while men in rural areas have greater upward mobility than women.
So, India surely has an inequality problem, driven by limited upward mobility, itself driven by unequal opportunities. This leads to an uneven distribution of gains from growth. The thrust of our development policy initiatives should therefore focus on how to deal with inequality of opportunity. Clearly, a part of the answer is to enable the poor better access to health and education. But this is not possible without a sufficient increase in tax revenue. In particular, we need a more conscious effort to bring the rich under the tax net. After all, the upper and lower tails of the distribution of income and wealth are interconnected.
The thrust of our development policy initiatives should therefore focus on how to deal with inequality of opportunity.
There is a popular misconception that only the rich pay taxes. But in India, direct taxes (personal income tax and corporate tax) yield only about half of the total revenue, with rest coming from indirect taxes (GST, excise, and customs), and the pandemic has raised the relative importance of the latter. Additionally, over the last decade, the share of corporate taxes in total tax revenue has decreased, and those of indirect taxes and income taxes have increased. The fact that multinational corporations can shuffle their profits around countries makes unilateral moves by any country on corporate taxes somewhat risky. Yet, in a positive move in this regard, the G7 group of advanced economies have recently reached a two-pronged historic agreement. First, the agreement aims to ensure that companies are paying greater taxes in countries of operation as opposed to profit declaration. Second, they aim to set a global minimum corporate tax rate of 15% to avoid countries undercutting each other.
If we consider wealth taxes, while a net wealth tax was imposed in India since the late 1950s, it was removed in 2015 (the last applicable rate was 1% on net wealth exceeding Rs. 3 million) and replaced with an additional 2% ‘super rich surcharge’ on those earning over Rs 10 million annually. Across the current 37 OECD member countries, the number of countries collecting revenues from taxes on net wealth taxes of individuals grew to 12 in 1996 from eight in 1965, before declining to five as of 2019. Among the five countries collecting wealth taxes in 2019 (Colombia, France, Norway, Spain, and Switzerland), the share of revenue from net wealth taxes in total tax revenues ranges from 0.19% in France to 3.79% in Switzerland. 6 It is interesting to note that of the eight countries we presented statistics on wealth and income inequality (Tables 2 and 4) only France has a net wealth tax at the rate of 1.5%.
[F]rom the point of view of creating more equality of opportunity, a compelling case can be made to have at least some forms of taxation.
To conclude, there are many indicators of inequality and India’s record in each of them leaves sufficient grounds for concern. In particular, wealth reflects the cumulative accumulation of the results of economic advantage on the part of the rich over generations. Hence, from the point of view of creating more equality of opportunity, a compelling case can be made to have at least some forms of taxation. Given the alarming state of wealth inequality, there should be a greater emphasis on wealth taxes, such as capital income taxation, net wealth taxation, and transfer taxation (inheritance tax, estate tax, and gift tax). These would generate tax revenue that could allow greater investment in health, education and infrastructure, all of which would create greater equality of opportunity. This will also strengthen the foundations for a more dynamic economy as these would be investments in raising the overall growth potential. Such policies would go directly after the main source of inequality of opportunity — wealth — and ensure equality of opportunity.
A shorter version of this article was published earlier in Forbes, India. I thank Ramya Raghavan for excellent research assistance.