By D. Narayana, Amitesh Angrish, Saanvi Sharan, Priyasha Prusty, and Rupanjana Roy
Introduction
Gross domestic product (GDP) and related estimates are key indicators for policymakers, investors, and analysts. The GDP acts as a reality check for the government, forms the denominator in deficit measures, guides monetary policy decisions, and significantly influences stock market movements. Given its importance, timely and accurate GDP estimates are a key responsibility of the statistical office. Over time, nations have transitioned from annual GDP reporting to quarterly estimates, and more recently, to high-frequency data releases to provide real-time insights into economic performance.
In India, the National Statistical Office (NSO) publishes GDP estimates—a first advance estimate (AE) in the first week of January; a second AE in the last week of February; a provisional estimate (PE) at the end of May; a first RE (RE) one year later in the last week of February; and a second RE almost two years later. The second RE is considered the final estimate of the GDP as there are no further revisions.
In addition, the Government of India projects the GDP for the upcoming year in its annual budget based on the latest first AE. These revisions often result in large gaps between initial projections and final figures, raising doubts about early estimates. This article examines India’s GDP estimate changes from the first AE to the second RE. Further, by examining sectoral contributions and trends in gross value added (GVA) revisions, we seek to provide deeper insights into the reliability of early estimates and their broader economic implications. The data are drawn from the regular press releases of the NSO and budget papers.
Projection and Reality
In the first week of January every year, the NSO publishes the first AE based on data available till December of the financial year. The finance ministry while presenting the budget of the subsequent year (April-March) makes known the projected GDP by assuming a certain growth rate. For example, the statement in the Budget at a Glance of 2025-26 reads, “The GDP for FY 2025-26 is estimated at Rs 356,97,923 crore, which is 10.1% over the REs for FY 2024-25 of Rs 324,11,406 crore released by NSO.”
As may be seen, the finance ministry is casual about the projection as it provides no explanation of how the growth rate is arrived at. Further, the “REs” it mentions do not exist; what exists is the first AE. However, the Statements of Fiscal Policy as required under the Fiscal Responsibility and Budget Management Act, 2003 makes the correct reference to the first AE. With these clarifications, we carry out a comparison of the projected GDP with the first AE that is published one year down the line. Both are then compared to the second RE. Comparisons are at current prices.
The projected GDP for the year to come is an estimate based on the first AE for the current fiscal year, which too is a projection based on limited data of nine months of the year. The second RE is, in some sense, the actual GDP as the revisions, after going through a five-stage journey, end with it. Until recently, the final estimate used to be a third RE. Now, it ends with the second RE. Thus, under-estimates or over-estimates can happen at any of these stages.
The first AEs [of GDP] in comparison with the second REs are also under-estimates till 2018-19 and over-estimates from 2019-20. The over-estimation is nearly 2% annually.
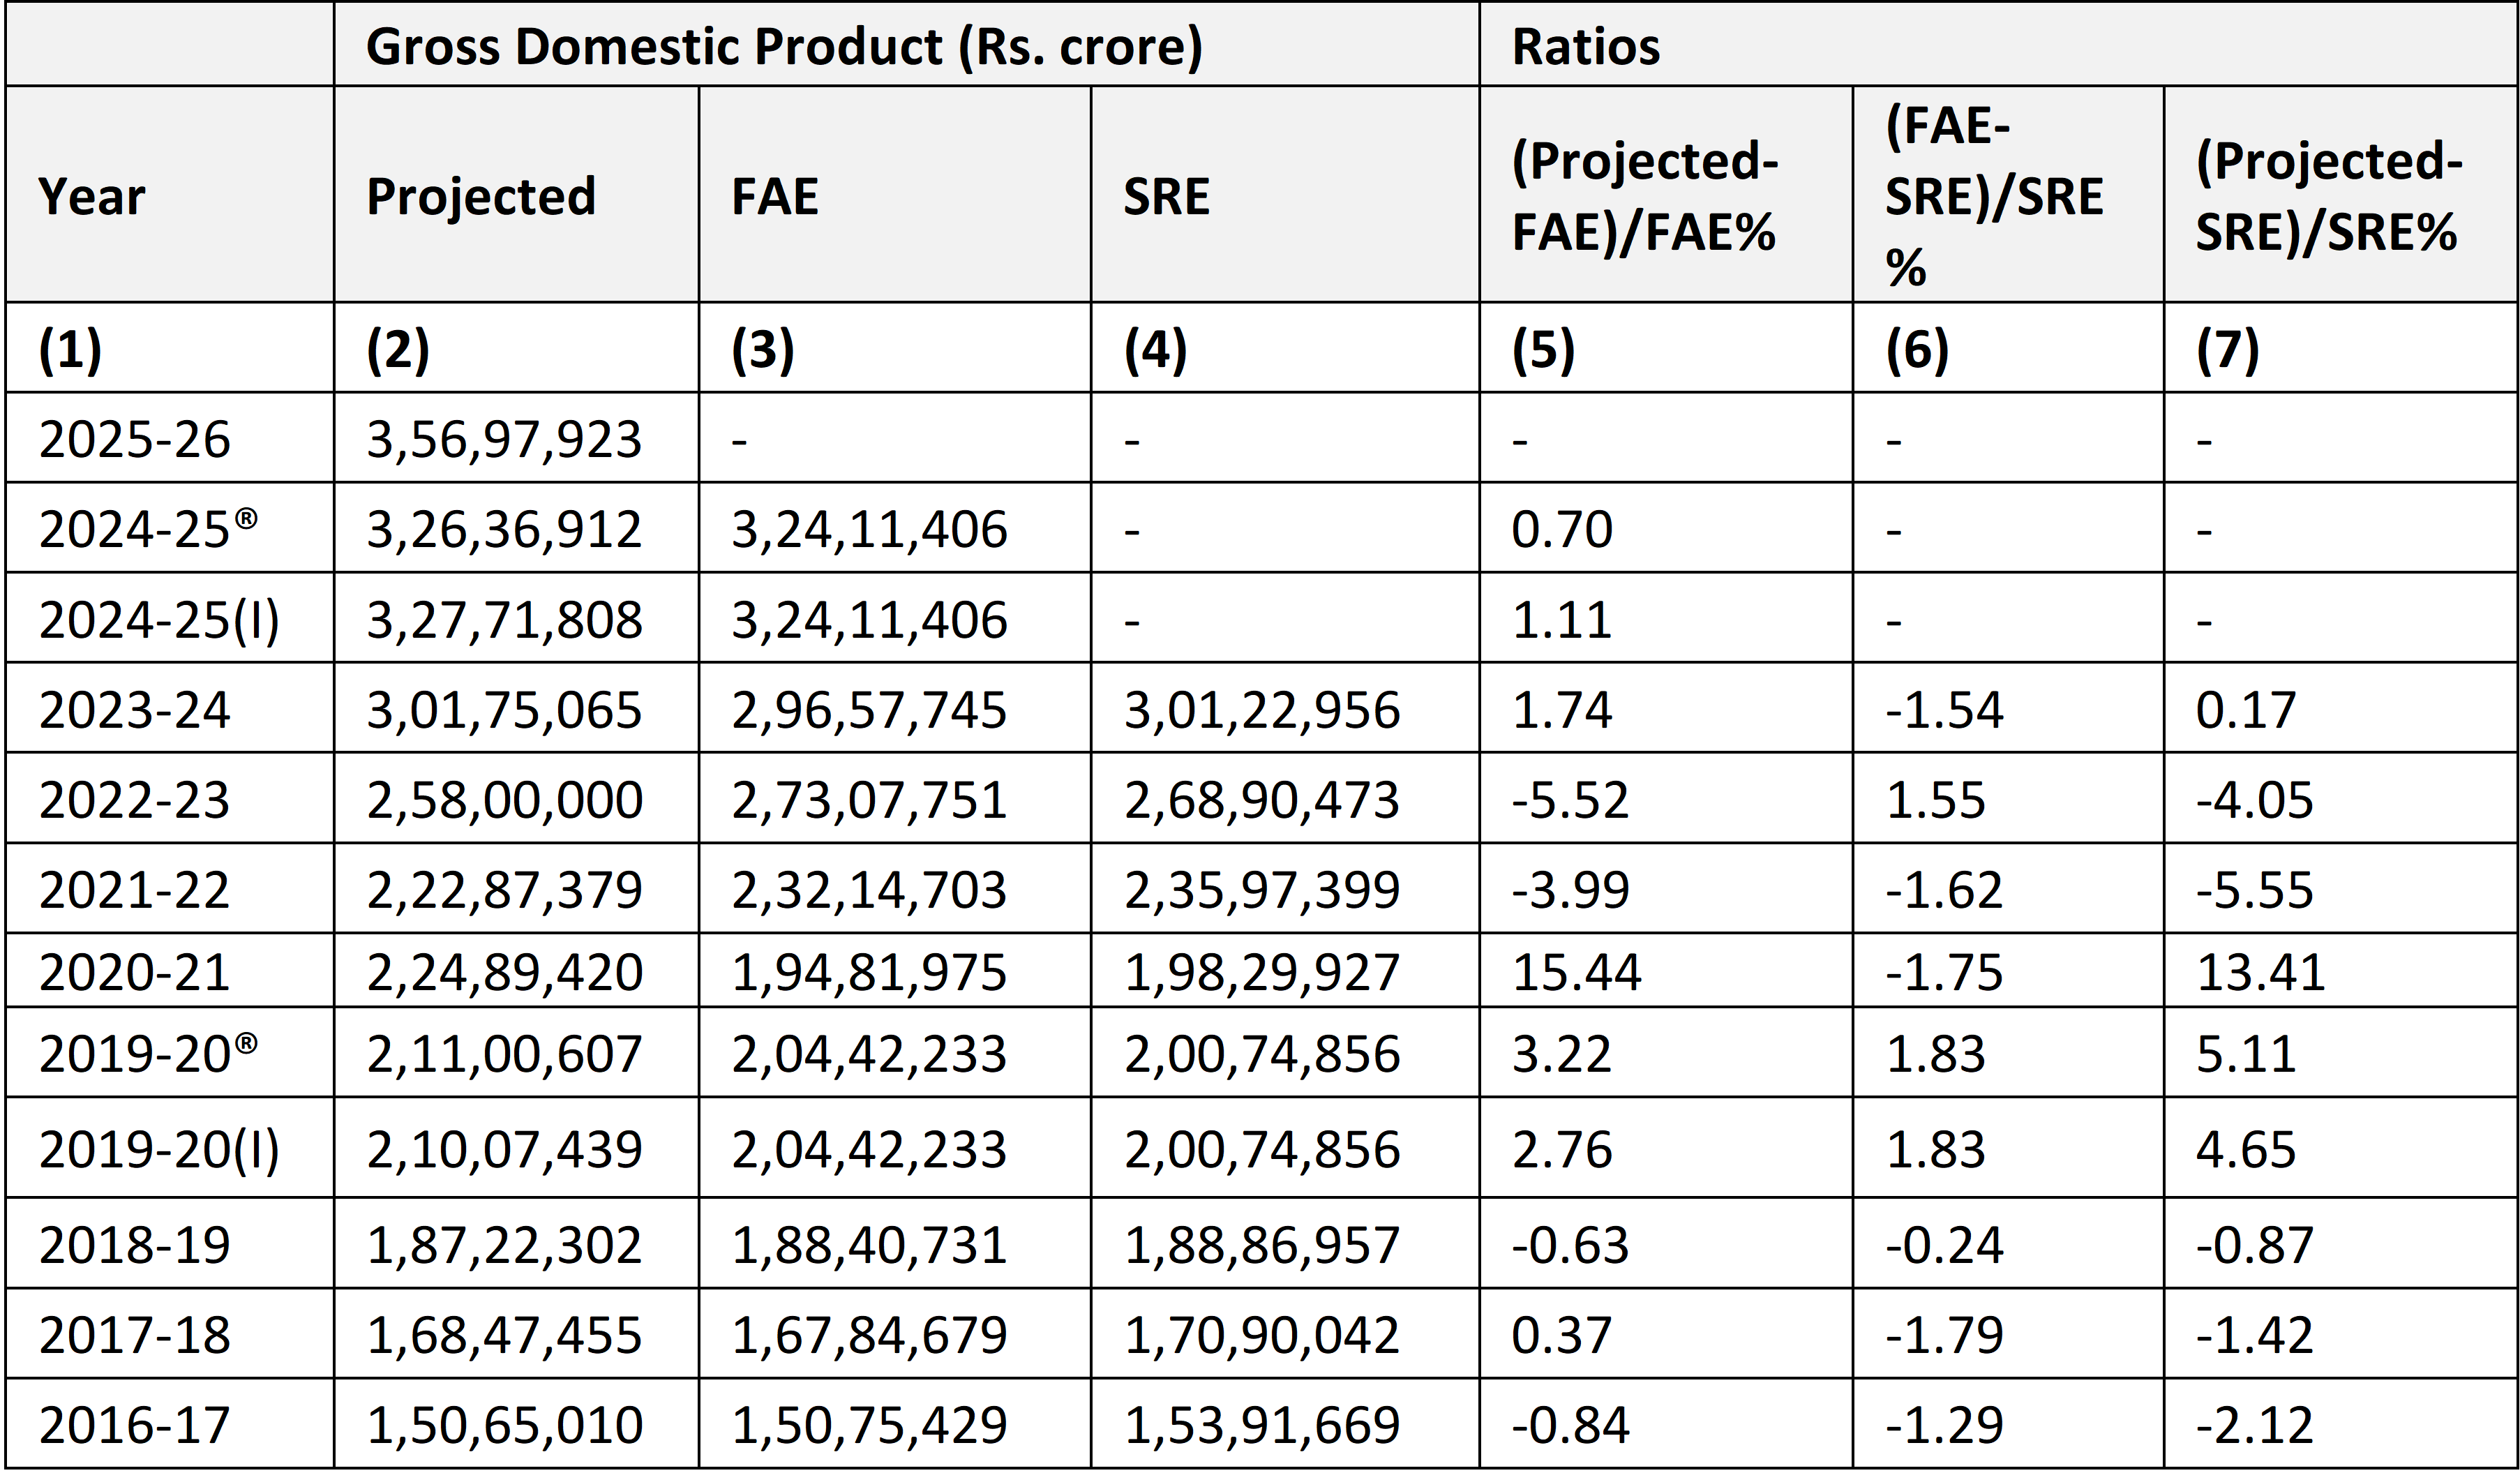
We focus on two stages—the projection to first AE, and from first AE to second RE. The projected GDP was an under-estimate until 2018-19, then became an over-estimate from 2019-20 (Table 1). In other words, GDP projections exceed first AEs. The finance ministry often seems to project GDP growth which is 2–3% higher than actual. The exceptions are three years—2020-21, 2021-22, and 2022-23. In 2020-21, the Covid-19 lockdowns and the restrictions on movement hit the economy after the GDP was projected in February. The next two years were recovery years with an uncertain pace of recovery. These three years are excluded from the analysis.
The first AEs in comparison with the second REs are also under-estimates till 2018-19 and over-estimates from 2019-20. The over-estimation is nearly 2% annually. The two together—over-estimation of the projected GDP in relation to the first AE and over-estimation of the first AE in relation to the second RE—add up to over-estimation of the projected GDP in relation to the second RE of between 2 and 5% (Table 1, column 7). Thus, it is not only the finance ministry but also the NSO that over-estimates the first AE of the GDP.
Over-estimation allows larger deficits while keeping deficit-to-GDP ratios within limits. The real, or the actual deficit-GDP ratio will then turn out be higher than the budgeted one two to three years after the budget has been presented. Budget and first AE figures are highly visible, while actuals come later with little impact. These over-estimates affect policies, Reserve Bank of India (RBI) rates, and market behaviour.
Table 1: Projected GDP in relation to First AE and Final Estimate
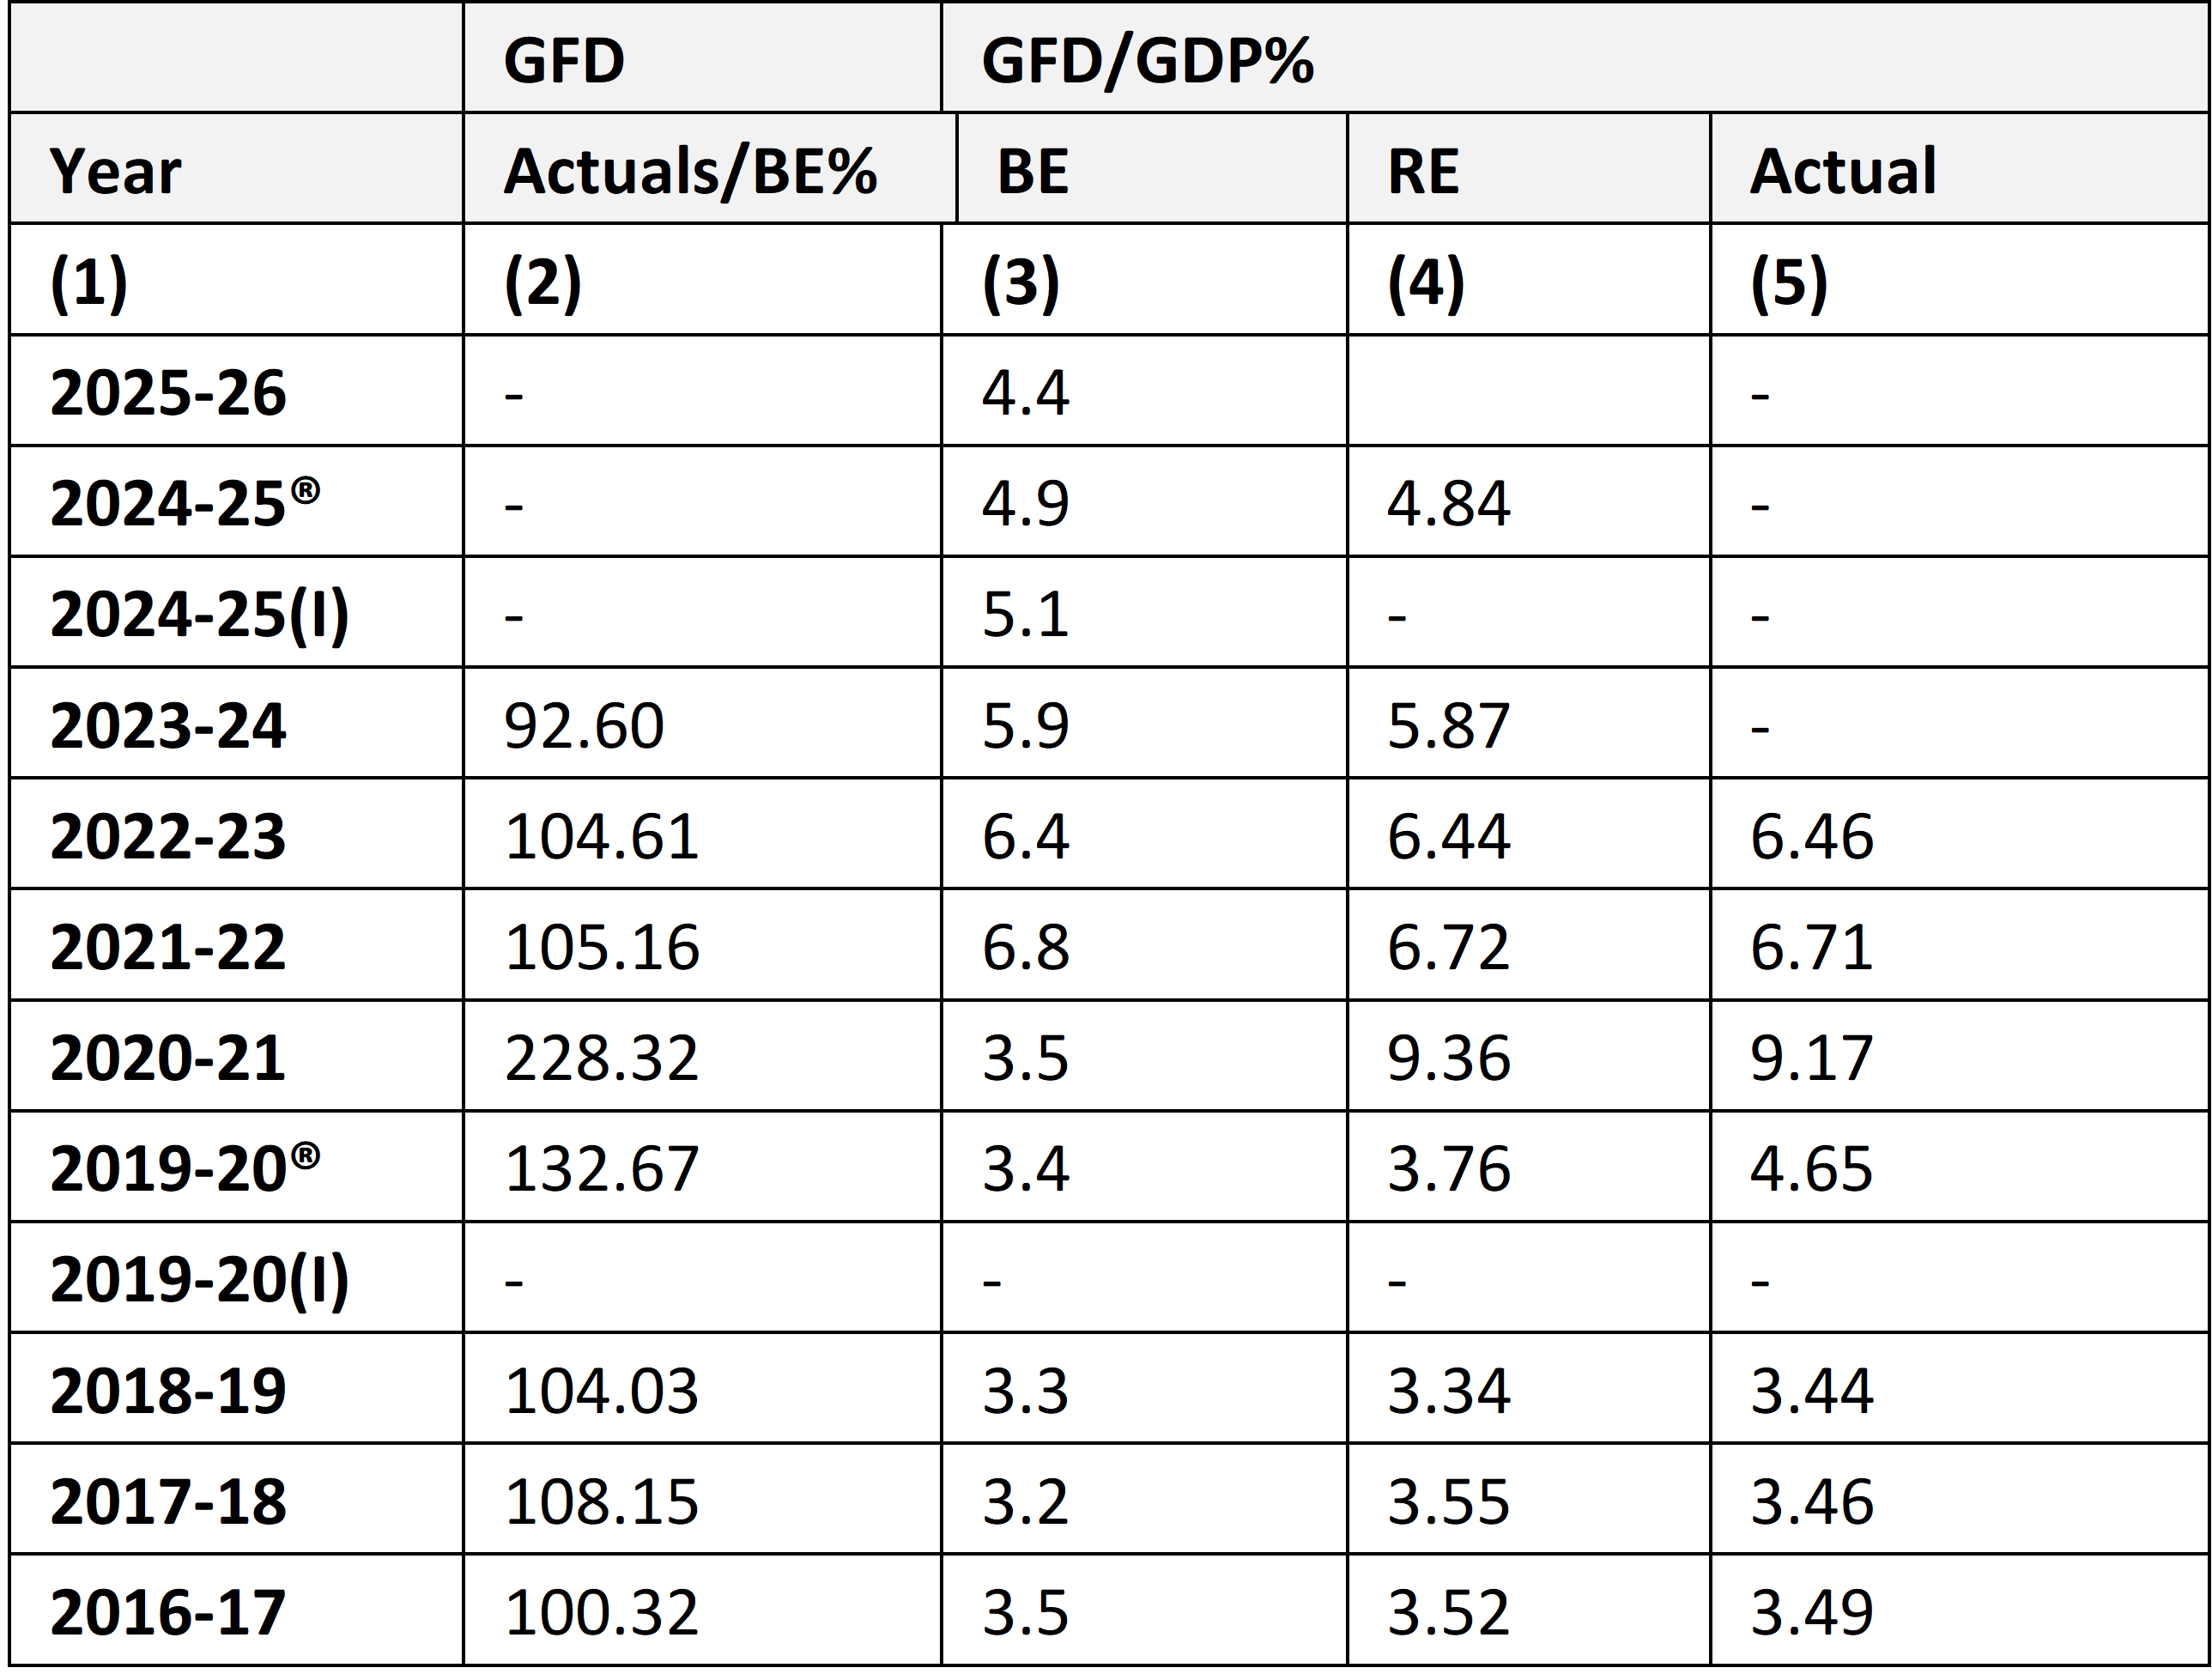
The interpretation of deficit-GDP ratios needs to be carried out after a careful look at the evolution of deficits from the budget estimates (BE) to the actuals; they may rise or fall between the two points of time, independent of the movement of the GDP. It may be seen from Table 2 that the actuals of GFD were higher by 4 to 8% than the budgeted figures, except in 2023-24. The figure for 2023-24 needs to be interpreted with caution as the GDP we now have is the first RE. The higher actual deficits and lower final estimates of the GDP could eventually push the ratio of GFD to GDP higher for 2023-24.
Table 2: Deficits – Budgeted and Actuals, 2016-17 to 2025-26
Thus, we have over-estimates of the actual or GDP in recent years. Both the projected GDP and the AE are over-estimates. Along with the actual GFD being higher than the budgeted GFD, the actual GFD to GDP ratio is higher than the budgeted number. This has key implications for policymaking at all levels.
Components of GDP
GDP may be decomposed in various ways. First and foremost, it is the sum of gross value added (GVA) and net product taxes. If GDP is over-estimated or under-estimated, we must investigate the GVA and the net product taxes to find out which factor contributes the most to it.
Table 3: Comparison with SRE of GVA, Net Product Taxes, PFCE, GFCE, and GFCF
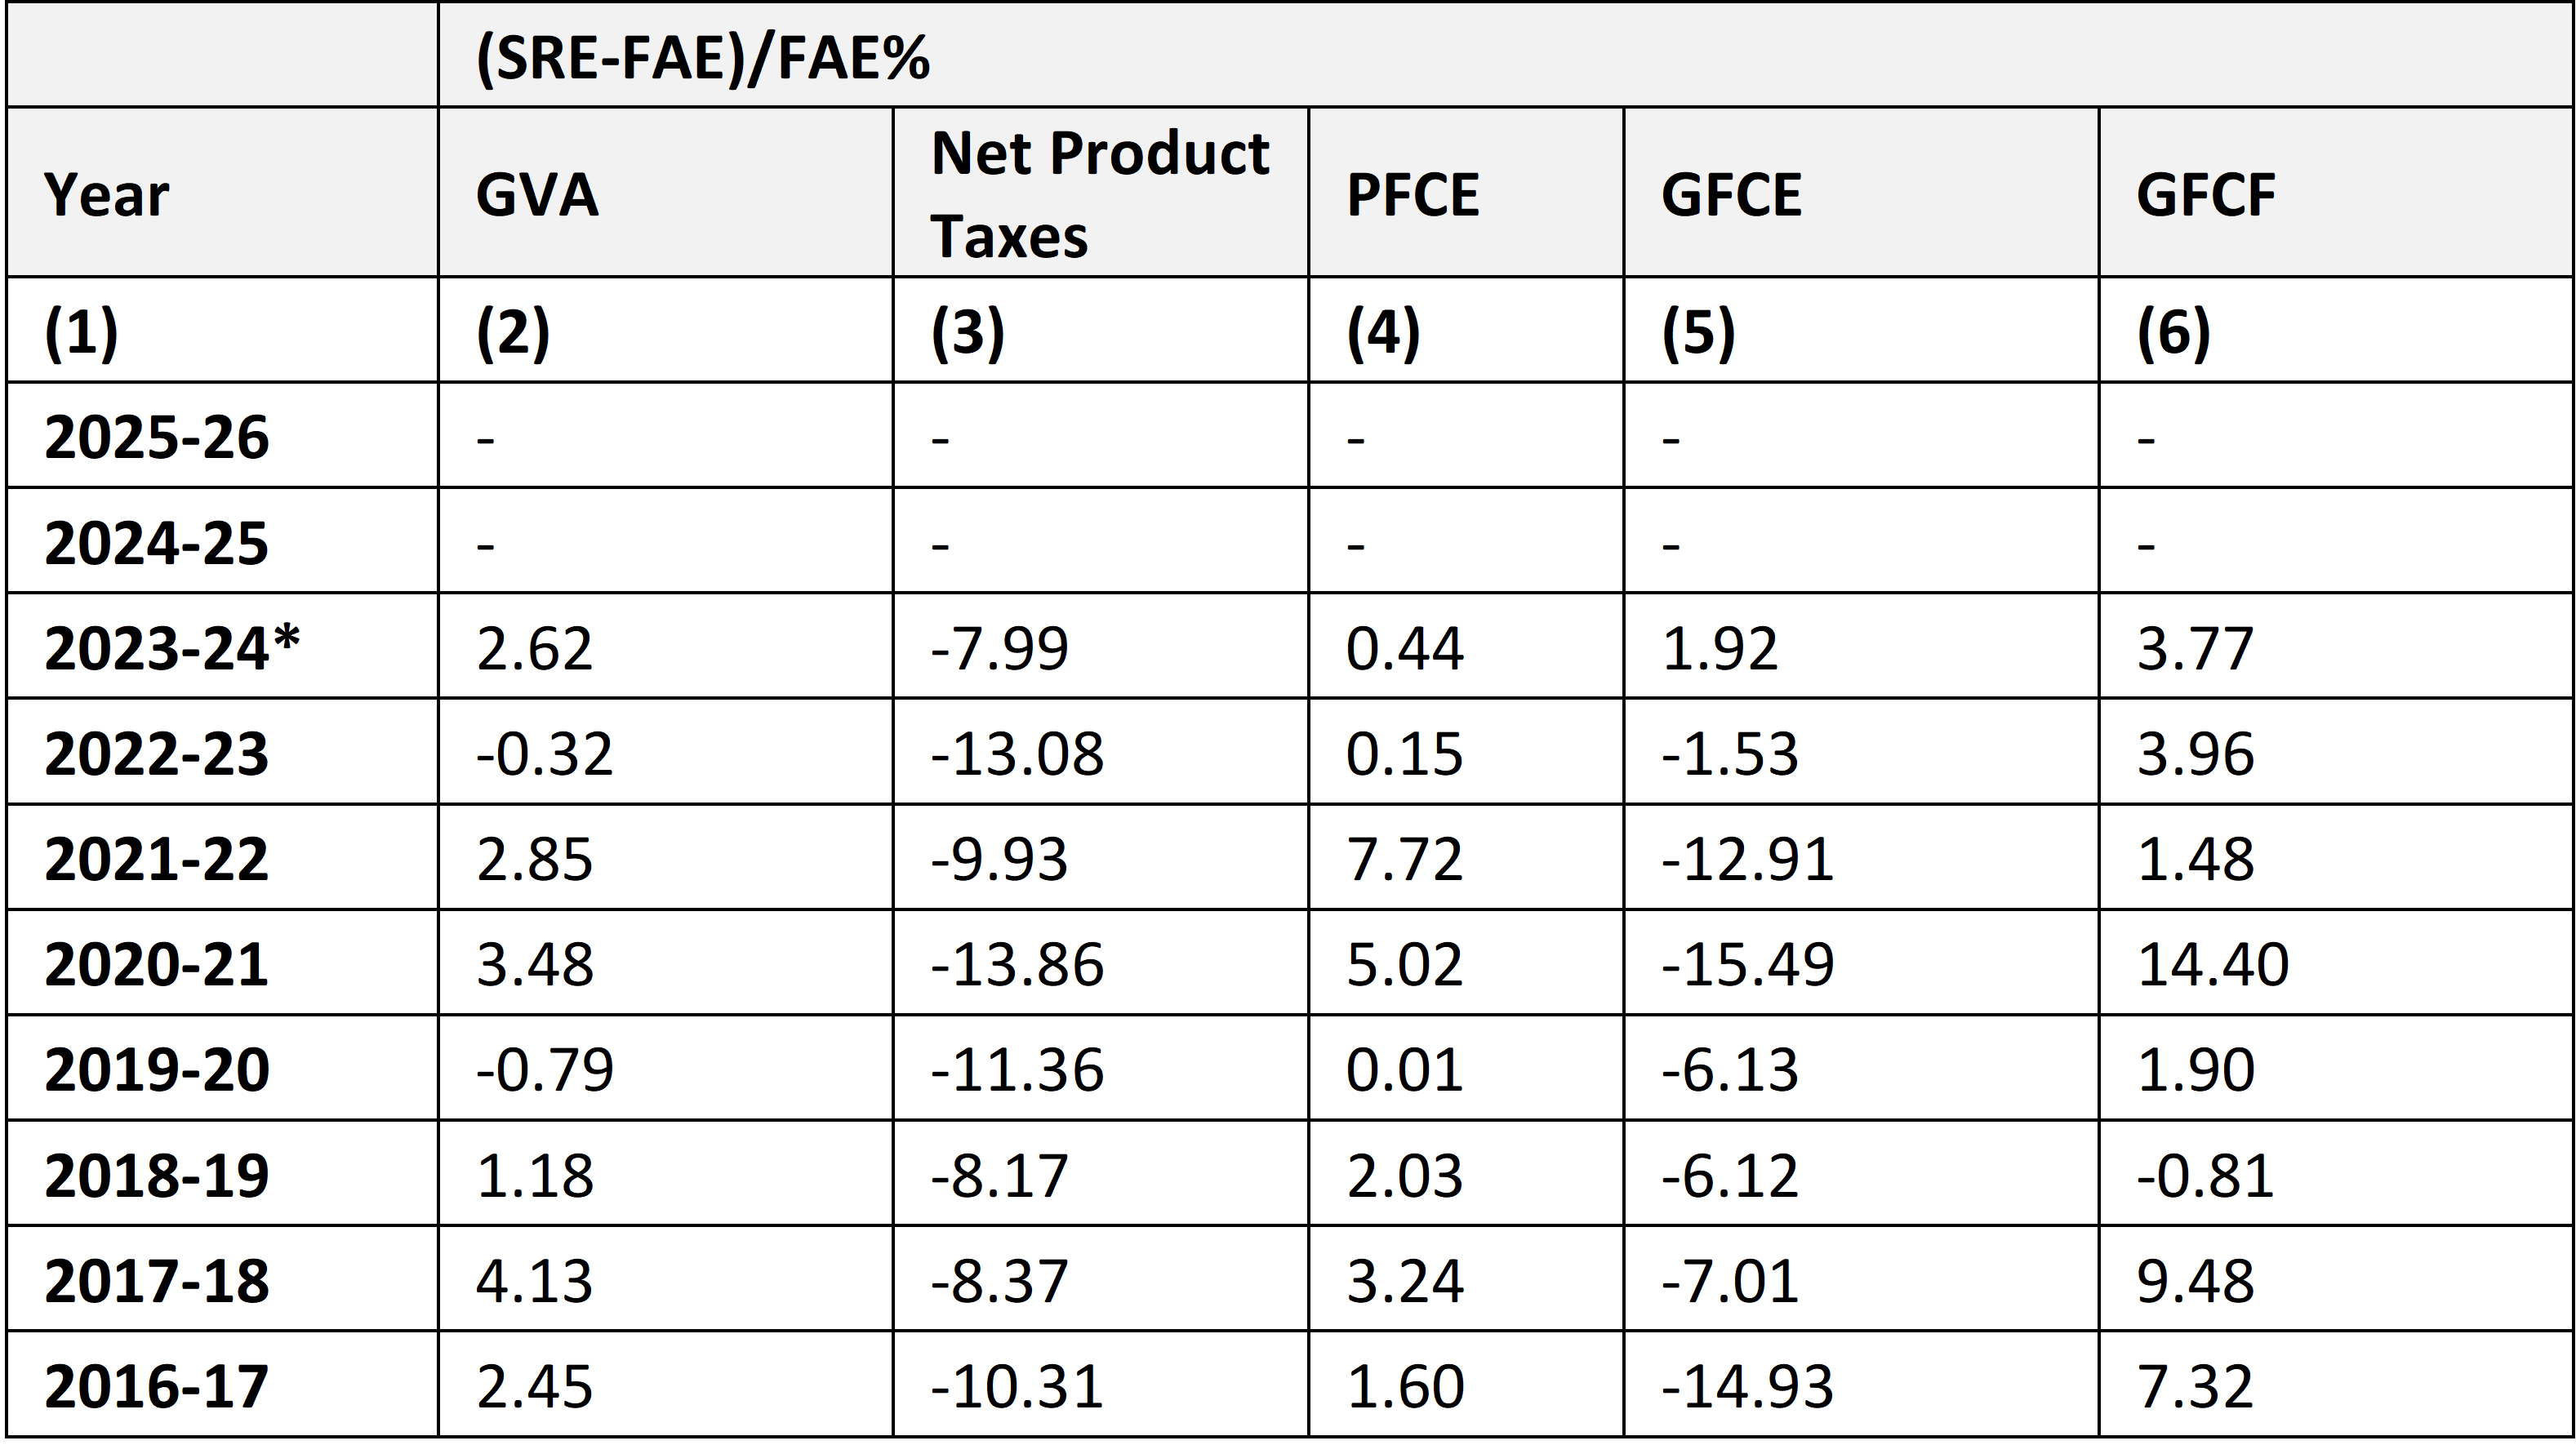
As may be seen from Table 3, column 2, the first AE of GVA is an under-estimate of the final estimate; that is, the second RE. (Here, positive indicates the second RE is higher than first AE.) This repeats year after year without fail; the only exceptions being 2019-20 and 2022-23 when the two estimates were close to each other. The magnitude of under-estimation is also high—it is of the order of 2% or higher.
The other component of GDP, product taxes net of subsidies, reported in the first AE is a severe over-estimate of its final estimate. This repeats every year in the analysis period. And the magnitude of over-estimation is very high—to the order of 8% or more. As the GVA is an under-estimate and the product taxes are an over-estimate, the estimate of the GDP is indeterminate, sometimes turning into an over-estimate and sometimes into an under-estimate.
Trends show over-estimation occurs in government-linked entities such as net product taxes and government final consumption expenditure. Entities involving households and private institutions report under-estimation.
GDP is also the sum of private final consumption expenditure (PFCE), government final consumption expenditure (GFCE), and gross fixed capital formation (GFCF) from the expenditure side. How do the estimates of these variables behave? It may be seen from Table 3, column 4, that the first AE of PFCE is a severe under-estimate because the second RE-first AE is a positive value in all the years for which analysis has been carried out. The magnitude of under-estimation was as high as 7.72% in some years.
Similar under-estimates may be observed of GFCF, as presented in column 6. In this case, the magnitude rose up to 14.40%. The severe under-estimate is not confined to the Covid-19 years—in 2017-18, it was almost 10%. But government final consumption expenditure shows that first AEs are severely over-estimated in most of the years. The magnitude of over-estimation was as high as 15.49% in the Covid-19 year of 2020-21. This also occurred in 2016–17 with a more than 15% over-estimation.
Trends show over-estimation occurs in government-linked entities such as net product taxes and GFCE. Entities involving households and private institutions report under-estimation. This is curious, since government data should produce more accurate estimates.
Sectoral Estimates
GVA is a sum of value added in the industrial sectors. How do the sectoral estimates behave? A first look at Table 4 suggests that for some sectors it is a positive sign in all the years and for others it is a negative sign in almost all the years. A positive sign is an indication of under-estimation of the first AE and a negative sign of over-estimation.
For all the sectors, except mining and quarrying and public administration and defence, first AEs are severe under-estimates of the actuals in all the years. Some sectors like manufacturing and trade showed over-estimates earlier but recent first AEs are under-estimates. The magnitude of under-estimation is not small; it is more than 5%. In agriculture, under-estimation has remained consistently high at more than 10% in most of the years. In mining and quarrying, over-estimation has ranged between 10 and 30%. In public administration and defence, over-estimation has remained above 5% in most of the years, reaching almost 11% in the Covid-19 year of 2020-21.
Table 4: First AE in Comparison with Second RE of Sectoral GVAs
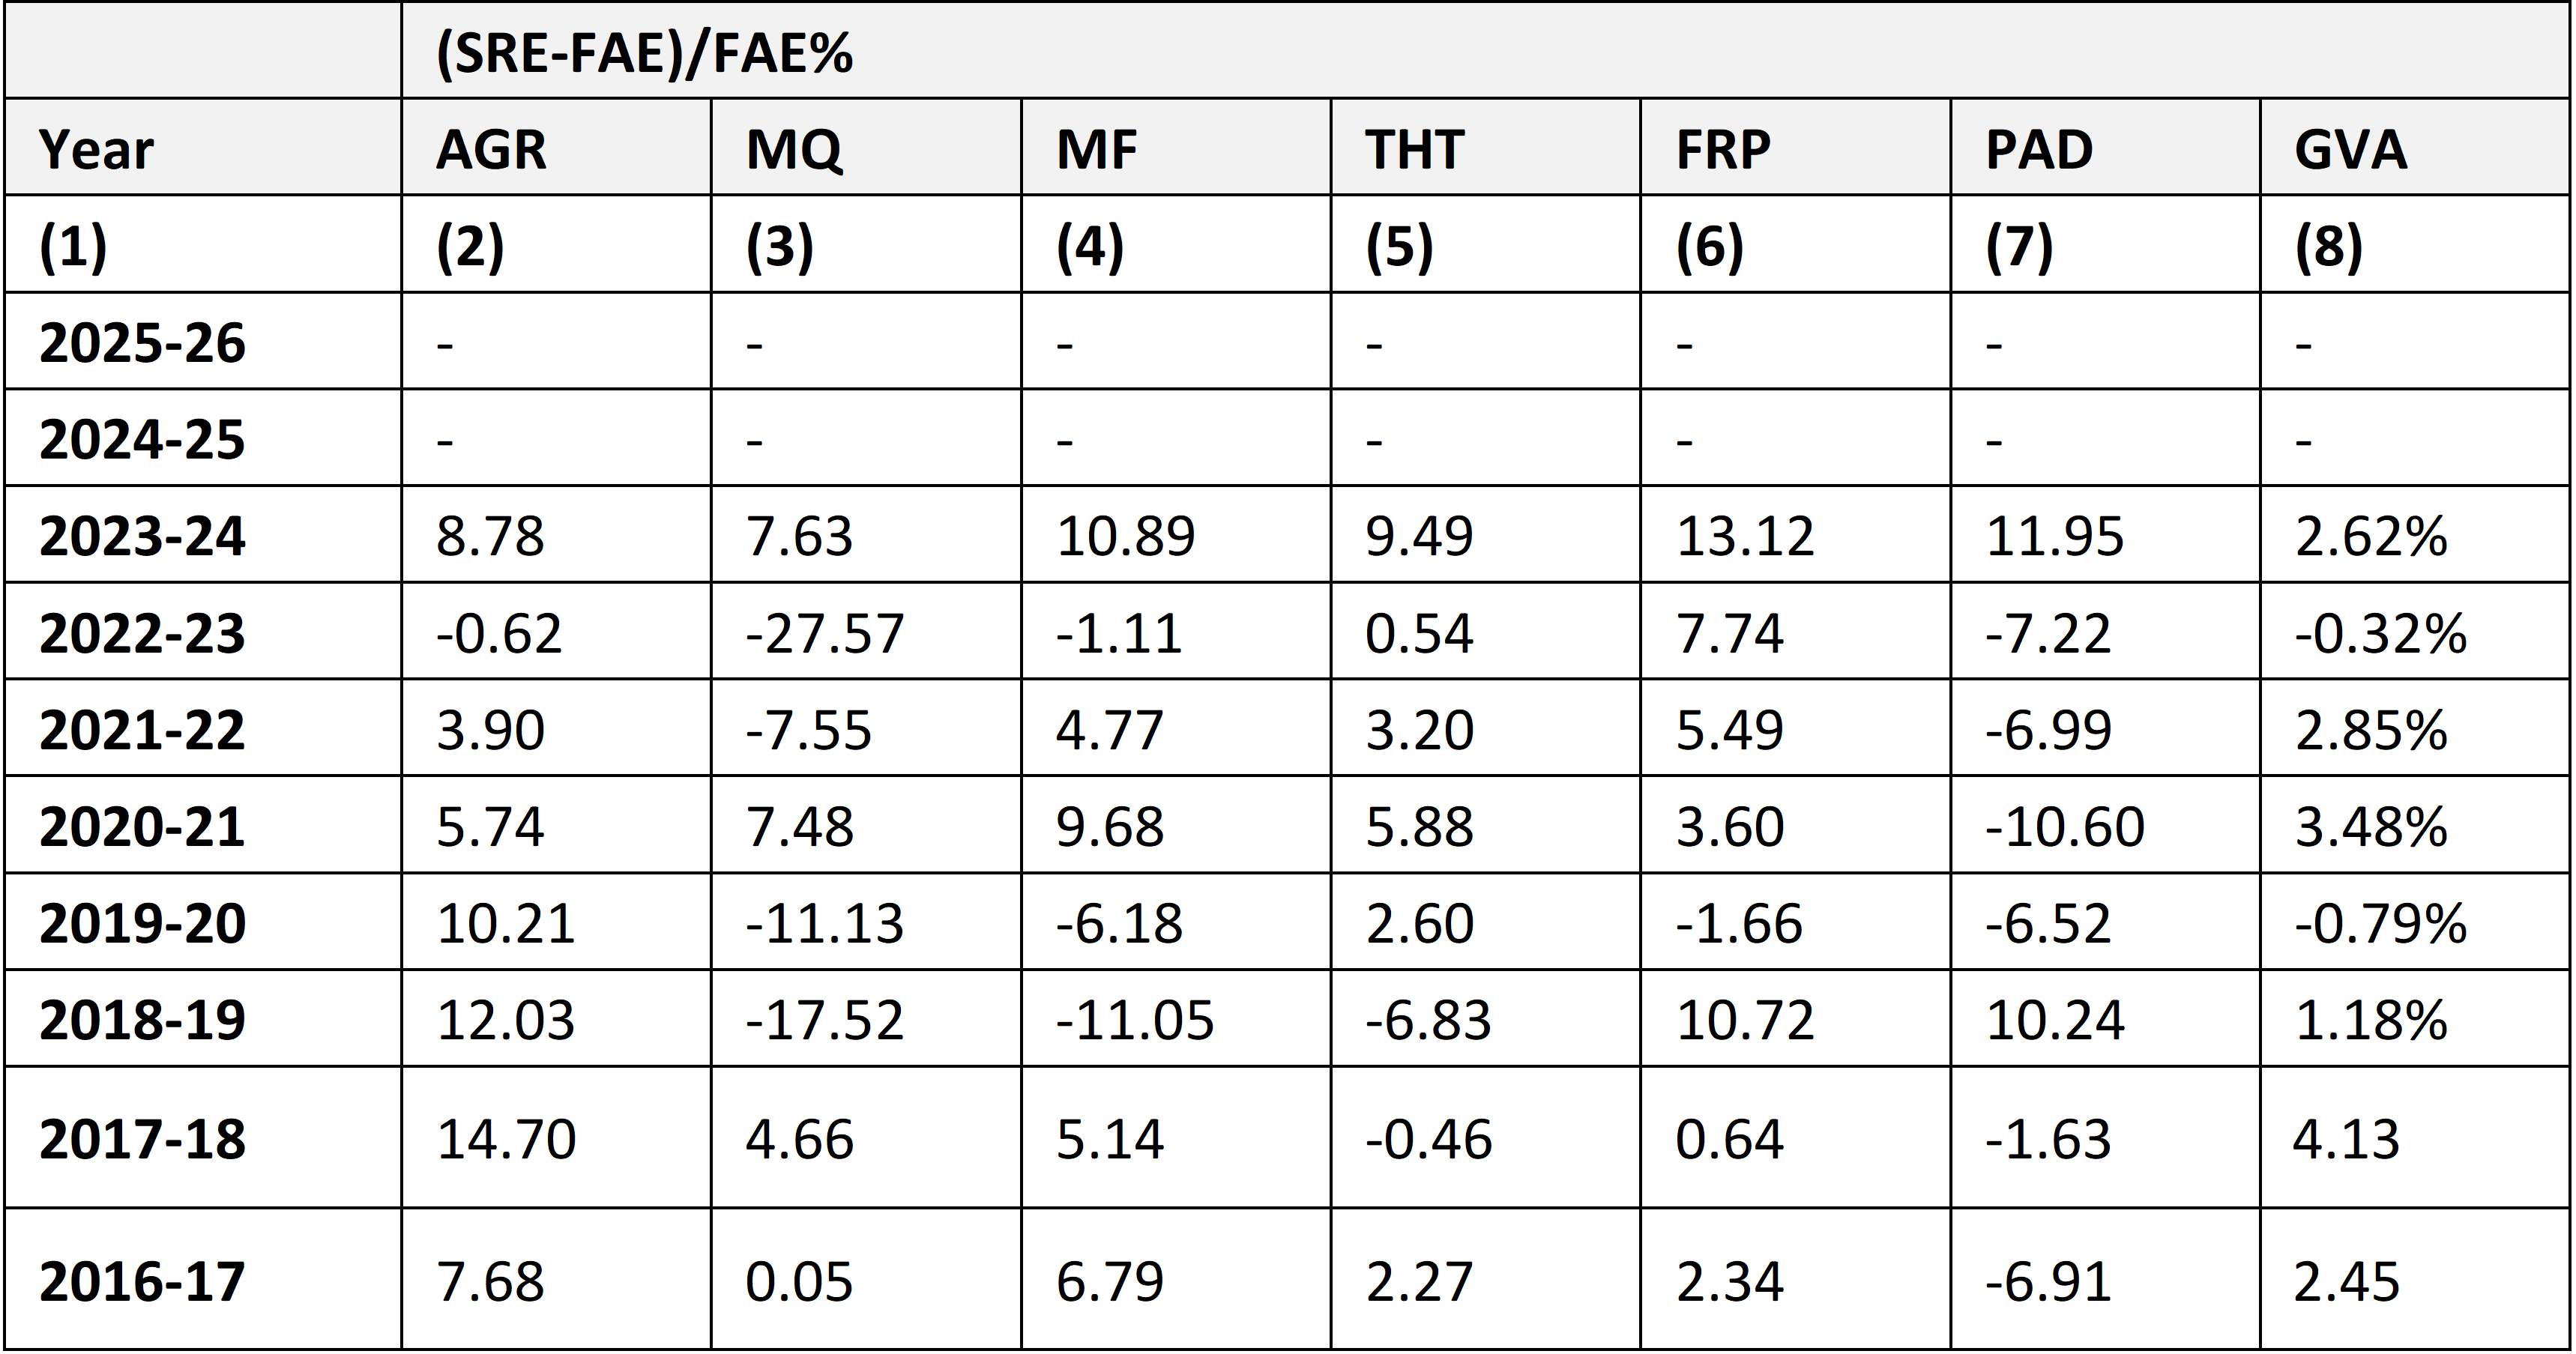
Sectoral analysis of the GVA revisions is an eye opener. In all the sectors, it is a case of either over-estimation or under-estimation, suggesting that the methods used for estimation suffer from serious infirmities. Again, what are curious are the cases of mining and quarrying and public administration and defence. The former is dominated by public sector enterprises, and the latter, by the government. Both should have accurate, updated accounts. Yet, over-estimation remains highest. This is very similar to what was observed in the case of net product taxes and GFCE.
Conclusions
Projected and first AEs of GDP are key to gauging economic activity, setting rates, and guiding markets. Few have examined how projections and first AEs compare with second REs revealed two years later. Our analysis shows that both are over-estimates—the magnitude of over-estimation is of the order of 2 to 5% since 2019-20.
Net product taxes and government final consumption expenditure are severe over-estimates whereas gross value added, private final consumption expenditure and gross fixed capital formation are severe under-estimates.
Turning to the components of GDP, net product taxes and government final consumption expenditure are severe over-estimates whereas gross value added, private final consumption expenditure and gross fixed capital formation are severe under-estimates. The magnitudes of both over-estimation and under-estimation are substantial.
It is curious that the sectors where government accounts play a major role produce severe over-estimates while under-estimates are generated where estimation is founded on surveys of households and private entities. We do need better early estimates and improved methods to enhance the credibility of economic policy.
D. Narayana is Professor of Eminence, School of Social Sciences, M.S. Ramaiah University of Applied Sciences, Bengaluru; a Amitesh Angrish, Saanvi Sharan, Priyasha Prusty, and Rupanjana Roy are BSc. (Economics) students at M.S. Ramaiah University of Applied Sciences.