

The state of Haryana will mark the 60th anniversary of its formation as a separate state on 1 November 2026, with much to celebrate. Haryana was formed around the same time as the onset of the green revolution in India. It was a key beneficiary of the green revolution, contributing to the production of wheat and rice, and becoming the second state (after Punjab) with a large agricultural surplus in the country.
Haryana has overtaken Punjab on a range of economic indicators over the years, largely because it diversified more rapidly into industry and services. It has emerged as a major industrial hub, especially in automobiles, electronics, pharmaceuticals, and information technology (IT).
Although Punjab started out with a larger economy, its per capita income had fallen behind Haryana’s by 2006–07. Since economic liberalisation in 1990–91, Haryana has recorded an average growth rate of about 7% up to 2024–25 and typically ranks among the top five or six Indian states in terms of per capita income. By 2024–25, agriculture and allied activities contributed about 16% of state output, industry around 33%, and roughly half of the gross domestic product (GDP) came from services.
Yet, even as a top economic performer, Haryana continues to lag on many social indicators (Kapoor and Green (2022). One of its most persistent and notorious problems is the skewed sex ratio—a deep-rooted demographic imbalance shaped by long-standing son preference and practices such as sex-selective abortion.
Despite some recent improvements, the state’s sex ratio at birth has historically been among the lowest in India. In 2024, Haryana recorded only about 910 girls per 1,000 boys at birth, the lowest level in eight years and well below the natural biological range of around 950 girls per 1,000 boys. This figure improved to about 923 in 2025 after stronger enforcement against illegal practices.
This sustained deficit of girls has had far‑reaching effects on the social fabric, including the marriage market and demographic patterns. Studies of regions with male‑skewed populations such as Haryana show that a shortage of marriageable women can produce a “marriage squeeze”, in which many men struggle to find partners within their local communities. In Haryana, this has contributed to an increase in cross‑regional marriages, with men bringing brides from other states, particularly from poorer regions. This, in turn, has broader cultural implications for how families are formed, how decisions are made within households, and how ideas about appropriate roles for women and men are shaped.
Despite sustained government efforts—such as the Beti Bachao Beti Padhao (“Save the Daughter, Educate the Daughter”) campaign and stricter implementation of the Pre‑Conception and Pre‑Natal Diagnostic Techniques Act of 1994—progress remains uneven across districts. This unevenness underscores that economic prosperity alone does not automatically lead to more equitable social outcomes, a point widely noted in the literature.
Kabeer (2002), for instance, highlights three inter‑related dimensions—resources, agency, and achievements—in shaping a woman’s capacity to exercise choice. Resources form the precondition on which agency is built, and it is through the exercise of agency that women secure achievements or outcomes in terms of well‑being.
We carry out a district‑level analysis that groups Haryana’s districts into two clusters based on their geographic location and compare their performance in terms of per capita income.
Anecdotal evidence on spatial patterns of economic development within Haryana suggests substantial variation in economic activity across districts. For example, Gurugram and Panipat are known for their thriving industrial ecosystems, in sharp contrast to districts such as Mahendragarh and Charkhi Dadri. A common explanation for these patterns points to proximity to major urban centres or national highways, which typically supports higher levels of economic activity (Ghani et al (2016), Partridge et al (2008), Lavesson(2017).
However, we still lack a systematic understanding of the extent of geographical inequality within Haryana and of whether economically dynamic districts also perform better on social and human development indicators.
To examine this empirically, we carry out a district‑level analysis that groups Haryana’s districts into two clusters based on their geographic location and compare their performance in terms of per capita income. We then look at the intra-state differences across a wider set of economic and social indicators, with particular attention to the links between economic growth and gender empowerment.
Our analysis draws on the Haryana Sustainable Development Goals District Index 2024 and on three rounds of the National Family Health Survey (NFHS 1998-99, 2005-06, and 2019–21).
Economic and Material Performance
There are now 23 districts in Haryana. Hansi was officially notified as a new district in December 2025, carved out of the existing Hisar district. In our data analysis, we include Hansi within Hisar.
We group 22 districts into two clusters based on their proximity either to the two administrative hubs (New Delhi or Chandigarh) or to two major national highways (National Highway 44 and National Highway 48). 1National Highway 44, also known as the Grand Trunk Road, is the longest national highway. National Highway 48 is a part of the East-West corridor and the Golden Quadrilateral connecting mega cities and industrial clusters. Group I consists of 11 districts (Ambala, Faridabad, Gurugram, Karnal, Kurukshetra, Palwal, Panchkula, Panipat, Rewari, Sonipat, and Jhajjar) that are closer to one of these centres or highways. Group II includes the remaining districts (Bhiwani, Charkhi Dadri, Fatehabad, Hisar, Jind, Kaithal, Mahendragarh, Nuh, Rohtak, Sirsa, and Yamunanagar), which are farther away (Figure 1).
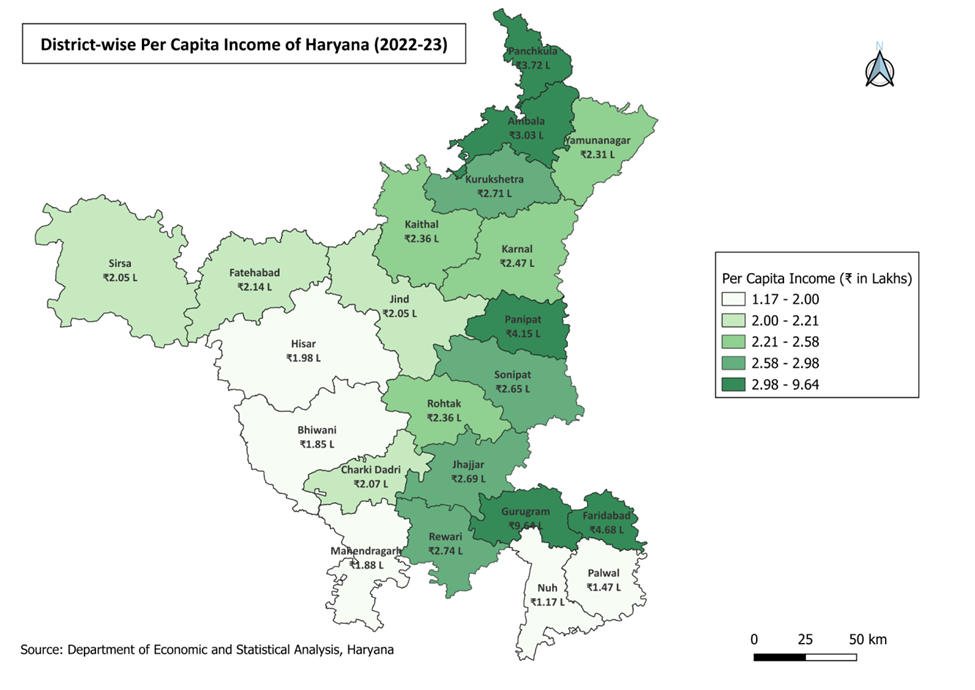
Material well-being, measured in terms of per capita income, was significantly better in Group I than in Group II (Figure 2). The average nominal per capita income of the Group I districts was Rs. 372,768 in 2022-23 (simple average of the per capita income of districts belonging to Group I, based on the Haryana SDG District Index 2024). The average for Group II districts was 44% lower. Group I also had lower poverty, measured by the headcount ratio of the multidimensional poverty index (MDPI). In Group I, 5.3% of the population was classified as poor in terms of the MDPI, compared to 8.2% in Group II.
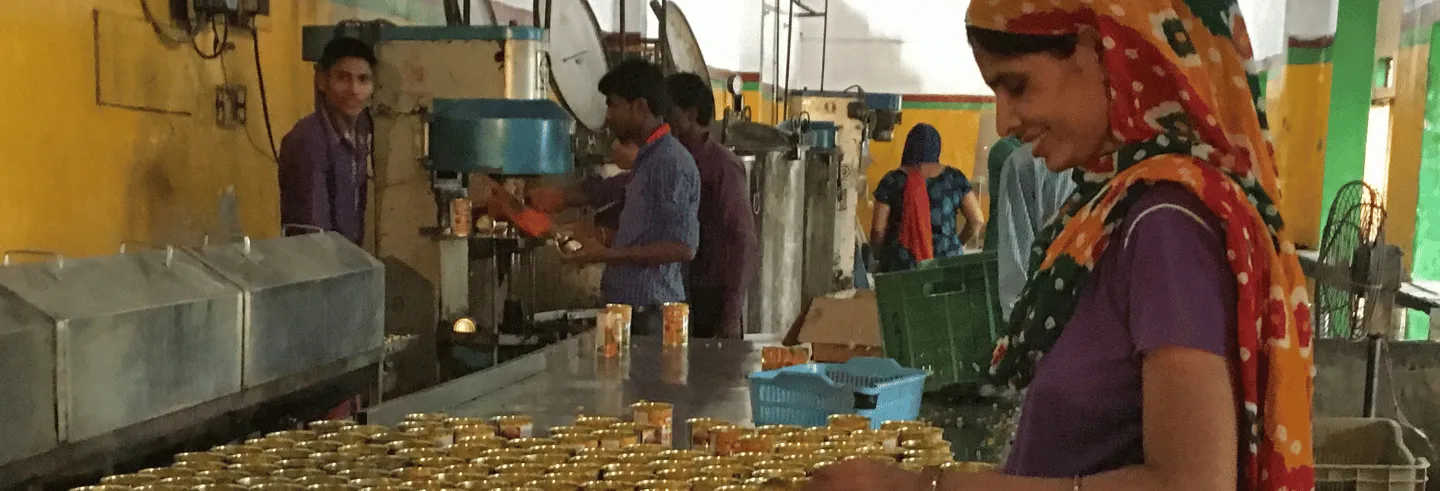
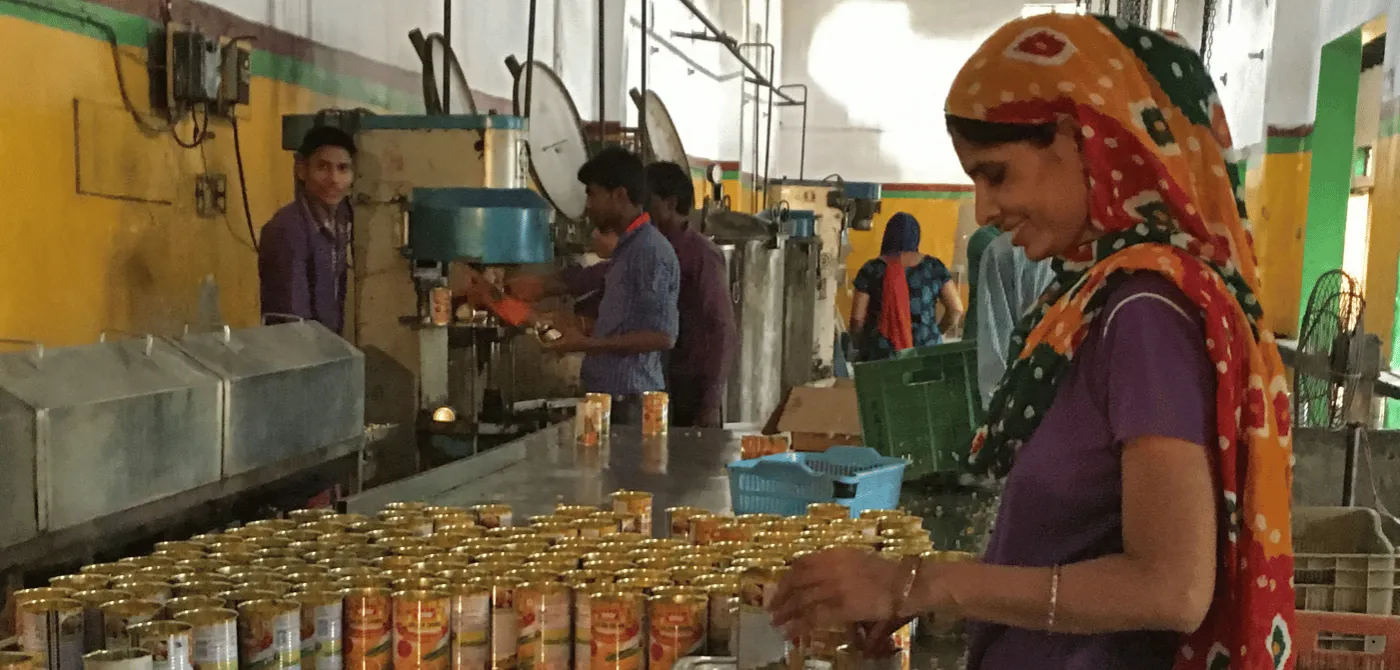
Between 1998-99 and 2019–21, the share of working women rose in both groups. Group I recorded an 84% increase, while Group II saw a 52% rise.
Group I also performed better on basic infrastructure and services. Nearly 100% of households in both groups have electricity. However, the share of households using clean cooking fuel is much higher in Group I (72%) than in Group II (46%). There is also a noticeable gap in access to toilets—95% of households in Group I have a toilet facility, compared to 90% in Group II.
With economic progress, women’s participation in economic activities has increased at the all-India level (Ambade and Chattopadhyay 2024). This pattern is also visible in Haryana. Districts in both groups have seen an improvement in women’s participation in the labour market. Between 1998-99 and 2019–21, the share of working women rose in both groups. Group I recorded an 84% increase, while Group II saw a 52% rise.
Figure 1: Map of Districts of Haryana showing their Proximity to New Delhi and Chandigarh, and their Location on National Highway 44 and National Highway 48
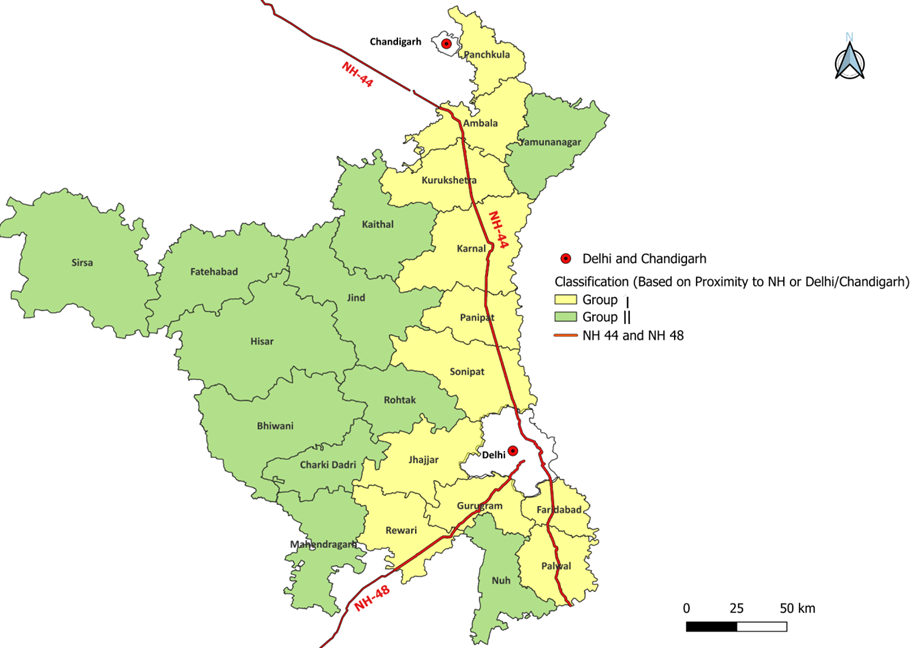
Figure 2: Map of Districts of Haryana with their Per Capital Income, 2022-23
Education and Health
The ordinal ranking between the two groups, however, begins to blur—and even reverse—when we move from income to health and education indicators. The Haryana SDG District Index 2024 reports gender parity indices in education for upper primary, elementary, and secondary levels. These were similar for both groups and close to 100 in 2022-23, meaning that girls’ and boys’ gross enrolment ratios were nearly equal at these levels.
The net enrolment ratios in primary and upper primary schooling are about 20% higher in Group I, but Group II does not lag behind in average learning outcomes for students in grade five and grade eight. This pattern is also visible in the NFHS data over time. Educational attainment among women, measured in total years of schooling, increased from 4.6 to 9.2 years in Group I and from 3.0 to 8.2 years in Group II between 1998-99 and 2019-21.
Life expectancy at birth improved between 2015-16 (NFHS‑4) and 2019–21 (NFHS‑5) but remained higher on average in Group I than in Group II. In both survey rounds, Group I showed a higher life expectancy at birth than the state average, whereas Group II remained below the state average. There was also a sharp difference between the two groups in the percentage of mothers who received postnatal care from a doctor, nurse, lady health visitor, auxiliary nurse midwife, or other health personnel between 48 hours and 14 days after delivery. In this case, Group II outperformed Group I by 18% in 2022-23, as reported in the Haryana SDG District Index 2024.
According to the National TB Prevalence Survey 2019-21, the state ranked among the worst performers nationally, with an estimated 460 to 465 TB cases per 100,000 population.
Haryana has long struggled with a high and rising burden of tuberculosis (TB). According to the National TB Prevalence Survey 2019-21, the state ranked among the worst performers nationally, with an estimated 460 to 465 TB cases per 100,000 population—substantially above many other Indian states. Reported TB notifications in Haryana rose from about 35,000 cases in 2015 to more than 80,000 in 2024, an increase of roughly 132%.
Ni‑kshay Poshan Yojana is a government scheme that provides monthly financial support to people with TB to help meet their nutritional needs. Together with intensive screening campaigns and other initiatives for early detection and treatment, this support has contributed to a reduction in TB prevalence.
However, there is still considerable variation across districts. In 2023, the average incidence of TB per 1,000 population was 220 in Group II districts, compared to 279 in Group I districts, which is 27% higher.
Female Empowerment
The above statistics show that closer proximity to Delhi or Chandigarh, or to the two national highways, is associated with better economic and material outcomes. However, this advantage has not automatically translated into better health and education outcomes across the board. The story of progress, and the better average performance of Group I districts, begins to weaken systematically when we turn to indicators of women’s empowerment, agency, and gender sensitisation.
The Haryana Sustainable Development Goals (SDG) District Index 2024 reports the number of women per lakh (100,000) who experienced sexual crimes during the year. Group II has 25% fewer women reporting that they experienced such crimes compared to Group I.
The sex ratio at birth (number of girls per 1,000 live male births) in 2023 was 916.6 for Group I and 912.2 for Group II. It is worth noting that the sex ratio at birth for India as a whole was 930 in 2023–24. The percentage of currently married women aged 15–49 years who use modern methods of family planning is 60% in both groups.
The NFHS asks respondents about son preference using the question, “How many of these children would you like to be boys, how many would you like to be girls, and for how many would it not matter if it’s a boy or a girl?”. In 1998-99, on average, 46% of women in Group I said they preferred having a son. Over time, this figure fell to 10% by 2019–21. In Group II, 48% of women initially expressed a preference for sons—higher than in Group I—but this fell to 9% by 2019–21, a slightly better outcome than seen for Group I.
It is important to note that, on this measure of gender preference, the Group II districts on average performed better than the Group I districts, even though Group I has significantly higher per capita income.
In Group I, the share of women who justified intimate partner violence increased by five percentage points; by 2019–22, 25% of women justified such violence in response to the same question.
The picture becomes even more sobering when we look at experience of violence and acceptance of violence. The NFHS asks two related questions on this subject. 2a) In your opinion, is a husband justified in hitting or beating his wife in the following situations? b) (Does/did) your (last) husband ever do any of the following things to you? In question b), choices are related to physical and sexual violence. One question asks about the circumstances under which intimate partner violence is considered justified, and the other asks whether women have themselves experienced domestic violence. In Group I districts, 20% of women justified intimate partner violence in 1998-99, compared to 29% in Group II.
Over the next two decades, the trajectories of the two groups diverged. In Group I, the share of women who justified intimate partner violence increased by five percentage points; by 2019–22, 25% of women justified such violence in response to the same question. In contrast, in Group II this share fell to 21%, a decline of 27% over the same period.
Not only did the two clusters move in opposite directions, by 2019–21 the average performance of Group I districts on this indicator was poorer than that of Group II. The Haryana SDG District Index 2024 reports a similar pattern. The number of women per lakh who reported experiencing cruelty or physical violence by a husband or his relatives during the year was 22% lower in Group II than in Group I.
Group I shows poorer levels and slower improvement than Group II in reported incidents of domestic violence. 3The question was not asked in this form in 1998-99. For this, we compare outcomes in 2015-16 with those in 2019–21. In 2015-16, 25% of women in Group I said they had experienced domestic violence; this fell to 19% by 2019–21. Group II started from a worse position—in 2015-16, 30% of women there reported having experienced domestic violence. But Group II recorded a sharper improvement over time. By 2019–21, only 15% of women in Group II reported having experienced domestic violence. This represented a 50% reduction relative to the initial level and was also four percentage points lower than the corresponding figure for Group I in 2019–21.
Discussion
The persistence of deep‑seated gender bias shows that addressing structural social challenges remains central to Haryana’s broader development path. The evidence from the state makes it clear that substantial economic growth and high per capita income do not automatically bring social progress or gender equity.
Districts that are closer to administrative hubs or major national highways (Group I) enjoy significantly higher material wealth and better basic infrastructure than those in Group II, but this prosperity has not translated into better outcomes for women. In fact, the wealthier Group I districts report higher rates of sexual crimes and domestic cruelty than the less affluent Group II.
Focused public policies remain crucial to ensuring that economic gains translate into genuine empowerment and better social outcomes for women.
In line with Kabeer (2002), Haryana illustrates that resources—reflected in higher per capita income—are only a “pre‑condition”, and that it is the exercise of agency that leads to actual well‑being and empowerment. That these patterns appear in both rural and urban settings suggests that economic expansion on its own is not enough to dismantle entrenched cultural and patriarchal norms.
Consequently, as Duflo (2012) also argues, focused public policies remain crucial to ensuring that economic gains translate into genuine empowerment and better social outcomes for women. In Haryana, this includes stricter implementation of the Pre‑Conception and Pre‑Natal Diagnostic Techniques Act and campaigns such as Beti Bachao Beti Padhao.
Without such direct interventions, the state faces a serious risk of reversing its gains on gender sensitisation, despite rising GDP. The worsening attitudes towards the acceptance of intimate partner violence, as captured in representative survey data, should be read as an early warning sign of a possible reversal in the region’s progress on gender empowerment.
Mrinalini Jha is with Jindal School of Government and Public Policy, O.P. Jindal Global University, Sonipat. Jitendra Singh is with Thapar School of Liberal Arts and Sciences, Thapar Institute of Engineering and Technology, Patiala. Both are affiliated with the Jindal Institute of Haryana Studies at O.P. Jindal Global University.
Acknowledgement: We thank Mushruff S. for his research assistance and Aniket Raykar for charting the maps.