
Ever since the release of the much awaited Periodic Labour Force Survey (PLFS, 2017-18) of the National Sample Survey, the statistic that has garnered the most attention is the unemployment rate of 6.1%. For a country that has witnessed unemployment rates in the range of 2-3% over the last four decades, such a high rate is certainly alarming.
However, unemployment is only the tip of the iceberg. In developing economies such as India, in the absence of sufficient unemployment benefits, many individuals cannot afford to be out of work. They are compelled to resort to low paying and low productivity work in the unorganised sector. Consequently, underemployment, as it is described, tends to be more widespread than outright unemployment.
The unemployment rate, by itself, is not a sufficient metric to understand the enormity and extent of labour market challenges. In order to have a comprehensive picture of the state of the labour market, particularly of the extent of labour underutilisation, it is crucial to complement the analysis on labour market indicators with indicators which provide a conceptual understanding of the conditions of employment and how these have evolved over time. This article attempts to provide an exhaustive overview of the state of the labour market by analyzing several key labour indicators reported in the recently released PLFS (2017-18).
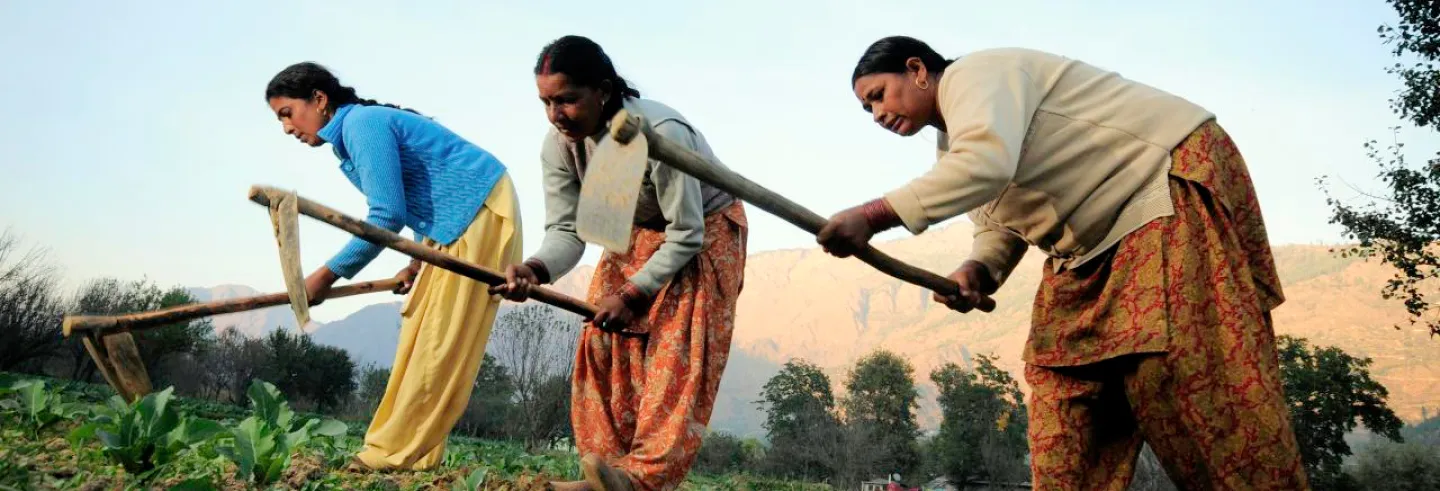
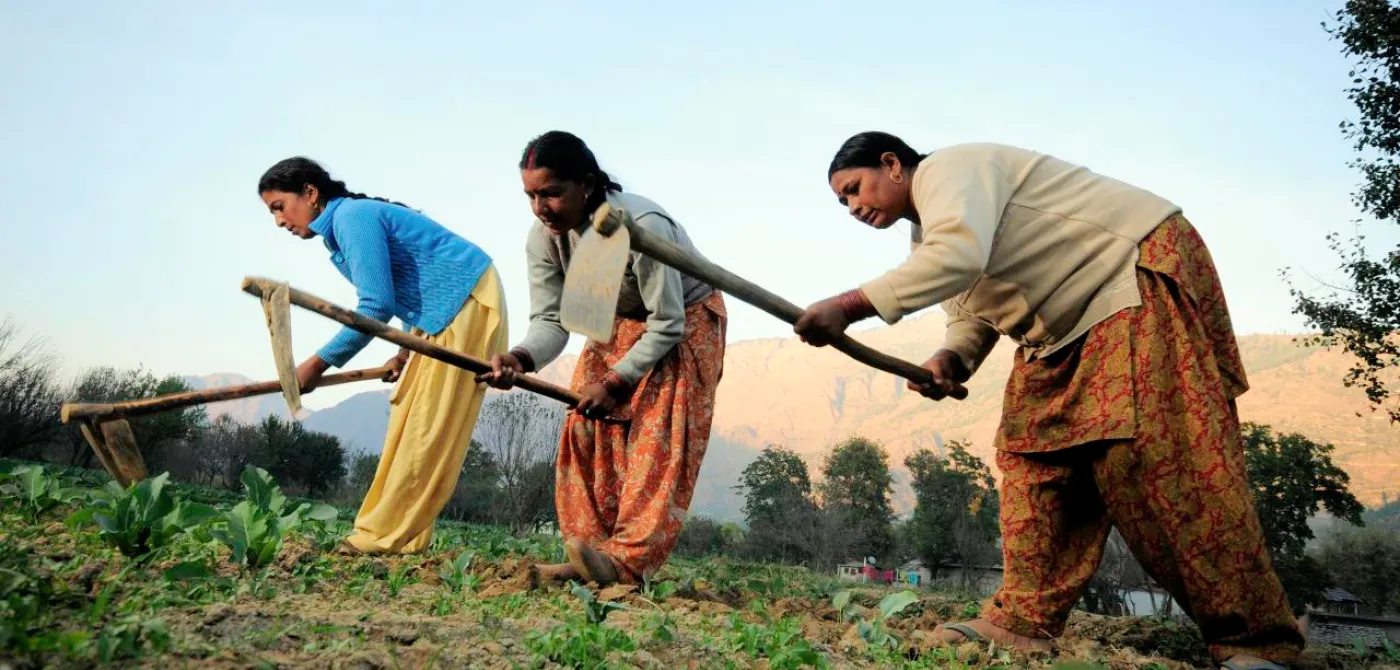
[L]ess than half of the total working age population and a mere one-fifth of women in the working age cohort are available and seeking work in an economy which is widely perceived to be one of the biggest beneficiaries of the demographic dividend.
To begin with, the Labour Force Participation Rate (LFPR), defined as the share of working age population (15+) which supplies or seeks to supply labour for production, stood at a mere 49.8% in 2017-18, a sharp decline of 6.1 percentage points from 2011-12. For females, this figure was a paltry 23.3%, down from 31.2% in 2011-12. It is disappointing that less than half of the total working age population and a mere one-fifth of women in the working age cohort are available and seeking work in an economy which is widely perceived to be one of the biggest beneficiaries of the demographic dividend.
Whilst it is true that the decline in the LFPR is not a new phenomenon and is largely a continuation of the downward trend observed over consecutive household surveys, it is one that certainly merits greater attention.
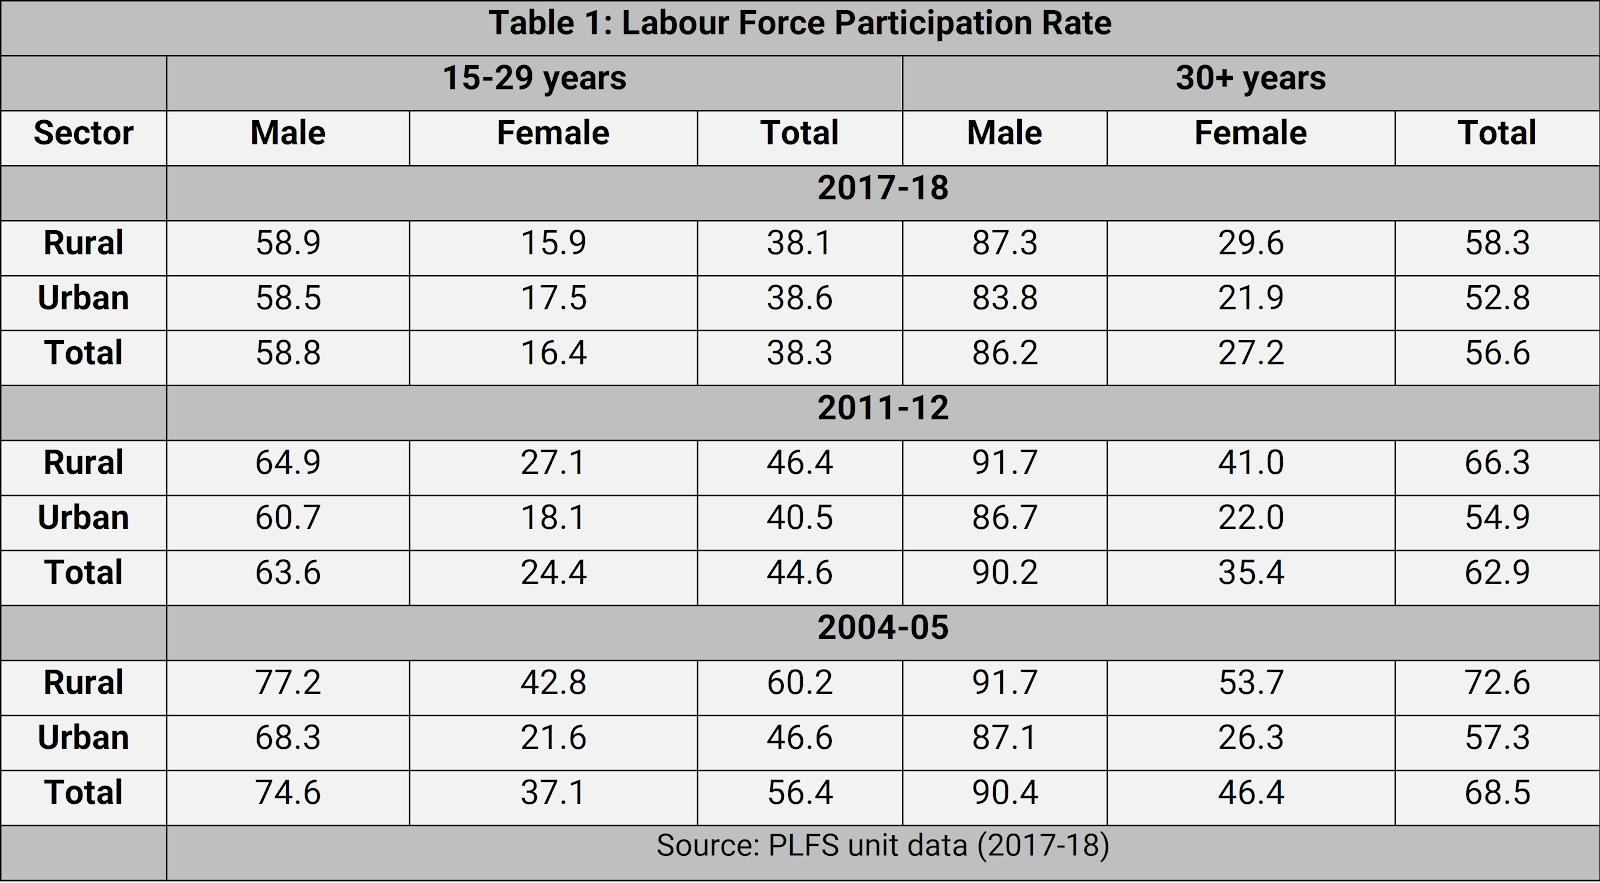
Of course, we would expect to see a decline in LFPR as the share of students in the total working age population rises and younger individuals spend more time getting educated. However, what is worrying is the decline we observe in the LFPR of the non-student working age group too (i.e. those above 30 years). This is apparent from Table 1 which reports the LFPR by age cohort.
A large part of the decline in the LFPR in this cohort is driven by women. There exists an exhaustive body of literature which attempts to explain this phenomenon. While some have argued that women’s withdrawal from the workforce is a consequence of an “income effect”, i.e. an increase in their husbands’ income , others have argued that the lack of suitable employment opportunities for women has led to their withdrawal from the labour force. Some have also argued that women have been constrained from participating in the labour market due to the burden of women’s domestic and childcare responsibilities. Additionally, there is a measurement problem which arises due to the inability of our household surveys to adequately capture women’s economic activity.
[A]fter failed job searches or when facing a gloomy prospect of finding jobs, individuals may give up looking for jobs and withdraw from the labour market altogether.
The PLFS (2017-18) data shows a continuation of this downward trend in female LFPR, both for those in the student and non-student working age group.
What is particularly noteworthy is the decline in the LFPR of males (both in urban and rural areas) in the 30+ age group. This may be a result of a discouraged worker effect, wherein after failed job searches or when facing a gloomy prospect of finding jobs, individuals may give up looking for jobs and withdraw from the labour market altogether. While it is not clear as to what extent the decline in LFPR is driven by the discouraged worker effect, it is important to empirically ascertain the significance of this phenomenon in India.
Next, we turn to examine the conditions of those in the workforce. In 2017-18, the worker to population ratio for persons of age 15 years and above stood at 46.8% (in the usual status), a decline from 54.7% in 2011-12, indicating that less than half of the working age population was employed. In rural and urban areas, the corresponding figures stood at 48.1% and 43.9%, respectively.
Importantly, over 75% of the employed were engaged in self-employment and casual wage employment (Table 2). The regular wage salaried workers accounted for a considerably smaller share.
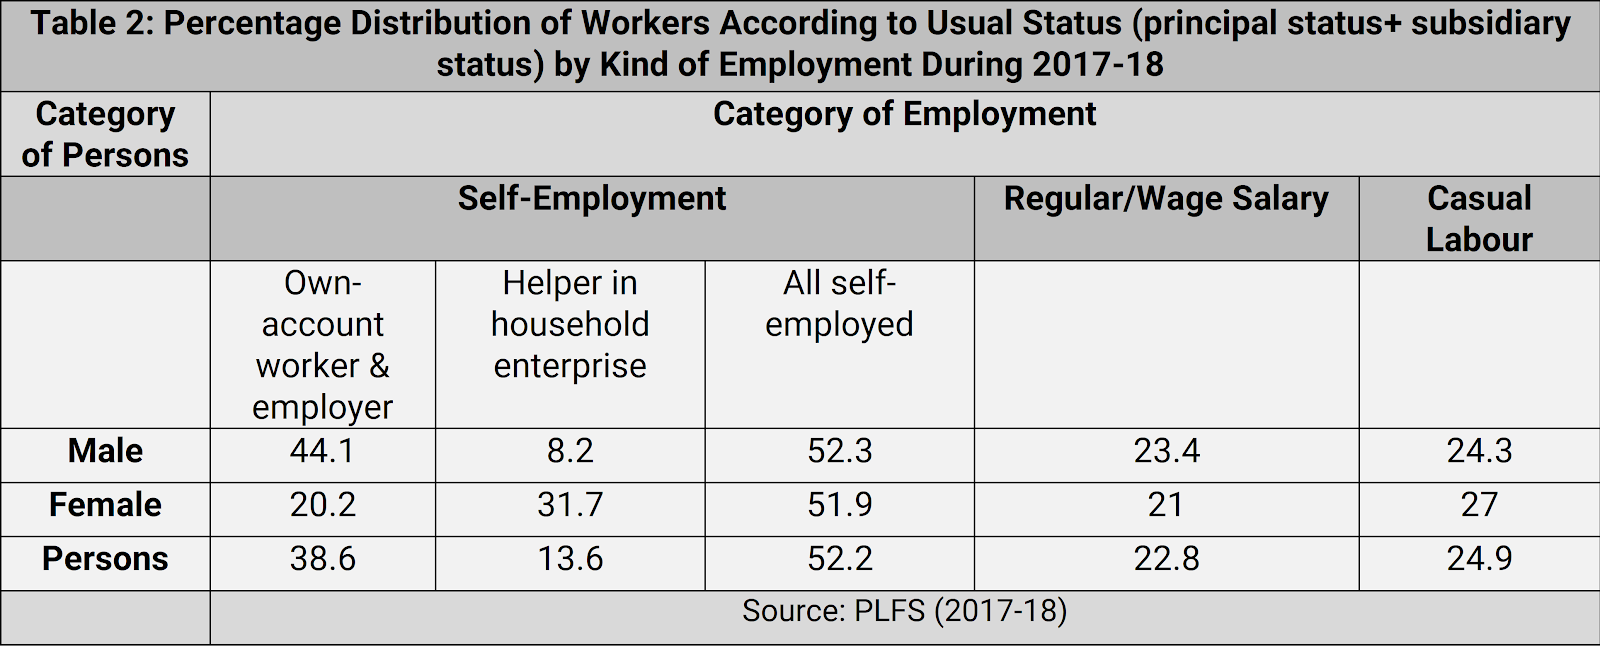
The disproportionately high share of those who are self-employed or working as casual wage labour is worrying for multiple reasons. First, both these forms of employment enable work-sharing arrangements. What this implies is that when the number of members working in a household increases or the number seeking casual wage employment increases, each worker simply works for less time than before and a large section of the workforce is underemployed and engaged in low productivity work. Second, the earnings from these activities are on average quite low pointing to the fact that most workers are trapped in low paying activities.
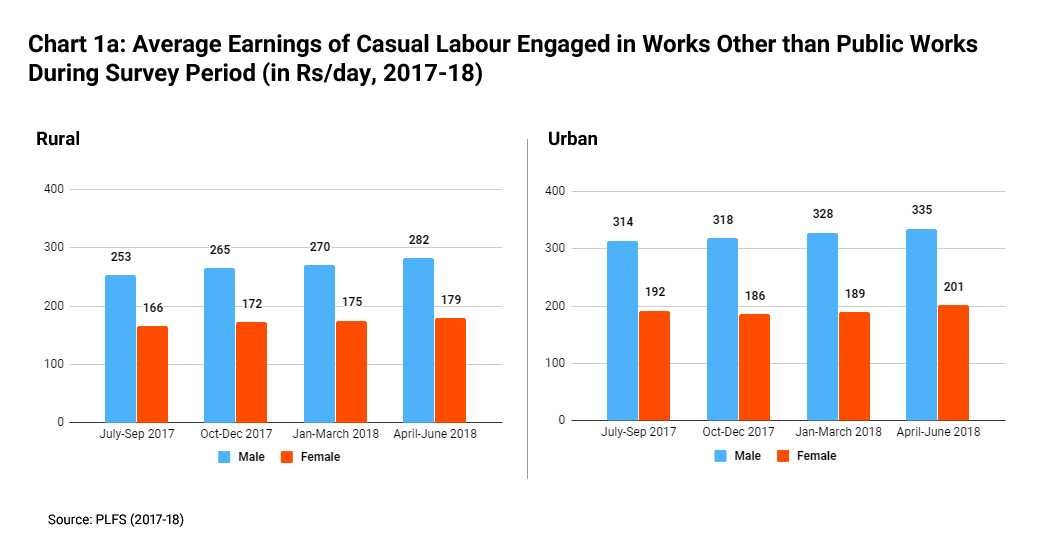
Chart 1a shows that average daily earnings of casual labour (engaged in works other than public works) are typically quite low. In fact, they are considerably lower than the figure of Rs 375 per day (or Rs 9,750 per month) arrived in 2017 by an Expert Committee appointed by the government to recommend a national minimum wage that earners in a family need to bring home to provide a decent standard of living and meet their basic family needs, including education, food and healthcare. 1An Expert Committee led by Anoop Satpathy was constituted by the Union Ministry of Labour and Employment January 17, 2017 to review and recommend methodology for fixation of National Minimum Wage (NMW) and determine the base level National minimum wage/wages through an evidence-based approach. The committee submitted its report on “Determining the Methodology for Fixation of the National Minimum Wage” in Februrary 2019 https://labour.gov.in/sites/default/files/Commitee_on_Determination_of_Methodology.pdf
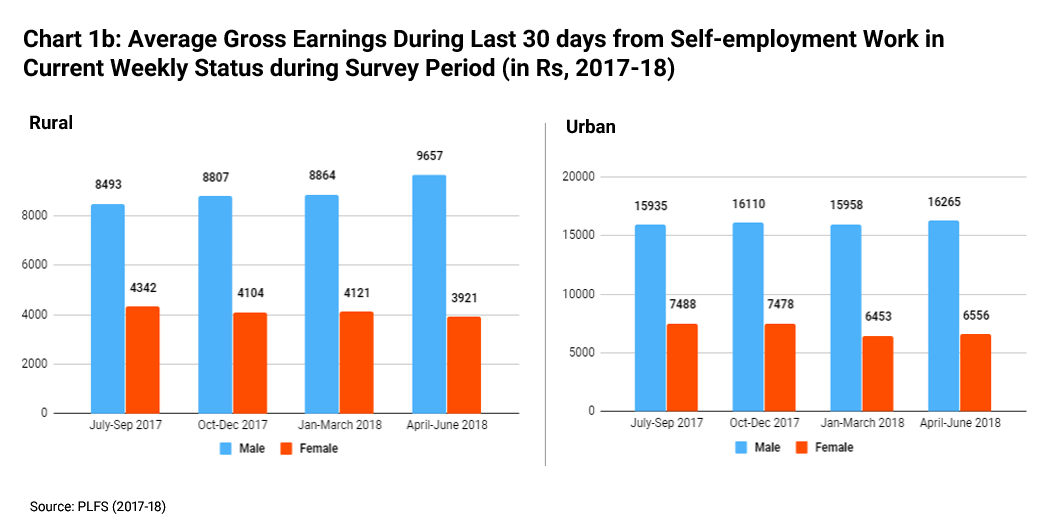
Average gross earnings from self-employment (Chart 1b) which are captured for the first time in the PLFS are also low on average (for all categories barring rural males) when compared to the minimum wage of Rs 9,750 per month arrived at by the Expert Committee. At such low levels of earnings, it is difficult to comprehend how India’s self-employed sustain, let alone become job creators. It is disconcerting that workers in India struggle to make a decent living, even though they work for considerably long hours. The PLFS for the first time collected information on the number of hours worked and here it is worth noting that over 50% of all workers (barring rural females) worked more than 48 hours a week. This is in contrast to most other countries where a 40-48 hour week is considered the norm. 2This phenomenon holds true for all the four quarters for which data is reported: July-September 2017, October-December 2017, January-March 2018 and April- June 2018
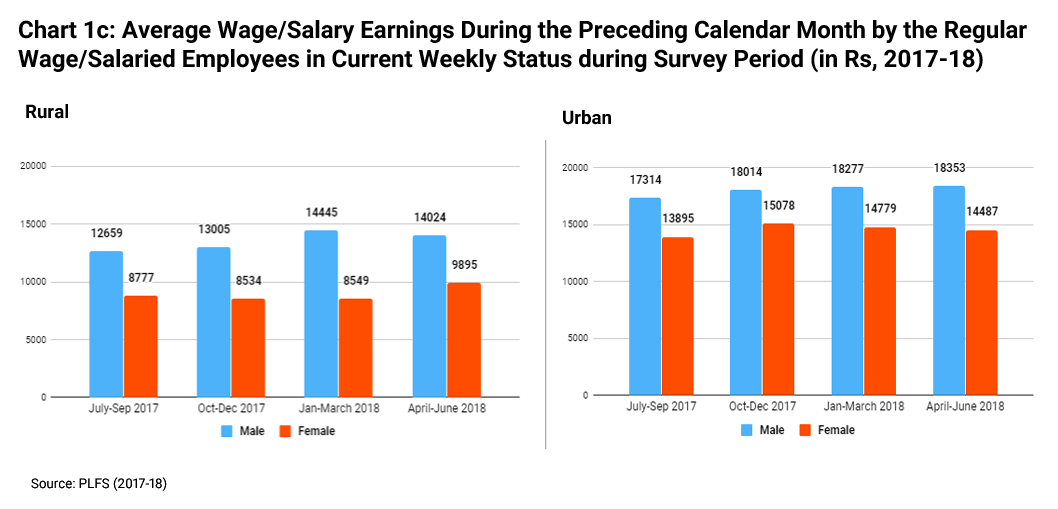
The report also provides key insights into the conditions of employment of regular wage/ salaried (RWS) workers. These workers are considerably better off than self-employed or casual wage employed as evident from their higher average earnings in Chart 1c. In fact, they appear to be the only category of workers, whose earnings on average are comfortably above the minimum wage threshold set by the Expert Committee. The need now is therefore to create more regular salaried jobs. Here, the increase in the share of the RWS workers from 17.9% in 2011-12 to 22.8% in 2017-18 is indeed a positive development.
However, it is disappointing to note that even RWS employment is increasingly being characterized by lack of security of tenure and vulnerable terms of employment. The share of RWS workers who had no job contract was as high as 71.1%, an increase from 64.7% in 2011-12. Concomitantly, two more indicators which provide insights into the quality of regular wage employment are the percentage of RWS workers who are not eligible for paid leave and those who are not eligible for social security benefits. While, the former has increased from 50% to 54.2%, the latter has shown a decline from 55.4% to 49.6%. The increase in the share of RWS workers who are eligible for social security benefits is certainly an improvement. However, the fact that that the self-employed and casual wage workers who typically have no social security still account for 75% of workers suggests that most workers continue to be trapped in precarious work arrangements and we have much to do in improving the quality of employment.
Additionally, most workers are engaged in informal enterprises 3The 15th International Conference on Labour Statistics (1993) defined the informal sector consists of all private unincorporated enterprises (excluding quasi-corporations) i.e. enterprises owned by individuals or households that are not constituted as separate legal entities independently of their owners, and for which no complete accounts are available that would permit a financial separation of the production activities of the enterprise from the other activities of its owner(s) typically defined as unincorporated small or unregistered enterprises. The share of workers engaged in informal enterprises (defined as proprietary and partnership enterprises) in non-agriculture and AGEGC 4AGEGC sector refers to the [ag]ricultural sector [e]xcluding only [g]rowing of [c]rops, market gardening, horticulture (industry group 011) and growing of crops combined with farming of animals (industry group 013) sectors has remained persistently high. In rural and urban areas, it stood at 72.3%, and 64.2% respectively, a decline of less than 3 and 5 percentage points compared to 2011-12.
The high incidence of employment in informal enterprises coupled with the predominance of casual and self-employment and a very high share of RWS with no contract points to the poor conditions of employment.
Finally, we turn to examine trends in unemployment rates in detail (Table 3). It has often been argued that in an economy such as India, where the cost of remaining unemployed is too high, the poor and illiterate cannot afford to remain unemployed. In contrast, the relatively better off and better educated who can afford to wait for a suitable job that matches their aspirations and qualifications, witness greater unemployment (Ghose, 2016).
A careful look at Table 3 shows a worrying trend. The increase in the unemployment rate for the relatively more educated has been particularly steep in 2017-18 compared to previous years. For instance, in 2011-12, the unemployment rate for rural males with secondary education and above was below 4%, but by 2017-18 it jumped to over 10%. For rural males with middle levels of education, too, unemployment rates jumped from less than 2% to approximately 6%. For rural females with secondary education and above, unemployment rates jumped by approximately 8 percentage points between 2011-12 and 2017-18. Similar steep jumps are observed for males and females with secondary education and above in urban areas.

The sharp surge in the unemployment rates of the educated in the PLFS merits discussion. This phenomenon is partly a result of the fact that the nature of structural transformation and economic growth witnessed by India has not generated the kind of employment opportunities that the more educated job seekers are looking for, ones that fit their educational qualification and meet their aspirations.
Agriculture continues to account for over 50% of the workforce in rural areas, and the manufacturing sector which was expected to emerge as an important engine of job creation following the impetus given by successive central governments has failed to take off. Its share in employment has remained virtually stagnant for four decades.
Over the years, India has witnessed a significant increase in enrollment rates and the access to education has improved. However, the quality of education leaves much to be desired. As we lament the lack of jobs for the educated workers, it is important to recognise the fact that the low quality of education being imparted may well be impeding the ability of young educated seekers to attain the jobs they desire.
Data from the Annual Status of Education Report (ASER) highlights the poor learning levels of foundational skills year after year. For instance, in ASER 2018, when children in the age group 14 to 16 were asked to perform some everyday basic tasks such as calculating tim, deciding where to buy books given two different price lists (financial decision making), and computing a discount, they performed poorly. 5Of the 14-16 year olds who could solve a numerical division problem, a little under half could compute the time question correctly, about 37% were able to take the correct decision regarding the purchase of books, and less than 30% could compute the discount correctly
As India is in the midst of reforming its labour regulations, it is worth examining the viability of establishing a universal labour guarantee proposed by the ILO’s Global Commission on the Future of Work.
Foundational skills that include literacy and numeracy skills are not only necessary for getting work that can pay enough to meet daily needs, but are also a prerequisite for continuing in education and training and for acquiring transversal and technical skills that enhance the prospect of getting a job. The lack of such skills not only constrains individuals from unlocking their true human capital potential, but also their ability to find reasonably satisfactory employment.
In conclusion, while painting a grim picture of India’s labour market scenario, the PLFS sends important warning signals that India can ill afford to ignore. First, India faces a two-fold challenge-one of creating productive good jobs for the new entrants in the workforce and for those trapped in low productivity jobs, and the other of attempting to bring back disenchanted jobseekers back into the fold of the labour force.
Second, we need to ensure “decent work” for a disproportionately large share of its workforce which is trapped in informal work arrangements.
As India is in the midst of reforming its labour regulations, it is worth examining the viability of establishing a universal labour guarantee proposed by the ILO’s Global Commission on the Future of Work. The proposal suggests that all workers, regardless of their contractual arrangement or employment status, should enjoy fundamental workers’ rights, an “adequate living wage”, maximum limits on working hours and protection of safety and health at work.
Third, it is important to bear in mind that the jobs crisis is intricately interlinked with the learning crisis in education. Unless our education system is able to provide workers foundational skills which are portable and can be applied across a wide variety of jobs, their education will be of little use to prospective employers.
Recognising these challenges and putting in place appropriate policy responses to tackle them is of utmost priority. As multiple forces ranging from technological advances to climate change to demographic changes transform the world of work, the absence of decisive policy action will disrupt livelihoods and exacerbate inequalities.
(The author is grateful to Abhihsek Kumar for help with PLFS data)