
1. GIPD 1.0 and GIPD 2.0
The epithet “the Great Indian Poverty Debate” dates back to the early 2000s, when the first version of the debate around India’s poverty estimates was triggered by a lack of comparability of underlying survey data.
The National Sample Survey (NSS) Organisation’s Household Consumer Expenditure Survey (CES) has long served as India’s premiere (monetary) poverty monitoring instrument and the primary data source for official poverty statistics. A change in the NSS survey methodology for the 55th round of the CES in 1999-00 led to a vigorous debate on how much poverty had declined up to that point. Many key contributions to this debate—which still make excellent reading—were collected in a volume titled The Great Indian Poverty Debate edited by Angus Deaton and Valerie Kozel (2005).
The CES data gap inspired jugaad, with a number of attempts to come up with poverty estimates for the post-2012/ pre-pandemic period, using alternative data sources and a variety of imputation procedures.
That was version 1.0 of the Great Indian Poverty Debate (hereafter, GIPD). Things were relatively quiet on the poverty statistics front for about a decade since then up to the 68th round of the CES for 2011-12. Then, there was a long hiatus in further rounds of the CES. There was a suppressed round of the CES for 2017-18 (though some poverty estimates emerged based on leaked tabulations; see the 2022 article by S. Subramanian).
Covid 19 intervened in early 2020 to further delay data collection efforts. The next CES only took place in 2022-23, which meant a decade-long hole in the poverty statistics series. The CES data gap inspired jugaad, with a number of attempts to come up with poverty estimates for the post-2012/ pre-pandemic period, using alternative data sources and a variety of imputation procedures.
A heated debate—GIPD 2.0—ensued on what had happened to poverty since 2011-12. There was a wide range of post-2012 poverty estimates, and hence a wide range of estimated rates of poverty reduction since 2012. GIPD 2.0 has remained unsettled. The only broad consensus is on the direction of change (that poverty has almost certainly declined since 2012), but with wide disagreement on the extent of change.
While following GIPD 1.0 and GIPD 2.0 is instructive and there are lessons to be learnt from them, I focus on the current debate, GIPD 3.0, in this note. The discussion is in three parts—the context, the content, and the controversy around GIPD 3.0.
2. GIPD 3.0: The Context
GIPD 2.0 was animated by the central question of what had happened to poverty in India against the backdrop of the lack of a comparable CES since 2011-12. Before the dust could settle on GIPD 2.0, new CES surveys by the NSSO for 2022-23 and 2023-24 became available. The new surveys, however, came with a new survey design, with changes in the questionnaire (including the number of consumption items covered), sample design, and organisation and protocols for fieldwork.
These changes have inevitably entailed multiple comparability problems with the 2011-12 CES. Notwithstanding the comparability problems, and similar to GIPD 1.0 and 2.0, a number of poverty estimates for 2022-23 have recently become available, as shown in Table 1. The wide span of these estimates, ranging from a poverty rate of 2.4% to 26.4% for 2022-23, is what has unleashed the current and ongoing GIPD 3.0.
Table 1: A Wide Range of Poverty Estimates for 2022-23
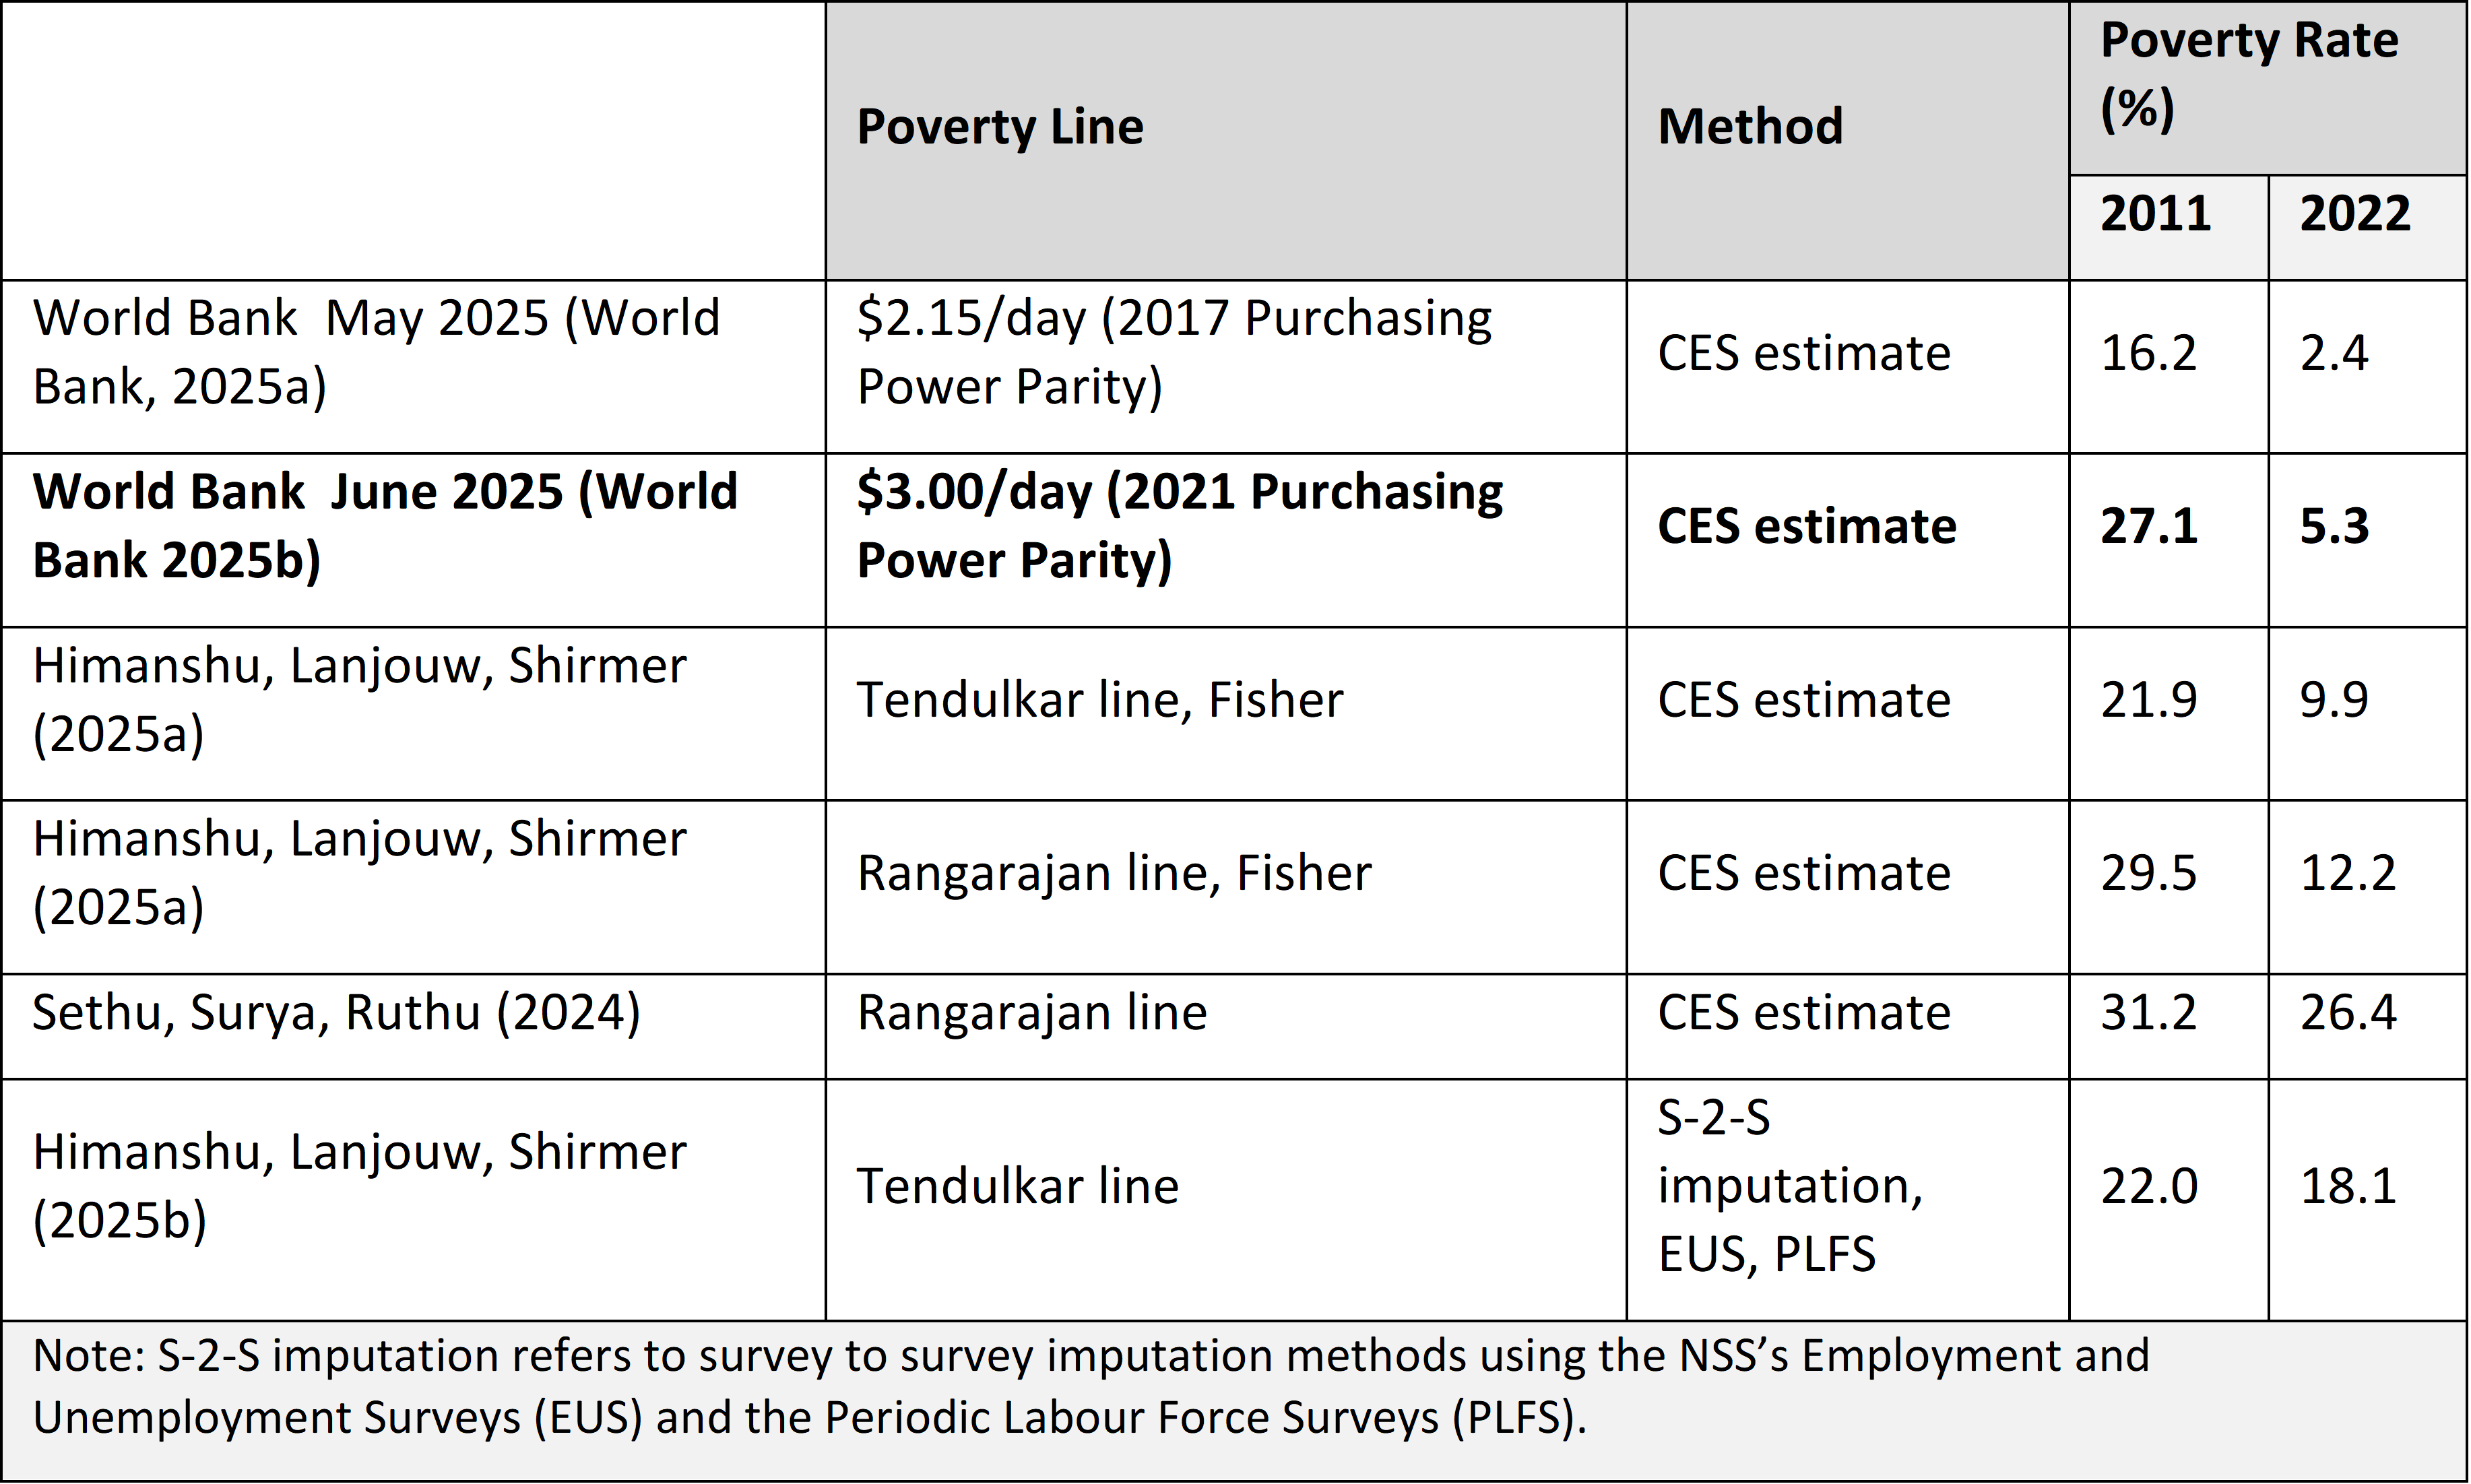
Of these, the most influential has been the estimate by the World Bank in its June 2025 Poverty Update (World Bank 2025b). According to this report, using an international poverty line (IPL) of $3.00 per person per day in 2021 Purchasing Power Parity (PPP) dollars, the fraction of India’s population living below this line fell from 27.1% in 2011-12 to 5.3% in 2022-23.
This World Bank estimate has been a key focal point of public and academic discussion. Poverty numbers always bleed into the politics of the time. The Press Information Bureau quickly released and publicised the World Bank’s estimates of poverty and inequality, treating them as an arms-length endorsement of the government’s success in reducing poverty and inequality.
The World Bank’s poverty numbers have been challenged by alternative estimates of the poverty rate for 2022-23, which range between 9.9% and 26.4% (see Table 1; also see the 2025 article by Himanshu). What is at stake is not just the poverty estimate for 2022-23, but, more importantly, the extent of decline in poverty between 2011-12 and 2022-23.
3. GIPD 3.0: The Content
Up to the 68th round for 2011-12, the CESs had always canvassed Schedule 1 of the consumption module with a Uniform Reference Period (URP) of the last 30 days for all consumption items. New CES surveys for 2022-23 and 2023-24 have instead only used Schedule 2 of the consumption module with the so-called Modified Mixed Reference Period (MMRP). 1In contrast to the Uniform Reference Period for all consumption items, the Modified Mixed Reference Period uses multiple reference periods: (i) “last 7 days” for edible oil; egg, fish and meat; milk and milk products; vegetables; fruits; spices; beverages and processed foods; pan, tobacco and intoxicants; (ii) “last 365 days” for clothing; bedding; footwear; education; medical (hospitalisation); durable goods; and (ii) “last 30 days” for all other consumption items.
Fortunately, though, the Modified Mixed Reference Period Schedule 2 was also canvassed in the CES 2011-12 for an independent sample (in addition to Schedule 1). The Modified Mixed Reference Period-based consumption from the CES 2011-12 is thus in principle comparable with the CES 2022-23 / 2023-24 consumption. The vexing problem, however, is that the new surveys introduced multiple other changes which compromise comparability. This non-comparability is at the heart of GIPD 3.0.
Overall, there is a large expansion of the consumption module from 347 to 405 items. We know from research on survey methodology that an expansion of the list of items increases measured total consumption expenditure.
Multiple changes in the CES 2022-23 (and 2023-24) relative to the CES 2011-12 include the following.
1. Changes in consumption items covered. Many consumption items remained the same, but some were aggregated, some others disaggregated, and some new items were introduced. Overall, there is a large expansion of the consumption module from 347 to 405 items (58 additional items). We know from research on survey methodology that an expansion of the list of items increases measured total consumption expenditure (Jolliffe 2001, Beegle et al. 2012).
2. Changes from Pen to Computer. The shift from pen-and-paper interviewing to computer-assisted personal interviewing generally improves data quality but introduces comparability concerns, with some evidence of computer-assisted personal interviewing producing lower consumption aggregates than pen-and-paper interviewing (Caeyers et al. 2012).
3. Shift from a single-visit survey to three-module, three-visit survey. The new survey has split the household consumption questionnaire into three modules: the Food Questionnaire (FDQ), the Consumables and Services Questionnaire (CSQ), and the Durable Goods Questionnaire (DGQ). These are administered over three consecutive monthly visits, alongside the Household Characteristics Questionnaire (HCQ), which collects household characteristics and demographic information.
While this helps reduce respondent fatigue and improve recall, survey experiments also suggest such a shift tends to increase reported consumption (Jeong et al. 2023). The shift to multiple visits also opens the door to multiple respondents for different modules, posing additional problems of consistency across them.
4. Changes in sample design. The new sample design introduces two strata within rural areas. Stratum 1 covers villages located within 5 kilometres of a district headquarters or larger towns. Stratum 2 includes all other villages.
In rural and urban areas, the second-stage strata (SSS) are now based on land ownership for rural areas and car ownership for urban areas. In contrast, the 2011-12 CES used possession of durable goods and engagement in non-agricultural activity (measured by monthly per capita expenditure, MPCE) for this classification.
There are also changes in household selection criteria that may increase the likelihood of selecting wealthier households (especially in urban areas). Changes in stratification by themselves should not introduce a bias in a well-constructed probability sample, but the World Bank Methodology Note itself observes: “The changes in the CES’s sampling design are likely to bias consumption estimates upward and underestimate the level of inequality” (World Bank 2025a).
Overall, the key problem is the absence of a pilot or a bridge survey: 2A bridge survey is one that fields the old methodology for an independent sample alongside the sample for the new methodology, which helps develop link factors for comparability. “Ultimately, in the absence of a pilot or bridge survey, it is impossible to assess conclusively the impacts of changes in the survey on the comparability of the consumption aggregate and potential biases in poverty and inequality measures” (World Bank 2025a).
4. GIPD 3.0: The Controversy
To assess issues at the heart of the controversy around GIPD 3.0, there is no alternative but to get into the details of the methodology of the June 2025 World Bank Poverty Update. There are several changes introduced in the Update.
At the global level, the key change is the adoption of the 2021 Purchasing Power Parities (PPPs) leading to a revised set of international poverty lines. The international extreme poverty line is now revised to $3.00/person/day in 2021 Purchasing Power Parity dollars, from its earlier value of $2.15/person/day in 2017 Purchasing Power Parity dollars.
Revision of international poverty lines with the adoption of new Purchasing Power Parities has now become normal practice for global poverty monitoring, even as it goes against the recommendation of the Atkinson Commission (World Bank 2017). 3There have been several such revisions in the past; for instance, the last one from $1.90/person/day at 2011 Purchasing Power Parity to $2.15/person/day at 2017 Purchasing Power Parity. Though not a major concern in and of itself, it is nonetheless an important matter, and is related to the other recommendation of Atkinson Commission on the complementary roles of international and national poverty monitoring (will return to this later).
Apart from this global change, the Update introduced several India-specific changes, which could be grouped into two parts:
1. Adjustments relevant to comparing poverty in 2011 and 2022.
2. Adjustments to the back series of poverty before 2011.
4.1 Adjustments for 2011–2022 Comparison
The World Bank June 2025 Update makes several changes to the household consumption measure.
1. There was a shift from Uniform Reference Period to Modified Mixed Reference Period-based consumption in the World Bank June 2025 Update. This, by itself, is potentially fine for the 2011-2022 poverty comparison, but has some unsavoury implications for updating the back series of poverty (discussed later).
2. The Update values subsidised/free provision of food rations, kerosene, school uniforms and footwear at local market prices. This is done for both 2011 and 2022. In principle, if consistently done for both dates as it seems to be, this is not problematic for the 2011-2012 poverty comparison.
But this is a serious issue for a comparison with the back series of poverty, for which no such valuation of subsidised/free provision has been undertaken, presumably for lack of appropriate data. The absence of a parallel valuation for the back series will overstate the decline in poverty in 2011 and 2022 relative to preceding years.
3. The Update also introduces changes to price deflators. For within-year price variation (since the CES is spread over an entire year), the nominal consumption of households is adjusted using monthly consumer price indexes at the state-sector-subgroup level. For price variation across space, nominal consumption is adjusted using the Fisher price indices (a la Tendulkar, GOI 2009) at the state-sector level. Since the same process is followed for both 2011 and 2022, there is no real problem with this.
4. The Update methodology excludes certain items from measured consumption for both 2011 and 2022.
a. Exclusion of durables. The World Bank reasoning is that not enough information is available to compute the use value of flow of services from durables, and, in addition, expenditures on durables are lumpy and infrequent.
b. Exclusion of hospitalisation and other non-food items, including jewellery, wrist watches, furniture. The World Bank reasoning is that hospitalisation represents catastrophic health expenditure and is not “welfare-enhancing”; and jewellery, wrist watches, and so on serve as a store of value, not consumption.
c. Exclusion of rental values of housing (for renters) from measured household consumption.
The average combined share of these excluded items is not large: about 3.5% of total nominal expenditure (in both 2011 and 2022). The problem, however, is that the rich devote a larger proportion of their spending to these items than the poor; see Figure 1, taken from the World Bank Methodology Note itself (World Bank 2025a).
Figure 1: Share of Durables, Hospitalisation, and Select Non-Food Items in Nominal Expenditures, by deciles: 2022-23
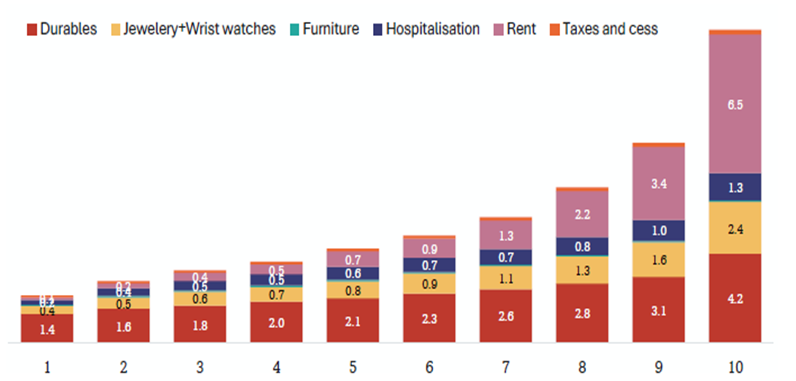
Given this robust pattern, these exclusions will inevitably cause a large reduction in measured inequality, though not in measured poverty. The World Bank Methodology Note acknowledges this, but chooses to ignore it nonetheless. This is a huge price to pay, which annuls any possible advantages of exclusion. The exclusion of these items is likely an important factor behind a reported Gini index of around 0.25 in the World Bank June 2025 Update.
4.2 Adjustments to Back Series Before 2011
In addition to the 2011-2022 comparison, the World Bank June 2025 Update makes a number of adjustments to the back series of poverty in India. These adjustments are applied to six rounds of the CES before 2011-12: for 1977-78, 1983, 1987-88, 1993-94, 2004-05, and 2009-10. The most significant of the adjustments relates to converting Uniform Reference Period (URP) consumption in earlier rounds to equivalent Modified Mixed Reference Period (MMRP) consumption. This is done using the following steps:
a. As the CES 2011-12 has both URP and MMRP consumption for independent samples, use these data to estimate the URP and MMRP consumption for every percentile in rural and urban areas.
b. Construct the (𝑀𝑀𝑅𝑃/𝑈𝑅𝑃) consumption ratio for each percentile.
c. Use this ratio to convert the URP to MMRP consumption for all six earlier survey years from 1977-78 through 2009-10.
This is a highly egregious adjustment. The assumption that the (𝑀𝑀𝑅𝑃/𝑈𝑅𝑃) consumption ratio has remained constant for each percentile in rural and urban areas for 30-plus years is nothing short of heroic.
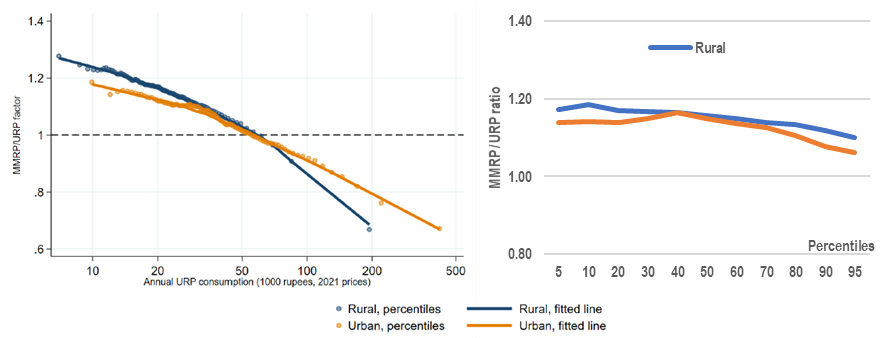
In addition, there is another highly problematic issue. Figure 2 shows the (𝑀𝑀𝑅𝑃/𝑈𝑅𝑃) consumption ratio for 2011-12. The graph on the left, taken directly from World Bank (2025b), is what the World Bank has used in step b above to make the MMRP conversion for earlier rounds; the graph on the right is what I estimate directly from reported data in the NSS report on the CES 2011-12.
Two points are notable. First, the (𝑀𝑀𝑅𝑃/𝑈𝑅𝑃) consumption ratio from the NSS is much flatter than that computed and used by the World Bank. Second, and even more concerning, while the NSS-based ratio is entirely above 1 (indicating that the MMRP consumption is higher than the URP consumption throughout the distribution), the World Bank ratio is above one for the relatively poor and below 1 for the relatively rich.
The World Bank’s MMRP conversion procedure will thus lead to a large compression of the consumption distributions, and necessarily to much lower measured inequality.
Figure 2: Relationship between 2011-12 Uniform Reference Period and Modified Mixed Reference Period Consumption
5. Rewriting Economic History?
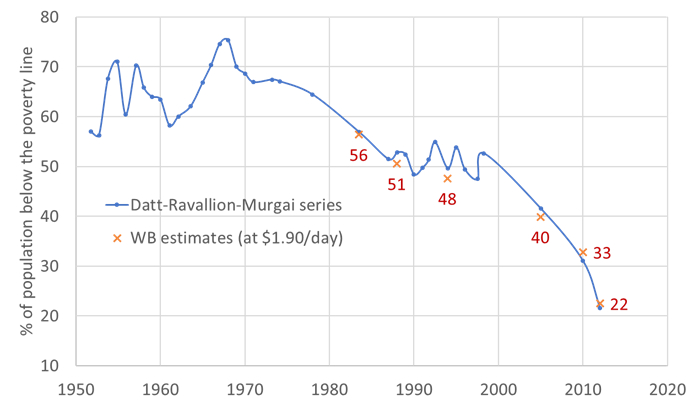
The serious implication of the adjustments to the back series of poverty in the World Bank Update is that it delivers quite a different trajectory of trends in monetary poverty in India up to 2011-12. Thus, before the recent World Bank Update, Figure 3 shows that the 60-year poverty series for 1951–2012 by Datt et al. (2020) was closely aligned to the World Bank poverty estimates for India at the international poverty line of $1.90 per person per day (2011 Purchasing Power Parity dollars). Both these series were based on the Uniform Reference Period measure of consumption.
Figure 3: Uniform Reference Period Consumption-based Poverty Series for India up to 2011-12
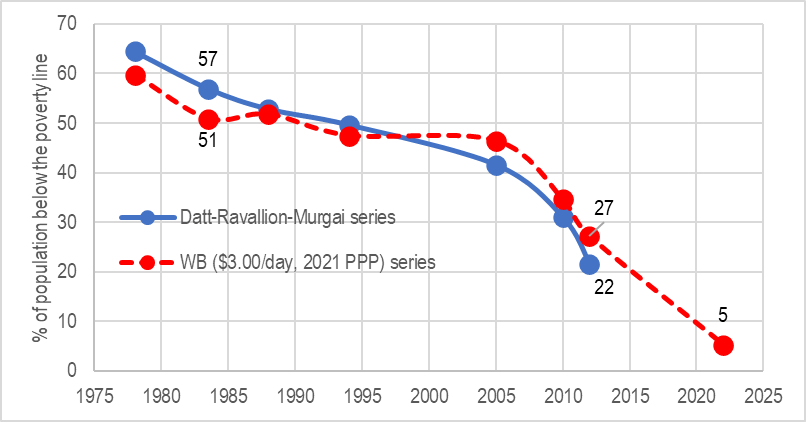
This is no longer the case with the new set of World Bank estimates, as seen in Figure 4. By the World Bank’s new MMRP consumption-based series (for the international poverty line of $3.00 /day at 2021 Purchasing Power Parity dollars), there was little change in poverty during 1983-2005, including the critical period of economic reforms and contrary to nearly all previous estimates of poverty for this period. The World Bank estimates also suggest a rapid poverty decline between 2005 and 2022.
Figure 4: The World Bank’s New Modified Mixed Reference Period Consumption-based Poverty Series for India
6. Whither Next?
To sum up, there remain key unresolved comparability issues between the CES 2011 and the CES 2022 that plague poverty comparisons between 2011-12 and 2022-23. That is a serious enough problem on its own with non-trivial implications for measured poverty.
But it has been compounded by some questionable adjustments made by the World Bank for valuation of consumption and for reconstructing a back series of poverty before 2011-12. The World Bank’s new methodology also has some serious implications for the underestimation of inequality in India.
The answer to the key question of the change in poverty in India since 2011-12 remains unsettled by the World Bank’s June 2025 Poverty Update. While there is little uncertainty regarding the direction of change—absolute poverty has most likely declined—the key question is by how much. That question remains an unresolved point of contention. It is worth emphasising that this is not just a matter of academic interest.
What could, or should, be done? Ideally, the NSS should (on a priority basis) conduct a bridge survey, which canvasses the old and new survey design / protocols for independent samples. This will help determine the link factors between the estimates from the old and new surveys. What else could be done (or undone)?
● For comparing poverty in 2011 and 2022, we should go back to the basics and construct poverty lines from scratch using the micro data.
● Exclusion of items that have known and serious implications for the underestimation of inequality should be reconsidered or discontinued.
● At the very least, present poverty and inequality estimates with and without these exclusions.
● Any revisions to the back series of poverty along the lines of World Bank June 2025 Update should be discontinued (as they have little methodological justification).
A final word on comparing poverty in 2011 and 2022, and going back to the basics. When the underlying consumption measures across surveys are not comparable, perhaps the best one can do is to start from scratch and re-estimate the poverty lines corresponding to the measure of consumption from each survey.
With a global poverty monitoring perspective, the World Bank is committed to using a common international poverty line in Purchasing Power Parity dollars across all countries. The international poverty line is re-estimated when a new set of Purchasing Power Parities becomes available, but it is not re-estimated when a significantly non-comparable survey emerges for an individual country.
Whatever may be the case for sticking to this approach from a global poverty monitoring perspective, the issues raised by substantially non-comparable surveys—as we are confronted with in India—highlight an important need for national poverty monitoring. Such national poverty monitoring will make room for the possibility of re-estimating poverty lines from first principles in light of such challenges.