
The concept of “development” has evolved, even though gross domestic product (GDP) and per capita GDP still dominate official assessments. 1This article is adapted from the Prof. K. Jayashankar 13th Endowment Lecture delivered on 6 August 2025 at Kakatiya University, Warangal. A large body of literature has highlighted the limitations of per capita GDP as a measure of development.
Averages like per capita GDP or GSDP conceal how income is distributed across people, regions, and social groups. They highlight production but ignore negative externalities such as pollution, land degradation, and resource depletion, revealing little about who benefits from growth or what social and environmental costs accompany it.
More fundamentally, they reflect the means people have, not what they are actually able to achieve with those means (Sen 1988). Sen’s work shifted the focus to improving the human condition by enhancing people’s “capabilities” to lead lives they value (2003).
This capability-based approach informed new measures of development, notably the Human Development Index (HDI), introduced by the United Nations Development Programme (UNDP) in 1990. The HDI combined indicators of education, health, and material living standards to redirect attention from income alone to a broader view of well-being.
It rests on three components—education (initially literacy, later years of schooling), health (life expectancy), and per capita GDP—acknowledging that growth is necessary but insufficient. Parallel efforts expanded the understanding of development through concepts such as “sustainable development” (Brundtland Commission 1987), and “well-being”, emphasised by the Stiglitz Commission (2008) to highlight GDP’s limits as a measure of economic and social progress.
The Stiglitz Commission advanced multidimensional measures of “well-being”, shifting attention from national economic output to household income and consumption, including public provisioning of health and education.
The Stiglitz Commission advanced multidimensional measures of “well-being”, shifting attention from national economic output to household income and consumption, including public provisioning of health and education. It extended “well-being” to qualitative dimensions such as inequality, political voice, environmental sustainability, and resilience to climate change.
Against this conceptual backdrop, the objective here is to assess the performance of the Telangana economy in comparison with the other four southern states through a broader understanding of development that extends beyond GSDP and per capita income. This perspective emphasises household well-being, including education, health, qualitative social indicators, and the extent of state provisioning. It is notable that although the NITI Aayog had proposed examining the impact of increasing states’ share in the central divisible pool from 32% to 42% under the 14th Finance Commission on social sector spending, little appears to have emerged after 2014–15 and 2015–16 (Kumar et al. 2018).
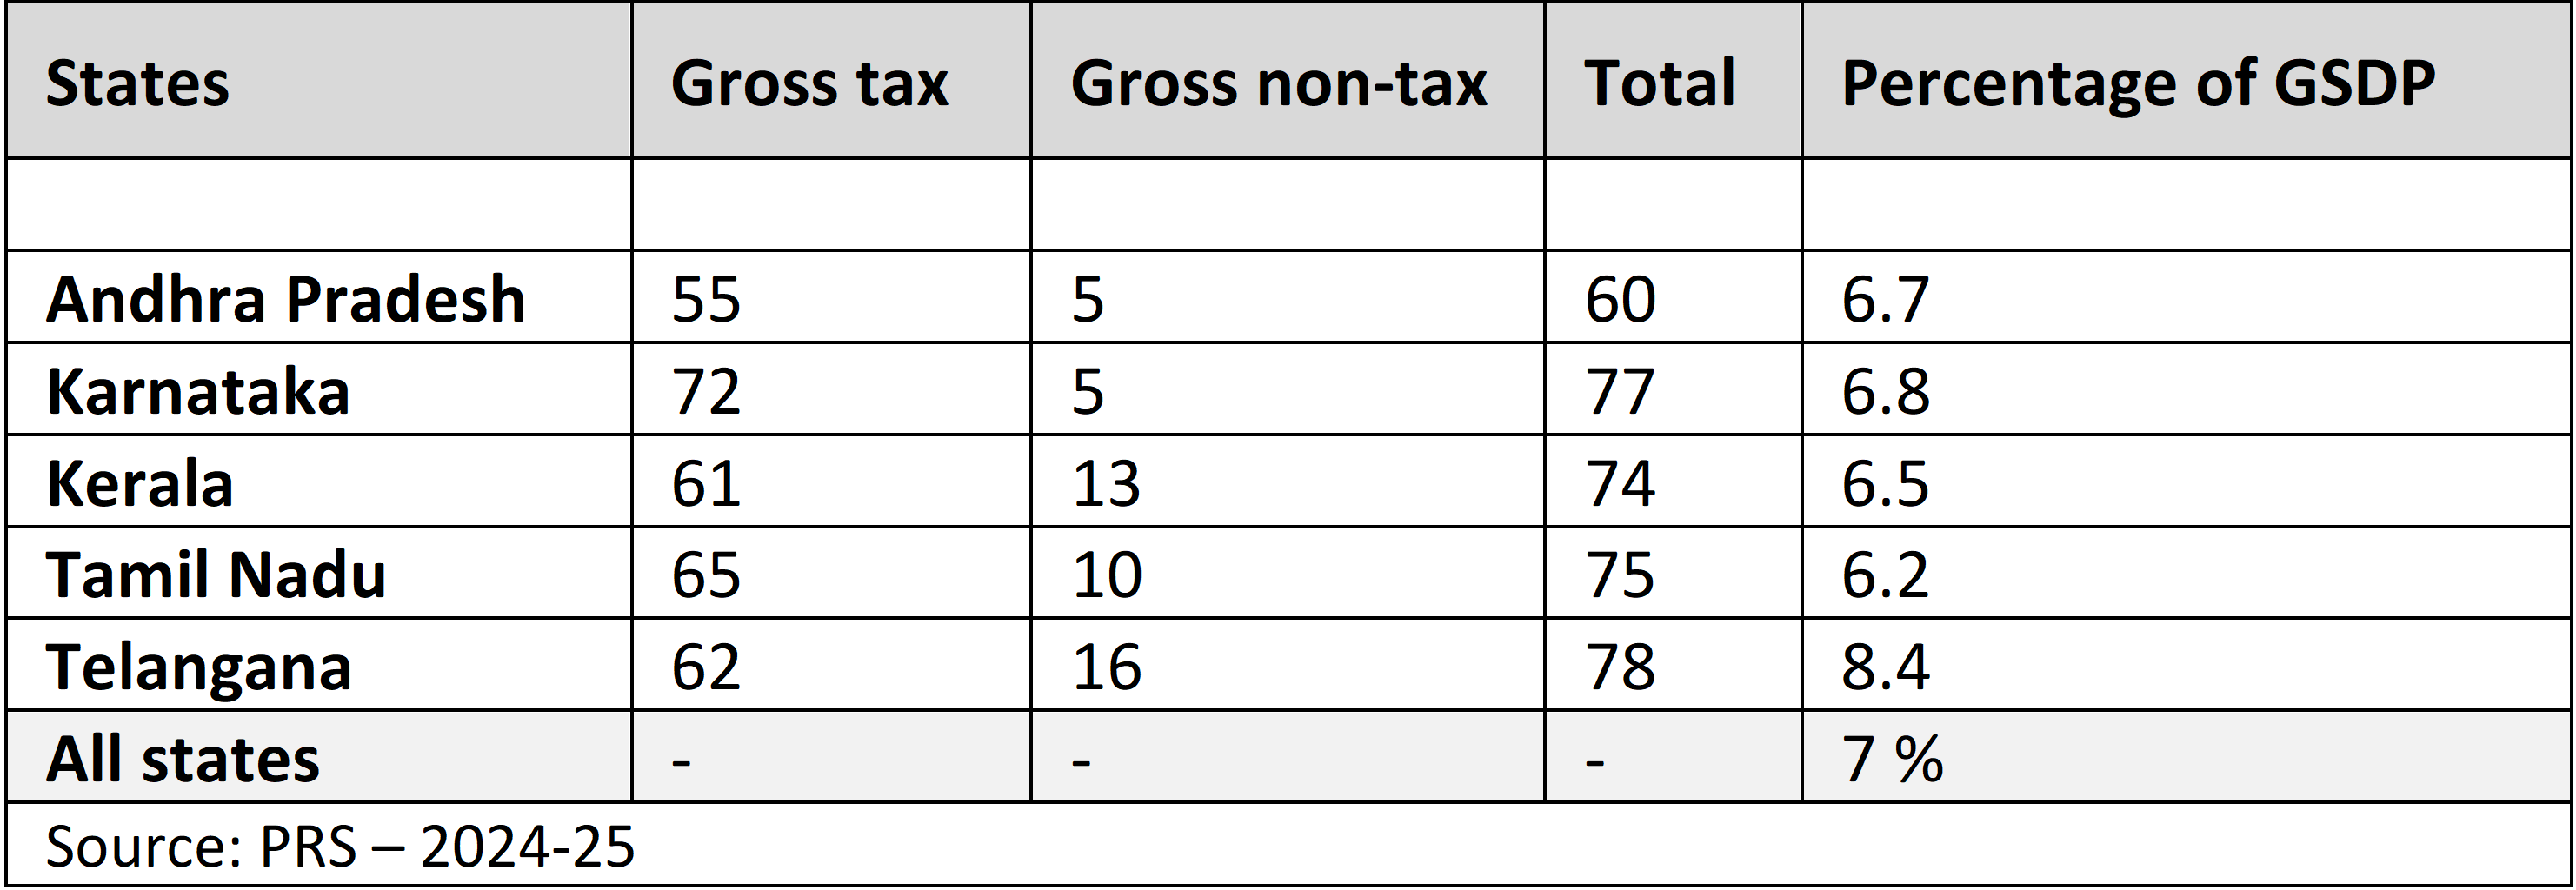
A central demand of the Telangana statehood movement was that the region should control its own financial resources (Nidhulu). Telangana’s fiscal position after state formation strongly validates this demand. It ranks first among the southern states in its own revenue resources—precisely the access the region had long sought—while the residual state now appears relatively resource-deficient.
What the tables do not show is that Telangana began with a revenue-surplus budget and was commended by the 15th Finance Commission for being among the top five revenue-surplus states, though it consequently did not receive revenue-deficit grants.
Table 1: Capacity of States to Raise Revenue, 2024-25
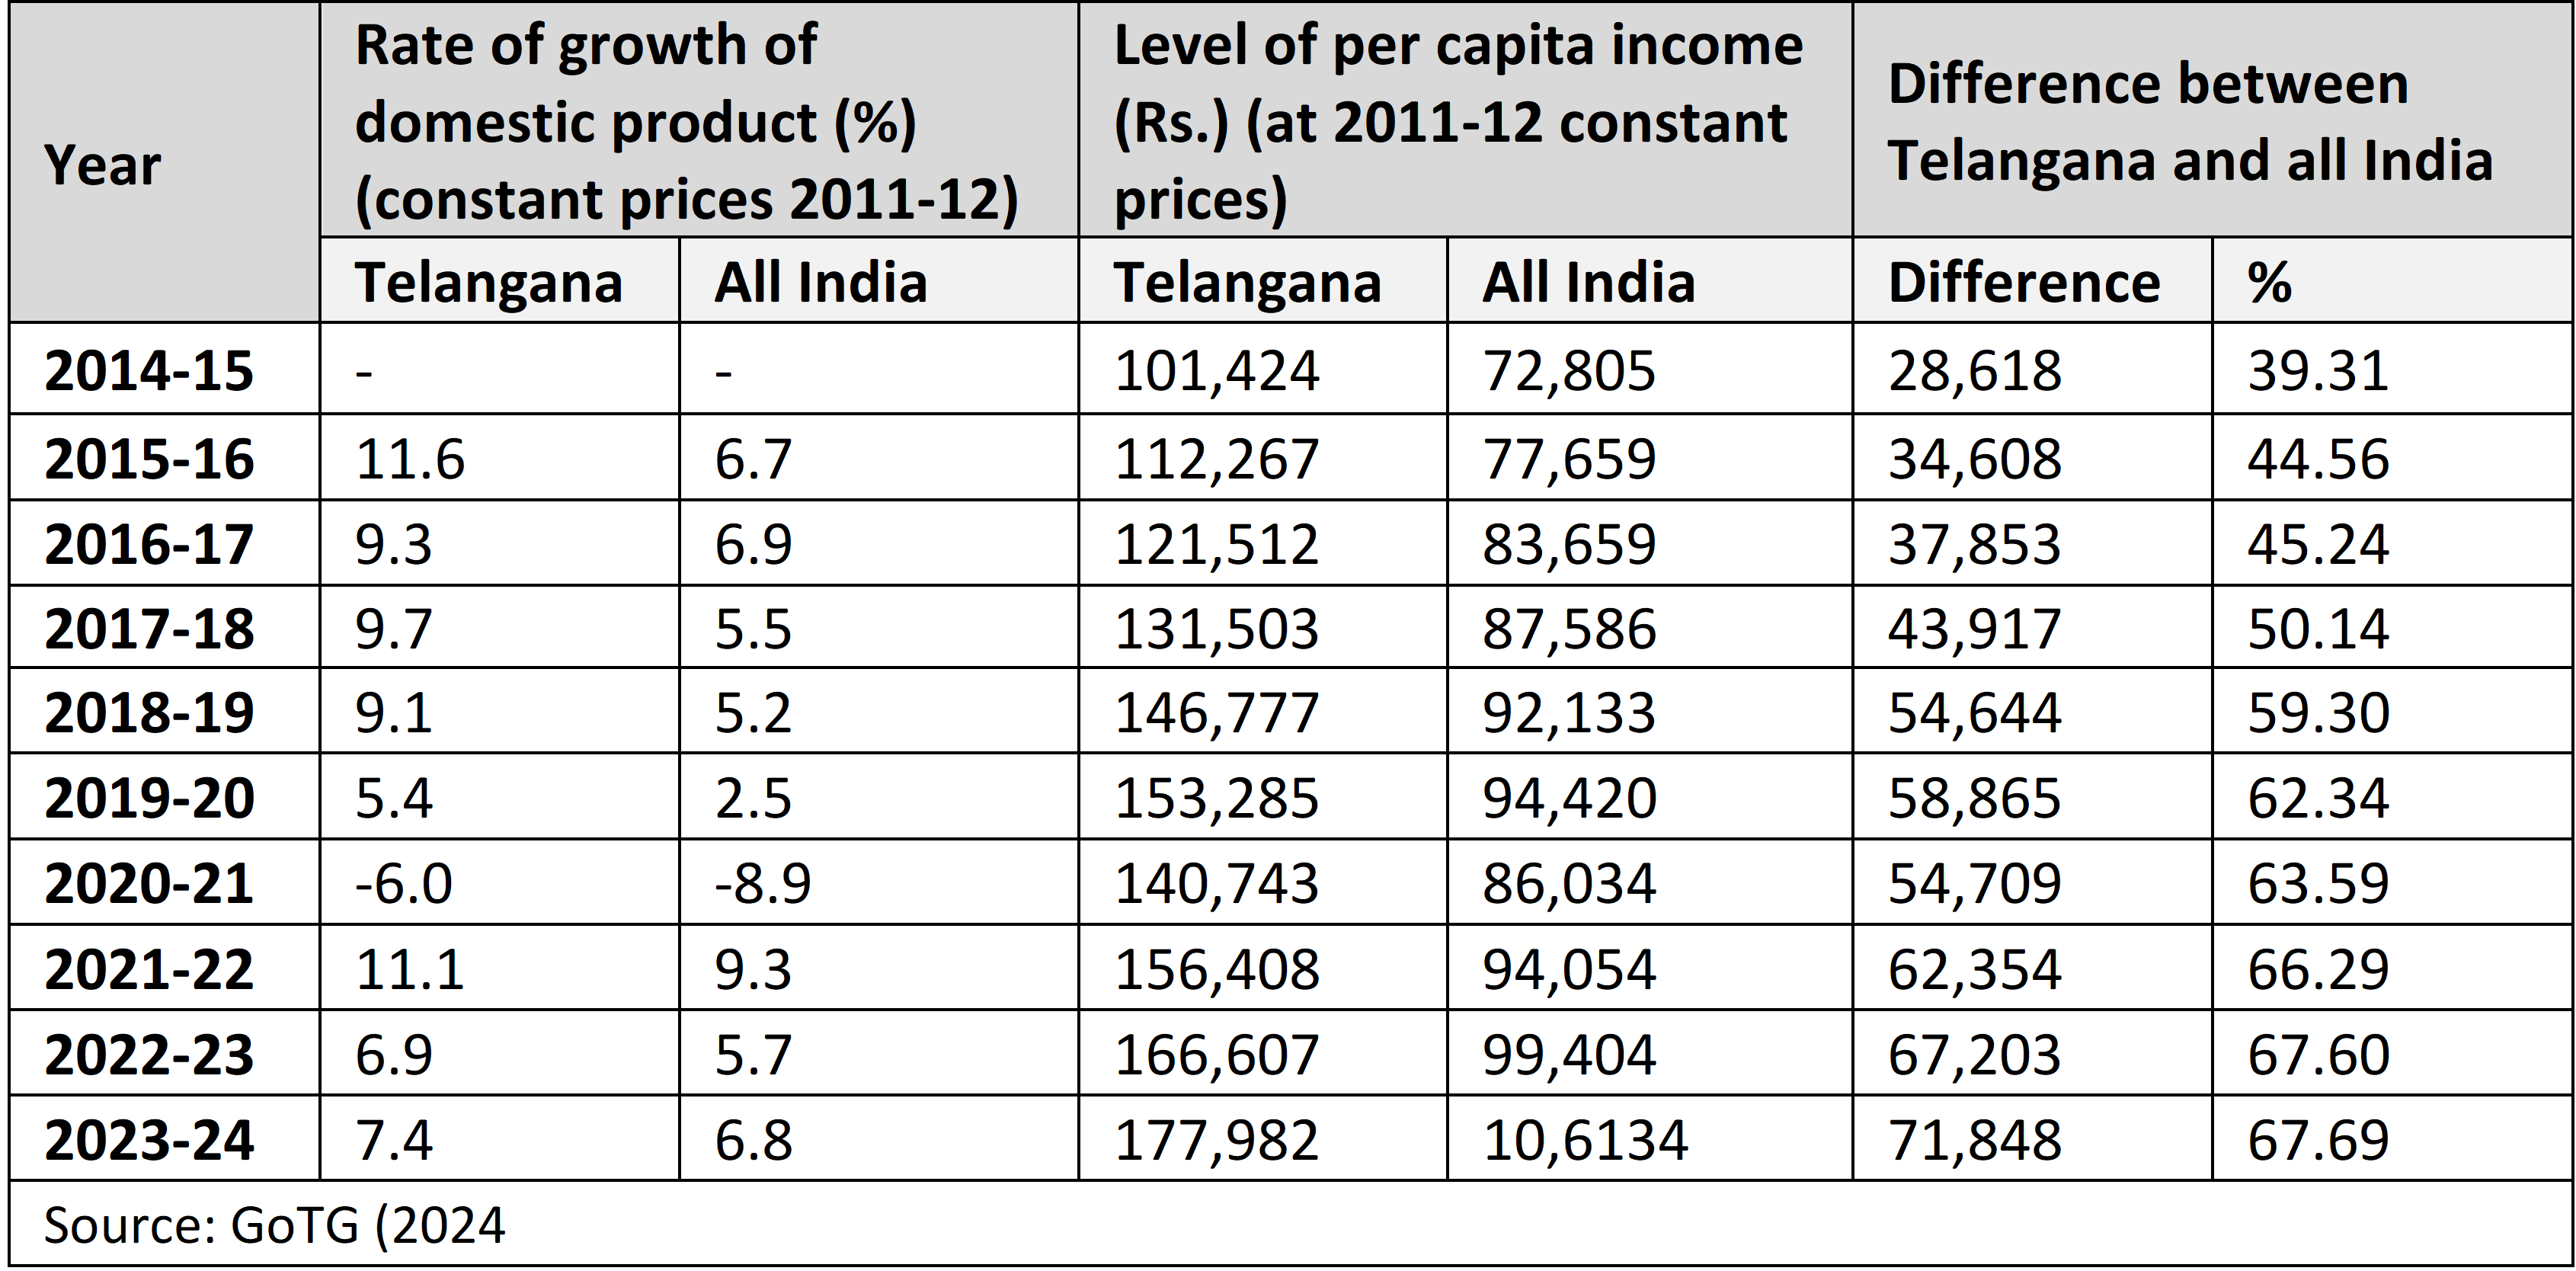
Telangana’s growth trajectory has been robust. Since 2014-15, its GSDP growth has consistently surpassed the all-India level, and its per capita GSDP has widened its lead over the national average from 39.3% in 2014-15 to 67.69% in 2023-24. By standard economic measures, this is a noteworthy performance.
Yet how far this growth has improved the living standards of ordinary people remains unclear. This motivates a closer look at education and health.
Table 2: Comparative Profile of Growth of Domestic Product & Level of Per Capita Income of Telangana & All India
Performance of Education Sector
Extensive literature covers state-level financing, school infrastructure, teacher availability and qualifications, differences between public and private institutions, rural-urban disparities, and student outcomes. This discussion focuses on state financial capacity and expenditure priorities.
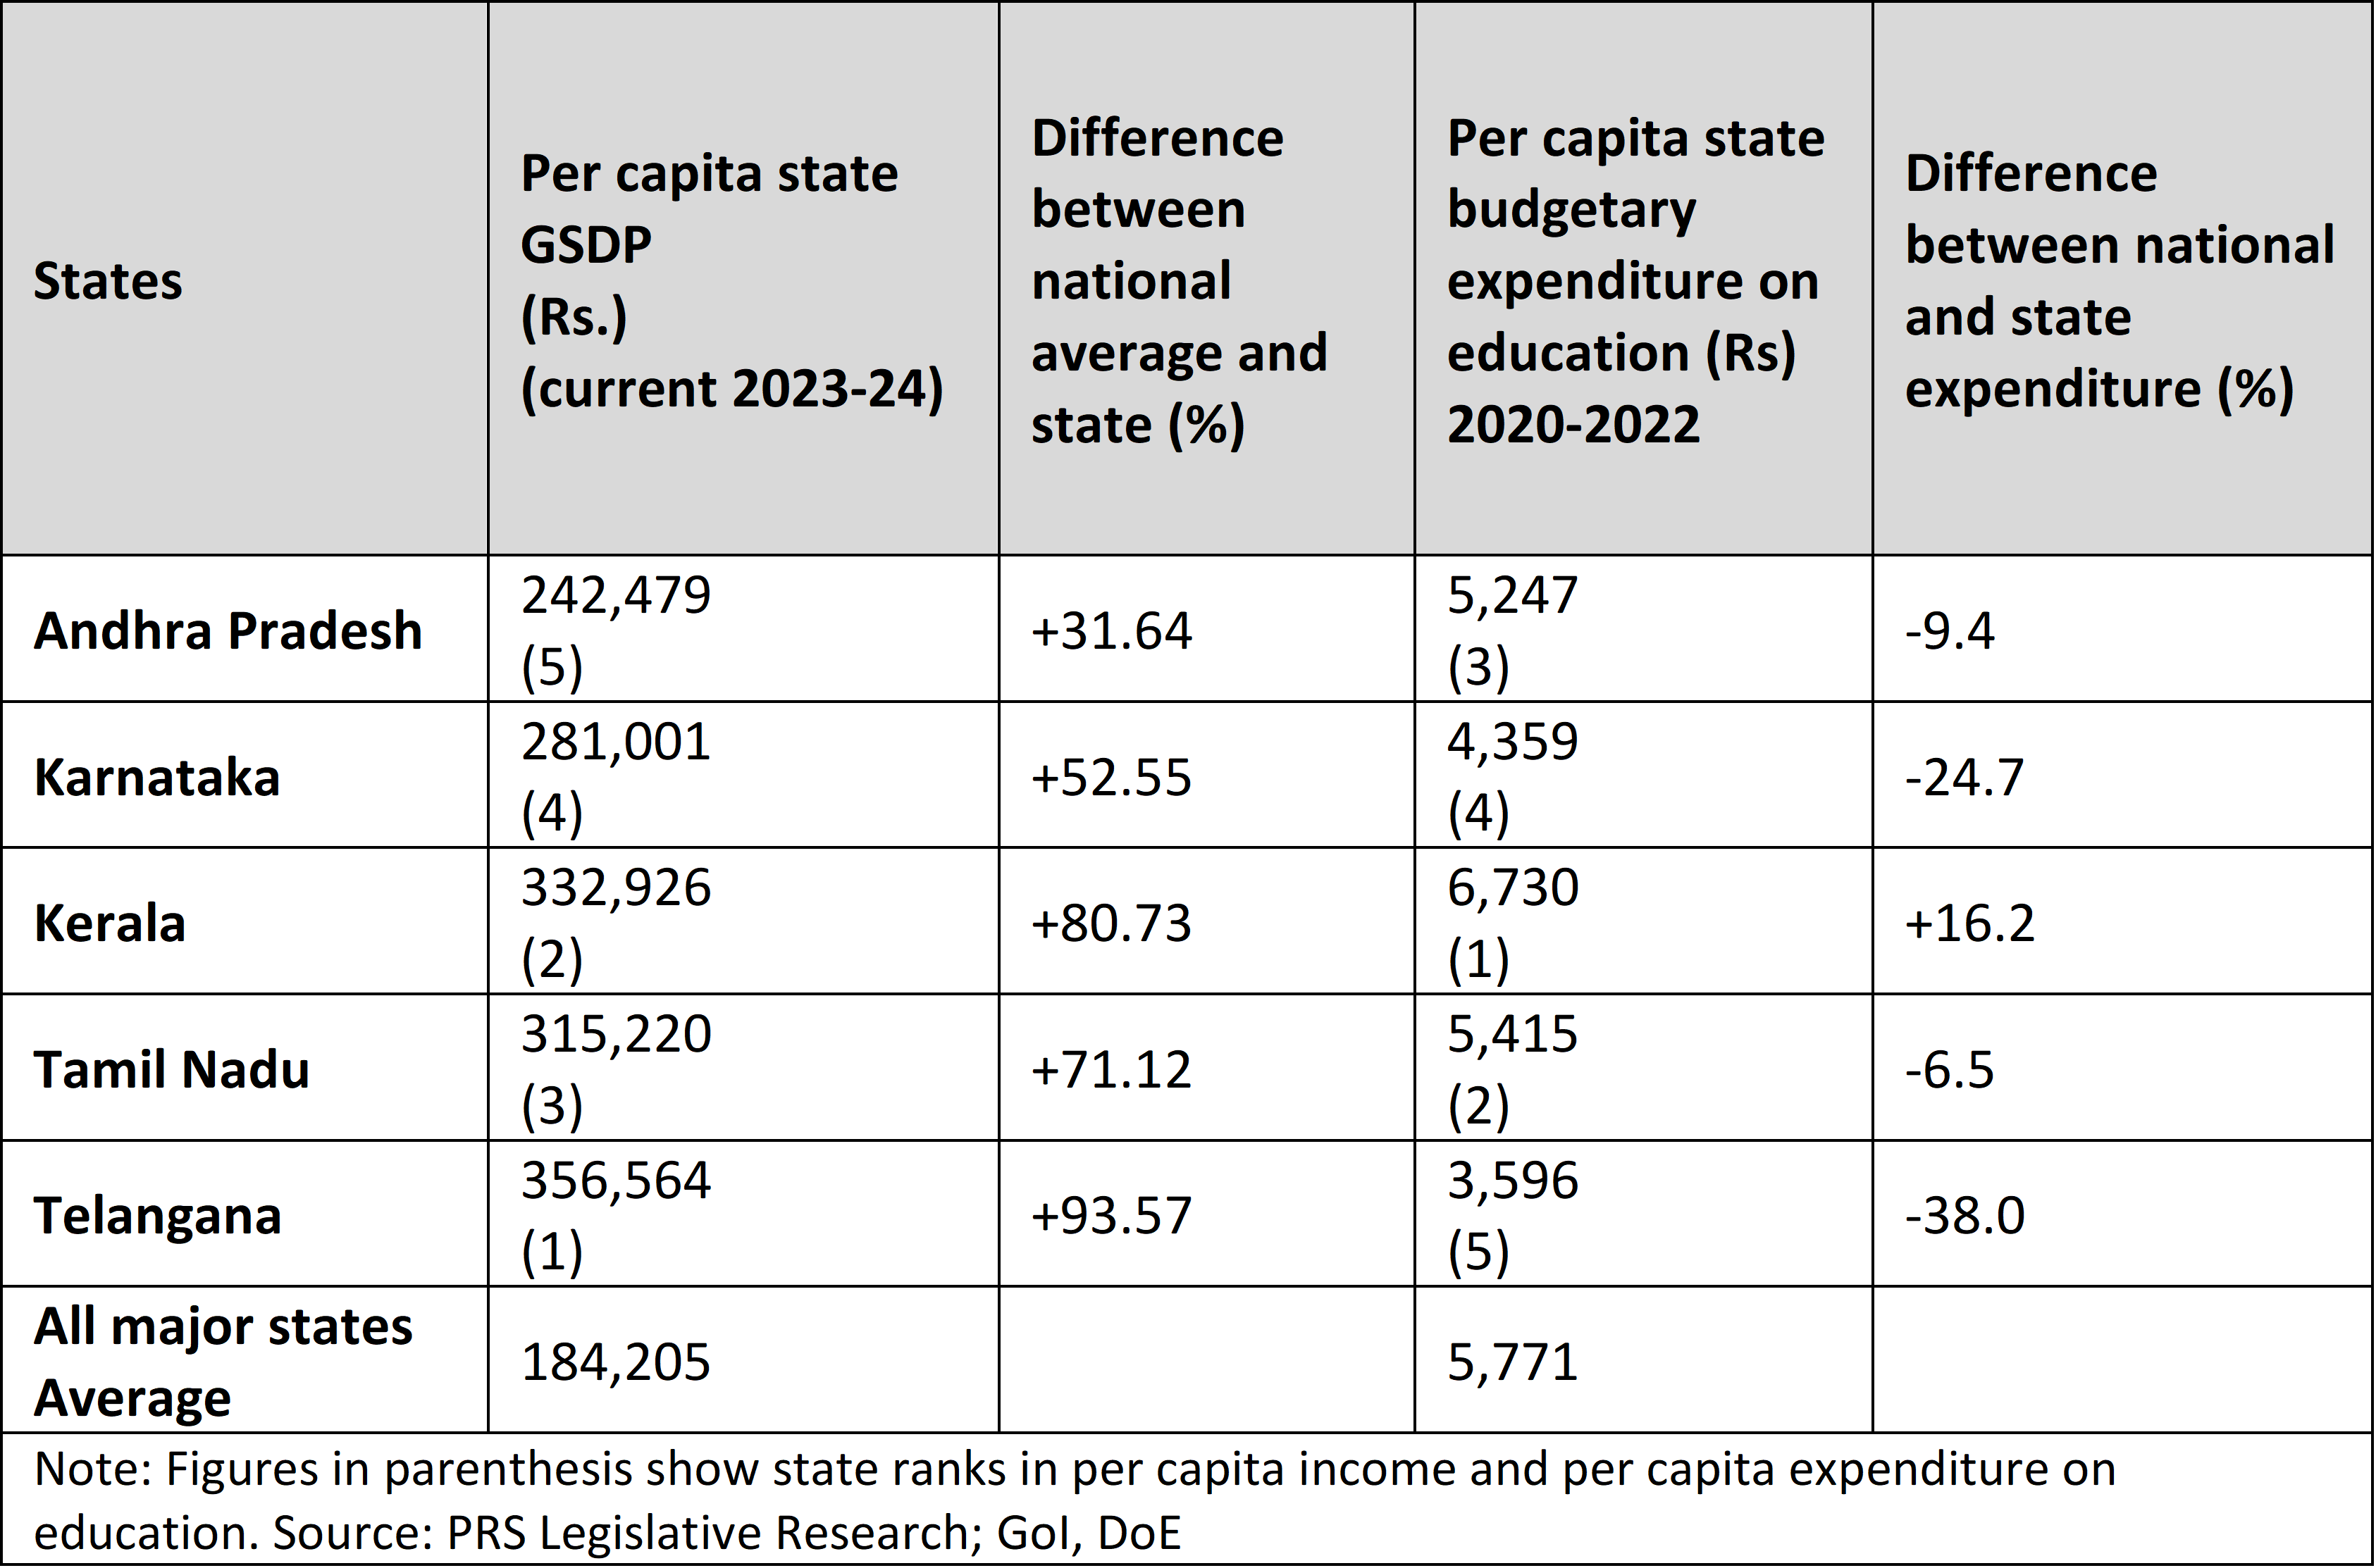
Despite its strong revenue base and its position as the southern state with the highest per capita GSDP in 2023-24, Telangana paradoxically records the lowest per capita budgetary spending on education—38% below the all-India average. This suggests that successive governments have largely continued the neoliberal orientation of the predecessor administration.
Public expenditure on education is low across the southern states, ranging from 2% of GSDP in Telangana to 3.46% in Kerala.
Kerala, by contrast, has long prioritised education. Karnataka appears to be drifting towards Telangana’s low-spending pattern, while Andhra Pradesh and Tamil Nadu have recently ceded some of their earlier advantages. These contrasts underline the disconnect between Telangana’s high growth and its limited investment in education.
Table 3: Per Capita State GSDP & Per Capita State Budgetary Expenditure on Education
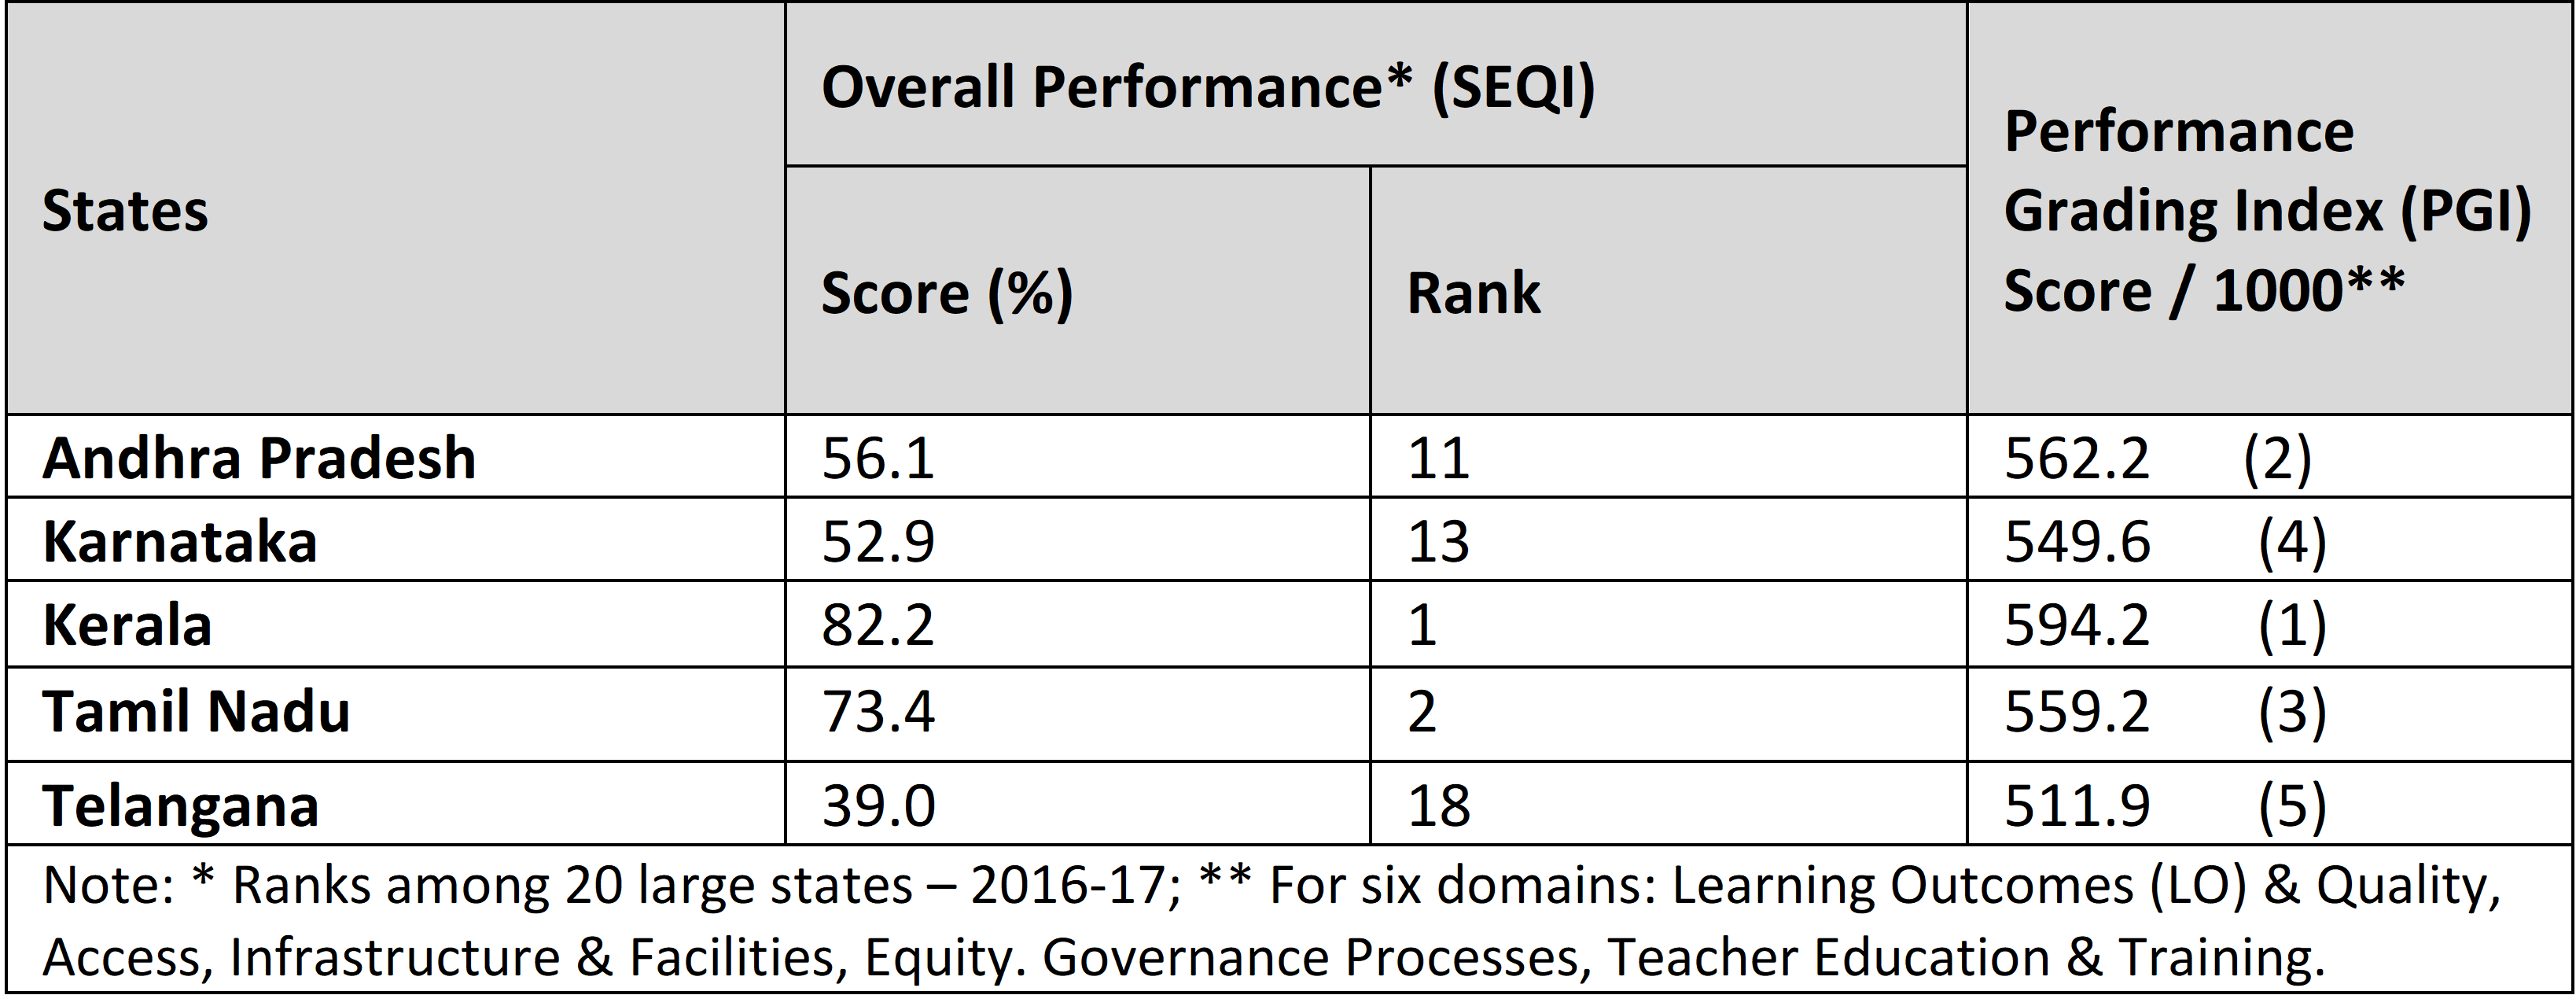
To assess school-level educational performance, this analysis draws on the NITI Aayog’s School Education Quality Index (SEQI) and the Union Ministry of Education’s Performance Grading Index (PGI). Both rely on the National Achievement Surveys earlier conducted by NCERT. SEQI, though not updated, offered a comprehensive comparison; PGI provides the latest rankings.
Across both indices, Telangana ranks at the bottom. In the SEQI, its score is less than half of Kerala’s.
Table 4: Overall Performance & Rank of School Education Quality Index & the Performance Grading Index
ASER 2023 and 2024, though limited to rural schools, are especially relevant given that India’s deepest quality deficits lie in rural education.
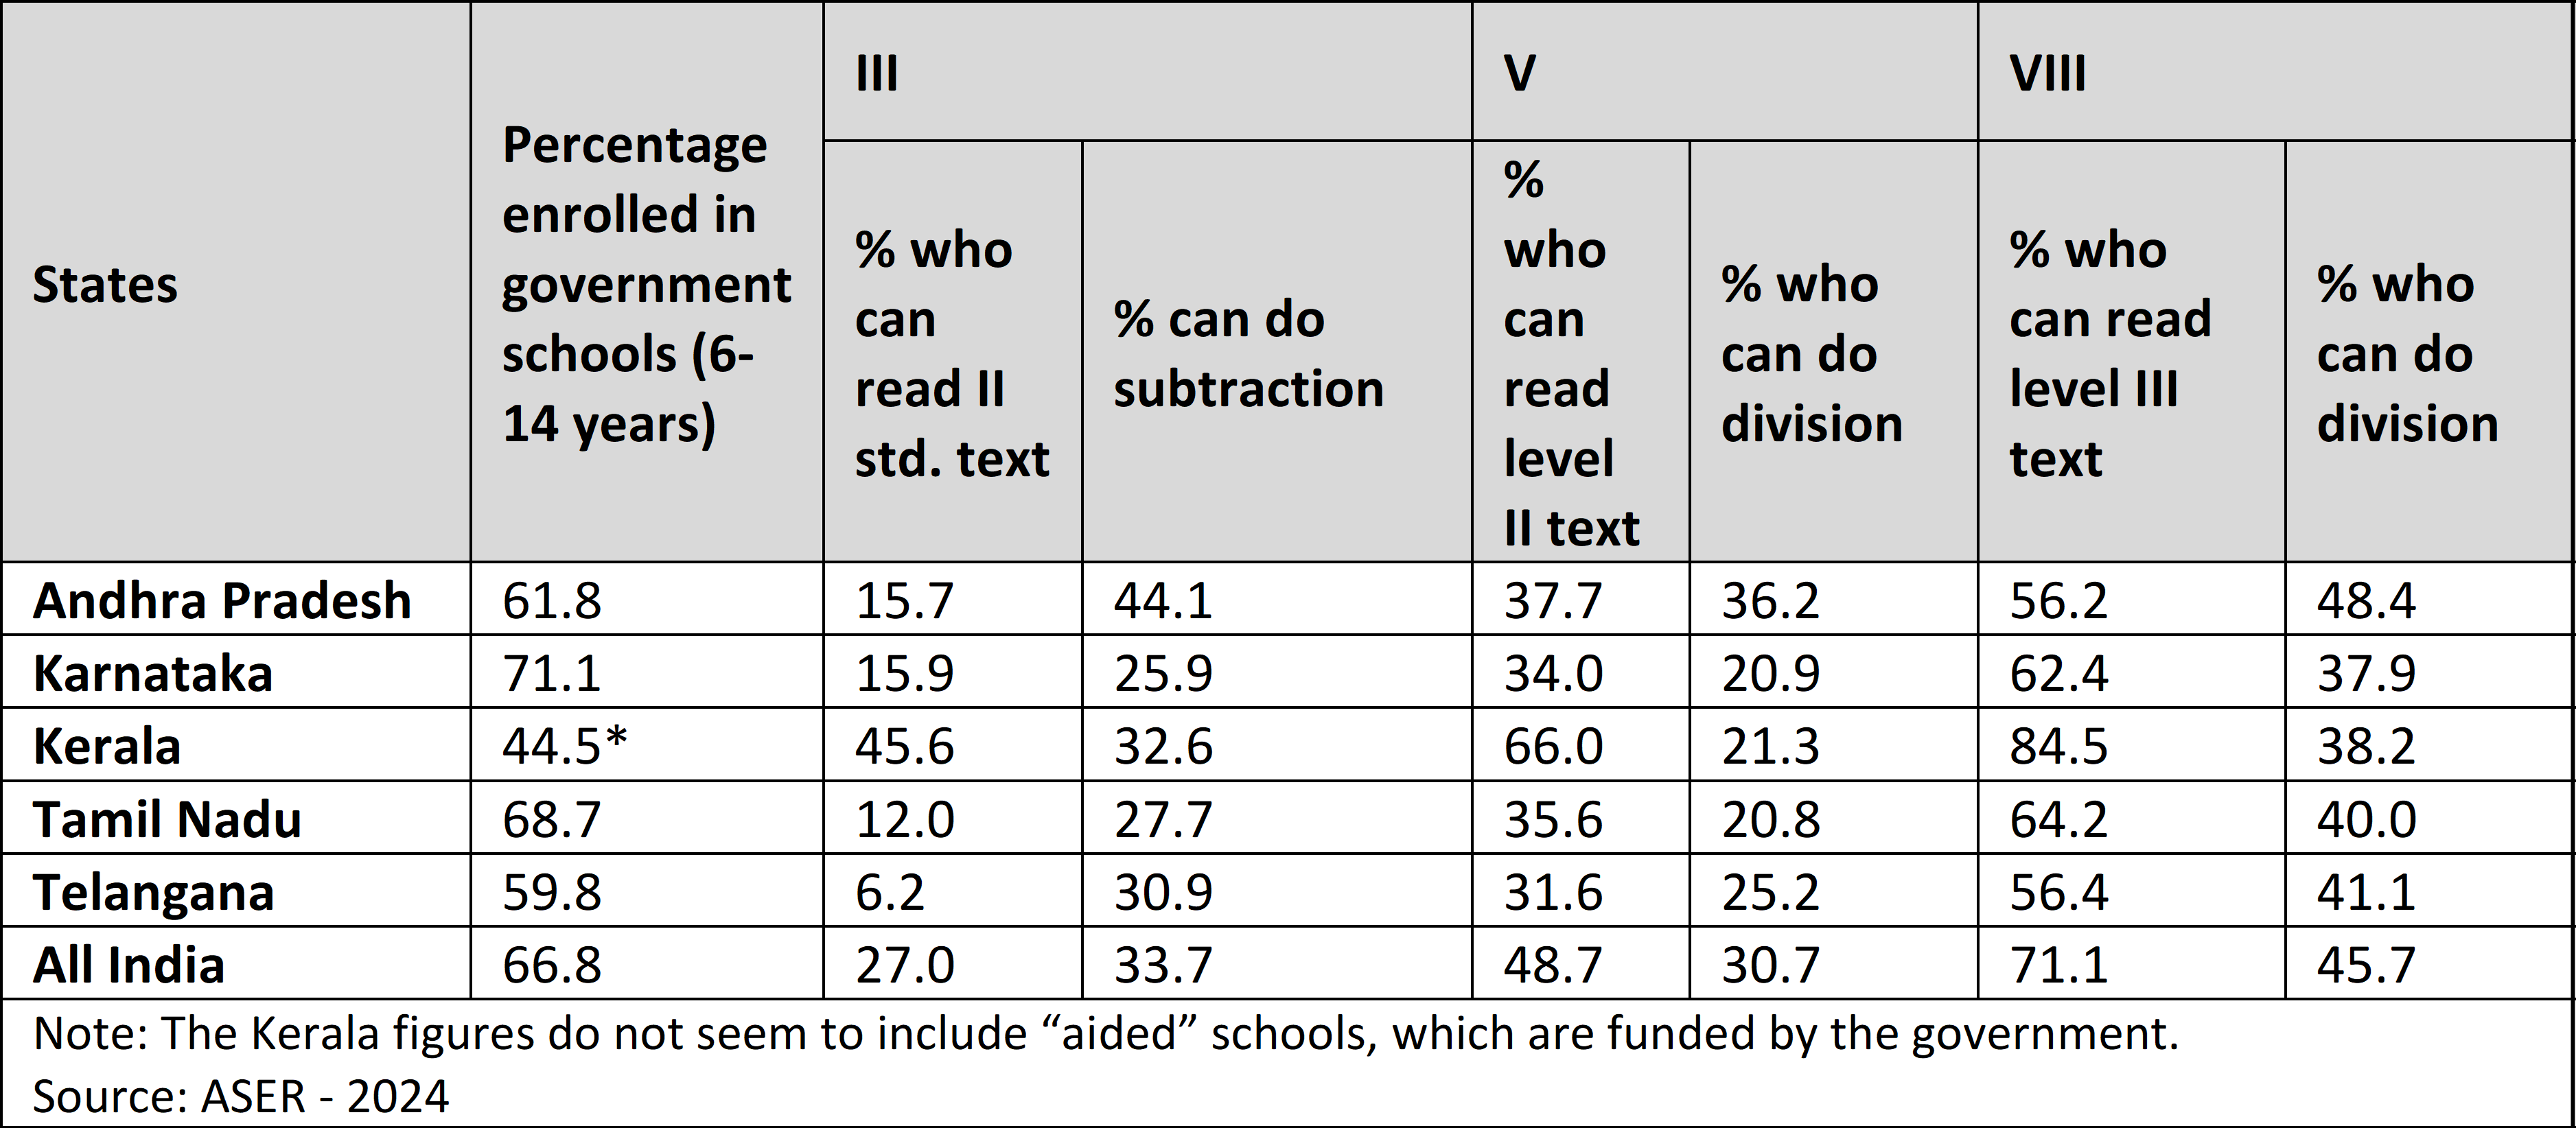
ASER 2024 shows that enrolment in rural government schools exceeds the national average in Karnataka and Tamil Nadu, and likely in Kerala. The Telugu states fall below the national average, with Telangana the lowest. Reading outcomes are especially poor. Only 6.2% of Telangana’s class III students can read a class II text—far below the national average of 27%. Reading improves across classes but remains well below the national average.
Arithmetic offers a different picture. Andhra Pradesh leads across all classes. Telangana performs better in arithmetic than in reading, ranking second in classes V and VIII, though still below the national mean.
Table 5: Enrolments in Government Schools & Learning Levels in Standards III, V, & VIII (Rural 2024)
ASER 2023 – Beyond Basics, which assesses youth aged 14–18, reveals disturbing conditions. This age group is at a pivotal transition; missing education here risks lifelong confinement to informal, low-paid work. The survey examines both youth activities and their abilities—reading, arithmetic, English, and basic digital and transactional skills.
Table 6: Activity of Youth (14-18)
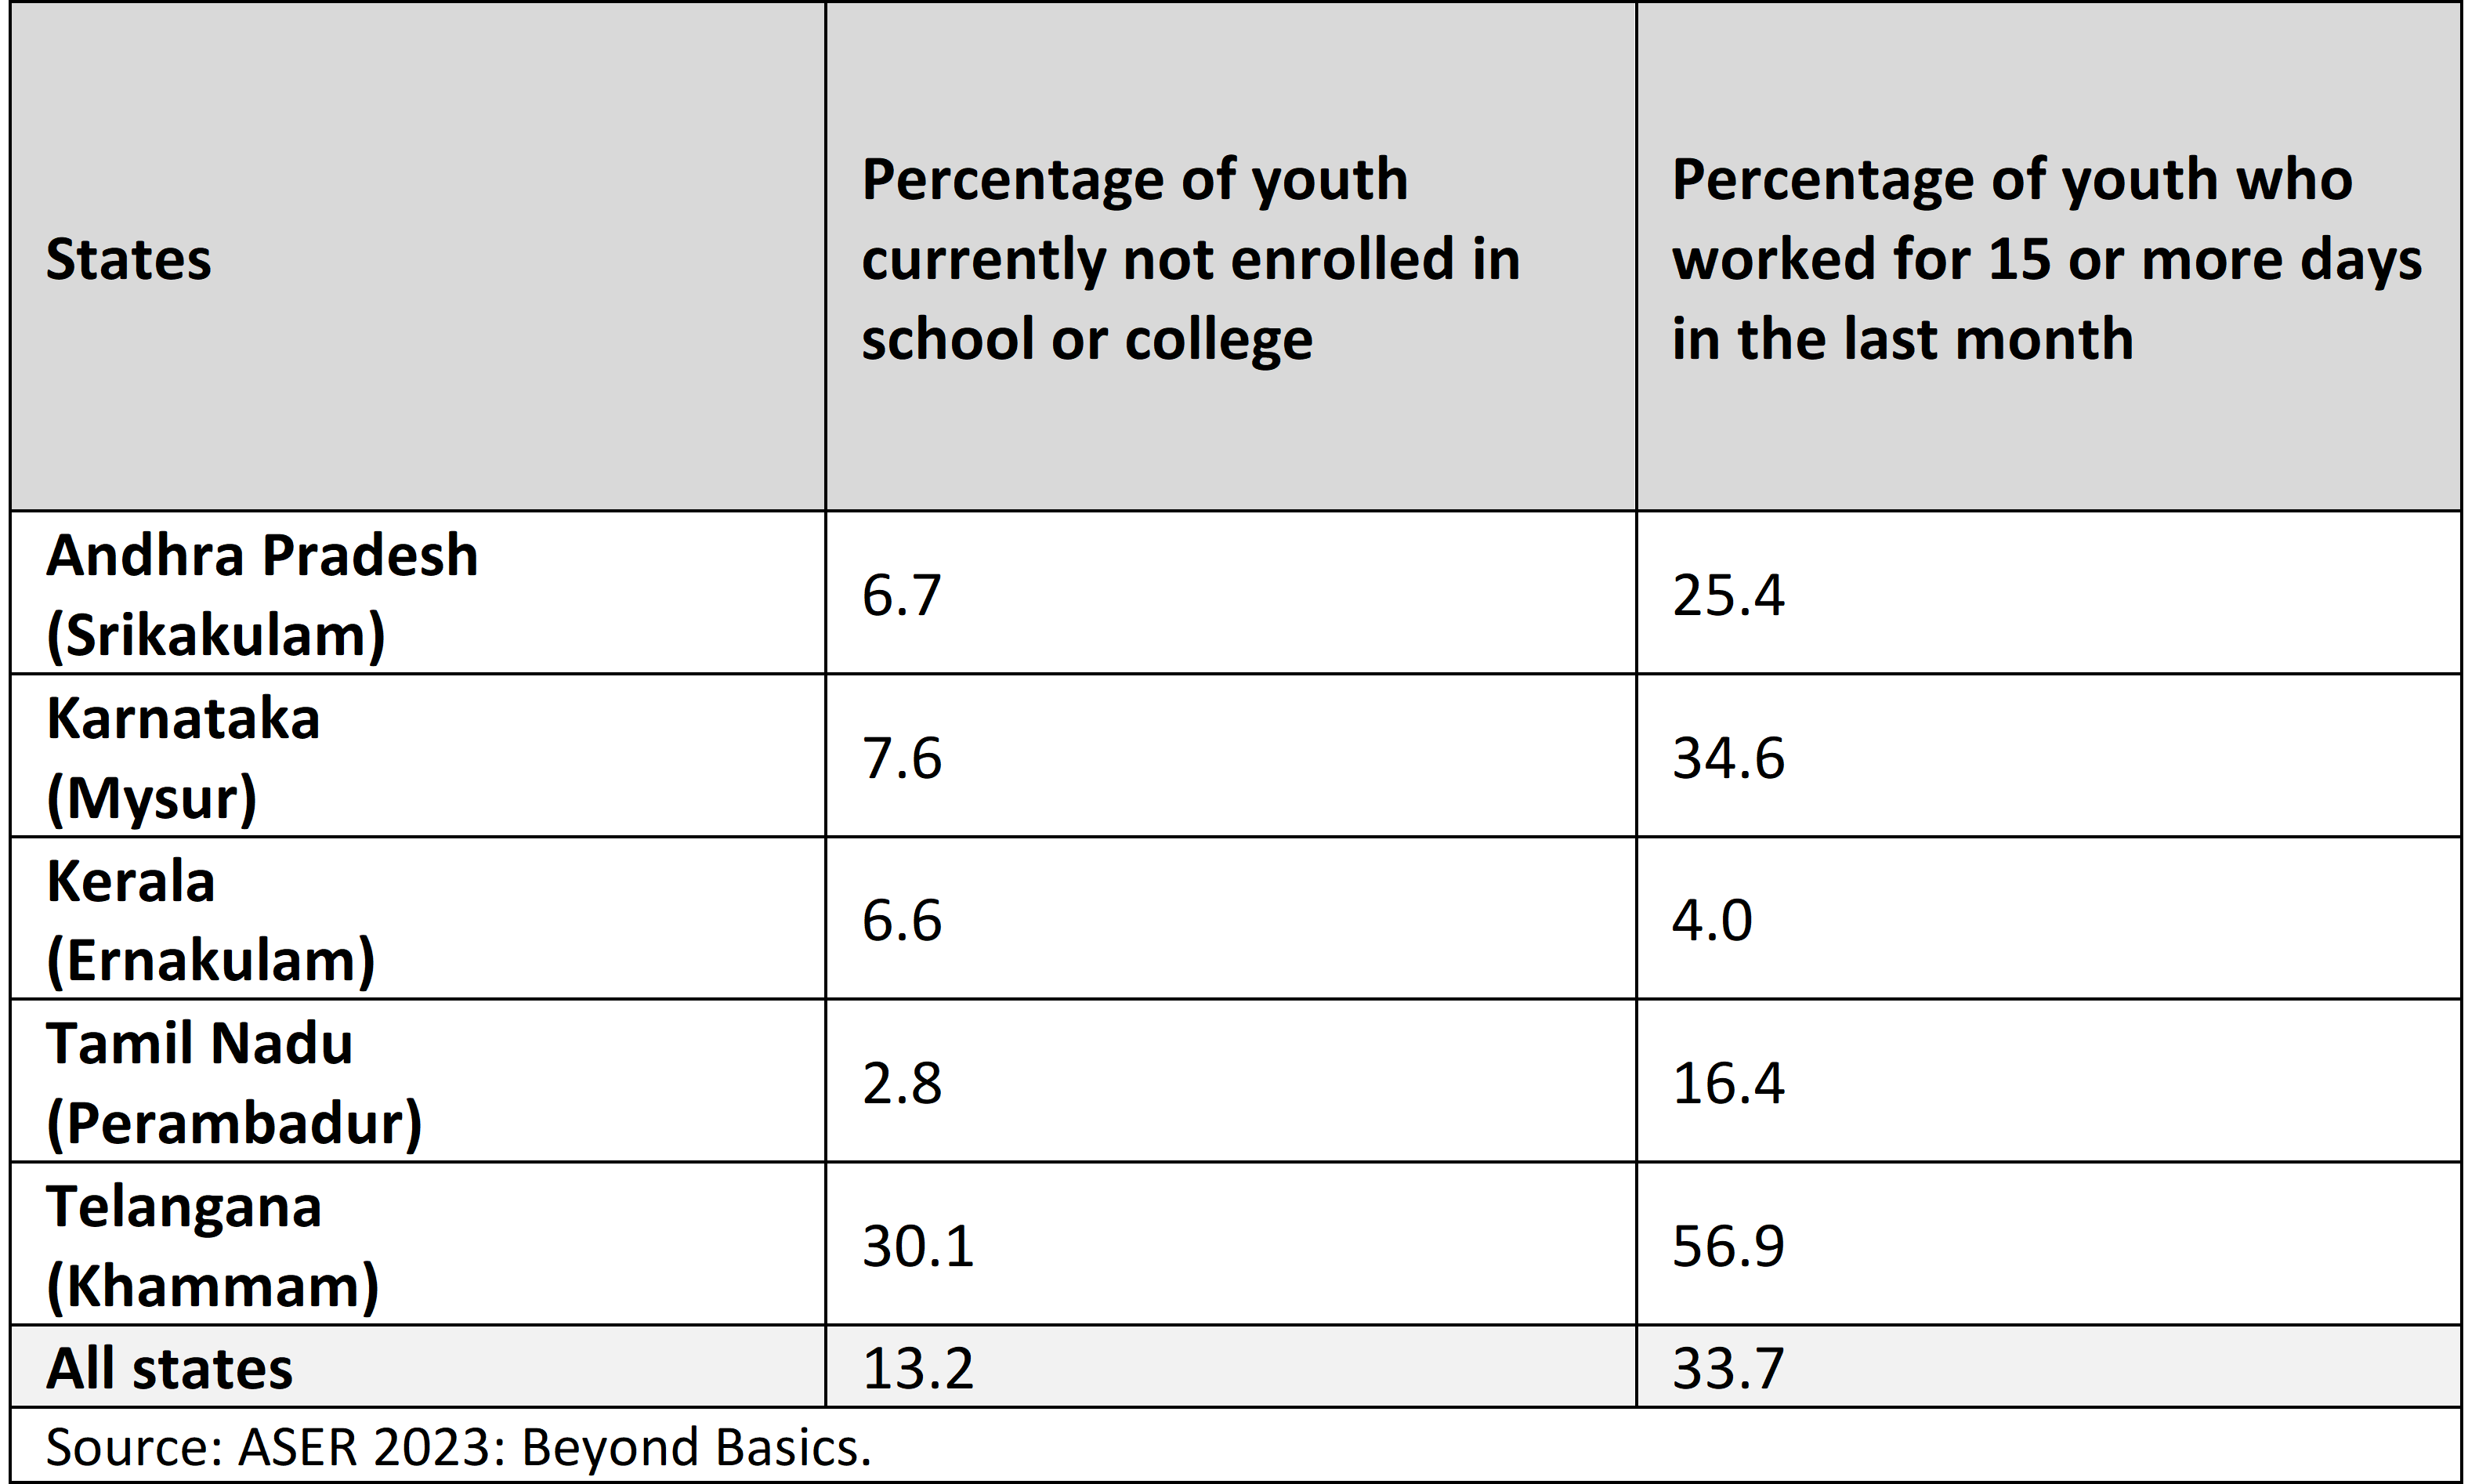
In Telangana, 30% of youth aged 14–18 are neither in school nor college, compared with 2.8% in Tamil Nadu. Another 56.9% reported working for at least 15 days in the month before the survey. Taken together, roughly 60% of a generation has lost access to meaningful education.
Two structural factors stand out: poor school quality and the design of Telangana’s school system. Unlike Tamil Nadu, where government schools run to class 12 with STEM streams, Telangana’s government schools stop at class 10, requiring students to shift to costly private intermediate colleges—prompting many poor students to drop out.
Table 7: Ability of Youth Age 14-18 (2023)
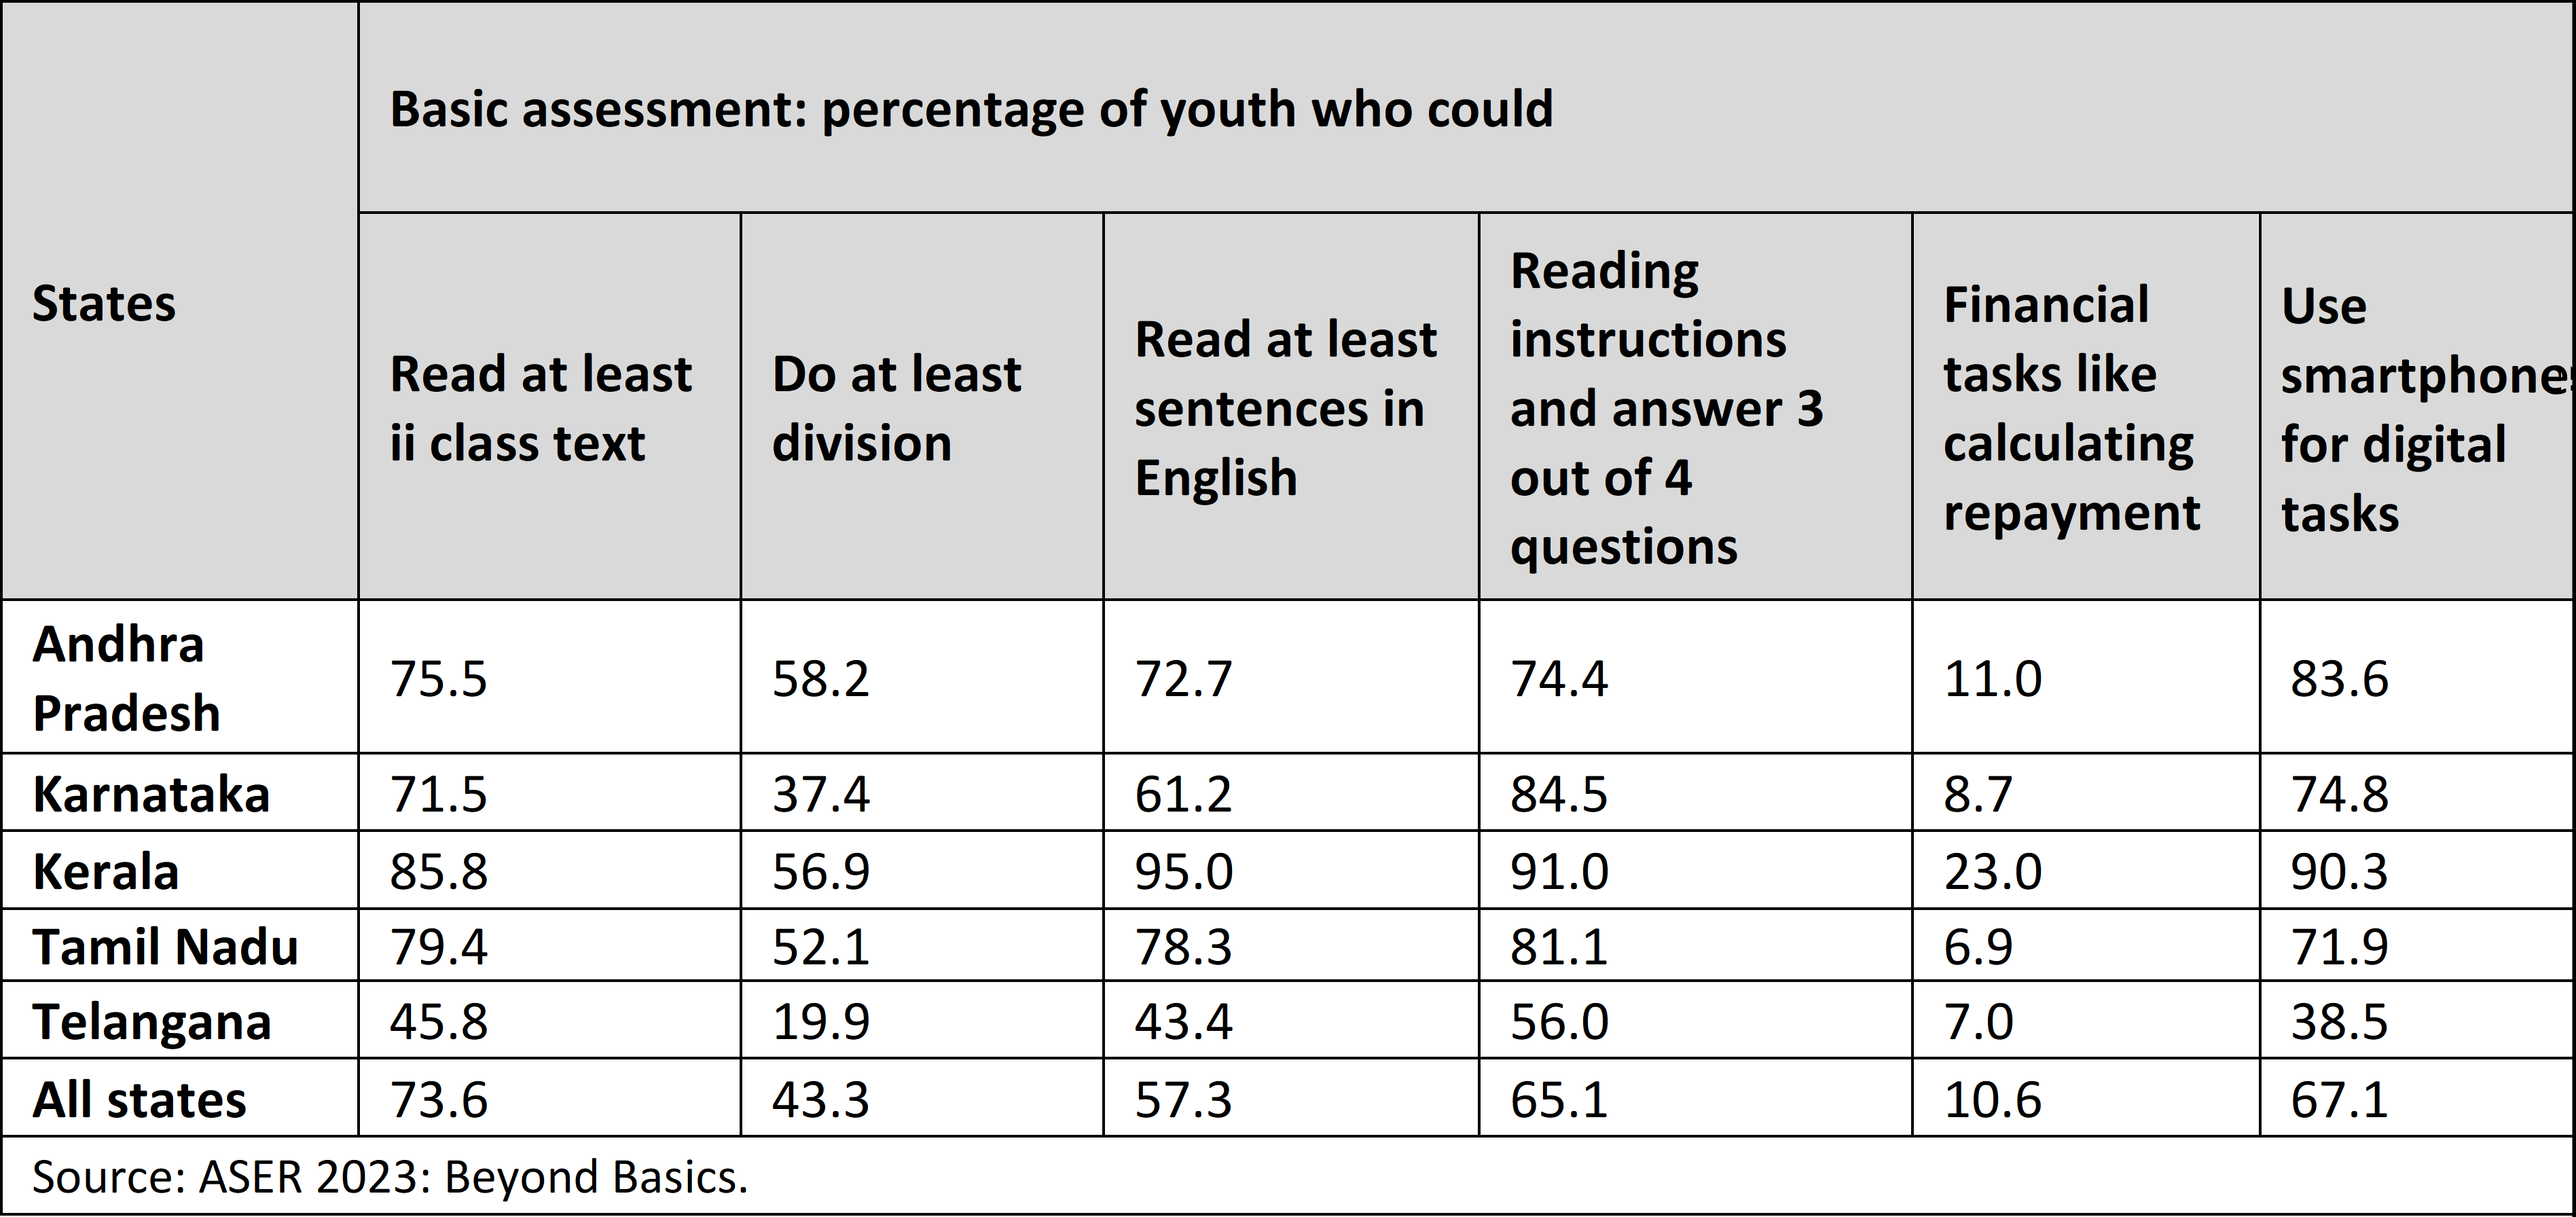
ASER 2023 shows Telangana at the bottom across all six assessment tasks. Reading ability is only 45.8% (vs. 71–86% in other southern states). In arithmetic, Andhra Pradesh leads (58.2%), while Telangana ranks last (19.9%).
Kerala displays the strongest youth abilities across most indicators; Andhra Pradesh leads in arithmetic. Telangana faces a deeper challenge: structural and qualitative failures in schooling that are impairing the life chances of an entire generation.
This neglect extends to higher education. Telangana appears disengaged from the national agenda, even as the NITI Aayog’s Viksit Bharat vision calls for doubling the Gross Enrolment Ratio by 2047.
Recent arguments from the World Bank stress the importance of strong public institutions and warn against overreliance on private providers, which tend to underinvest in socially necessary but less profitable fields (2020). Scholars such as Tilak (2025) similarly describe higher education as a “greater public good”, necessitating strong state leadership.
Table 8: Higher Education: Gross Enrolment Rates, Government Expenditure, & Ranks of State Public Universities (2020-21 & 2021-22)
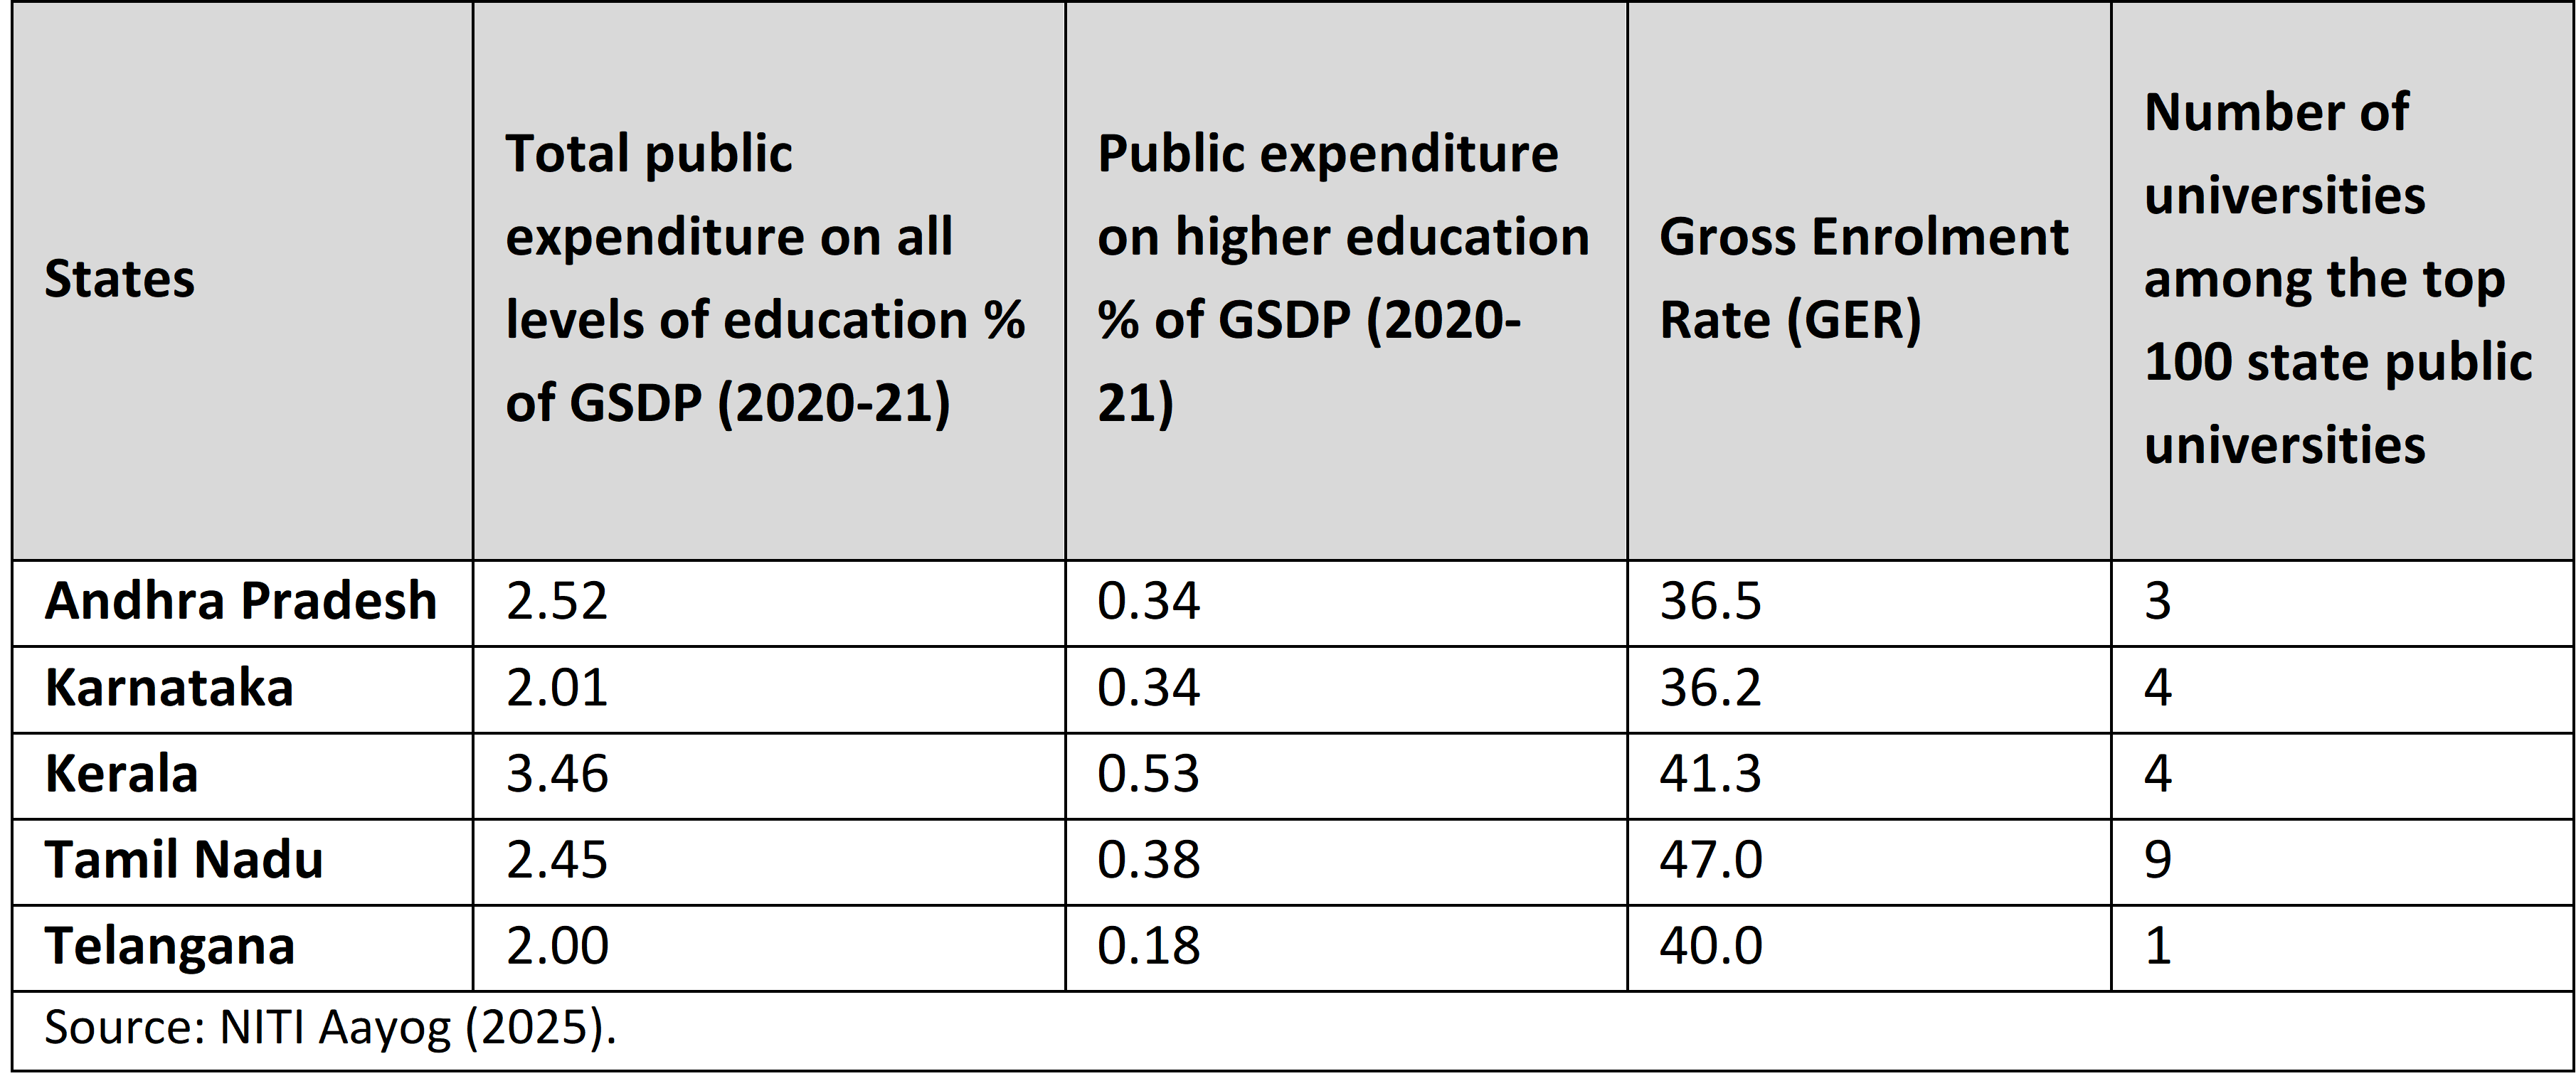
Public expenditure on education is low across the southern states, ranging from 2% of GSDP in Telangana to 3.46% in Kerala. Spending on higher education is particularly inadequate: Telangana allocates just 0.18% of its GSDP—one-third of Kerala’s 0.53%. Unsurprisingly, the quality of public universities mirrors expenditure. Kerala, though smaller, has four state public universities among the top 100; Telangana has only one. Tilak notes that Telangana’s growth in higher education is marred by uneven expansion, poor quality, excessive private-sector dominance, and too many mono-disciplinary institutions.
Performance of Health Sector
It is helpful to begin with an understanding of the role of health within the broader, changed perspective of development as well-being. Good health can certainly be viewed as a means to further economic development, and this is a useful way to raise the priority of health-related investment.
Yet this instrumental view has limits, because it fails to fully acknowledge the intrinsic value of health and a broader understanding of development. An alternative perspective sees health as both intrinsically and instrumentally valuable, but ultimately treats it as an end in itself. In this view, opportunities for good health are “constituent components of development” and need not be justified only by their contribution to income or output. This perspective also recognises the close links between health and other social goals, such as education, and stresses health’s importance for people’s ability to live lives they value (Ruger 2003).
Across all the states, the large gap between total and government health expenditure—both as a share of GSDP and in per capita terms—shows that a substantial part of health spending is borne directly by households.
Table 9 presents health expenditure in two parts. The first shows total health expenditure in the state, combining private and public spending. The second shows government expenditure on health, expressed as a ratio to GSDP, as a share of total government budgetary expenditure, and as per capita public health spending.
Across all the states, the large gap between total and government health expenditure—both as a share of GSDP and in per capita terms—shows that a substantial part of health spending is borne directly by households. This share ranges from 48.2% in Tamil Nadu to 67.5% in Kerala. At the same time, Kerala ranks at the top both in the ratio of total health expenditure to GSDP (5.2%) and in the ratio of government health expenditure to GSDP (1.7%).
Looking at the share of health in total budgetary expenditure, no state has yet reached the 8% norm set by the National Health Policy 2017, although Andhra Pradesh, at 7%, comes close. Telangana, despite leading the other states in per capita GSDP, is at the bottom on all measures of public expenditure on health—as a ratio of GSDP (1%), as a share of the budget (4.6%), and in per capita government health spending. The consequences of such poor performance in public funding for health are clearly visible in the health conditions of the population.
Table 9: Key Health Financing Indicators, 2021-22
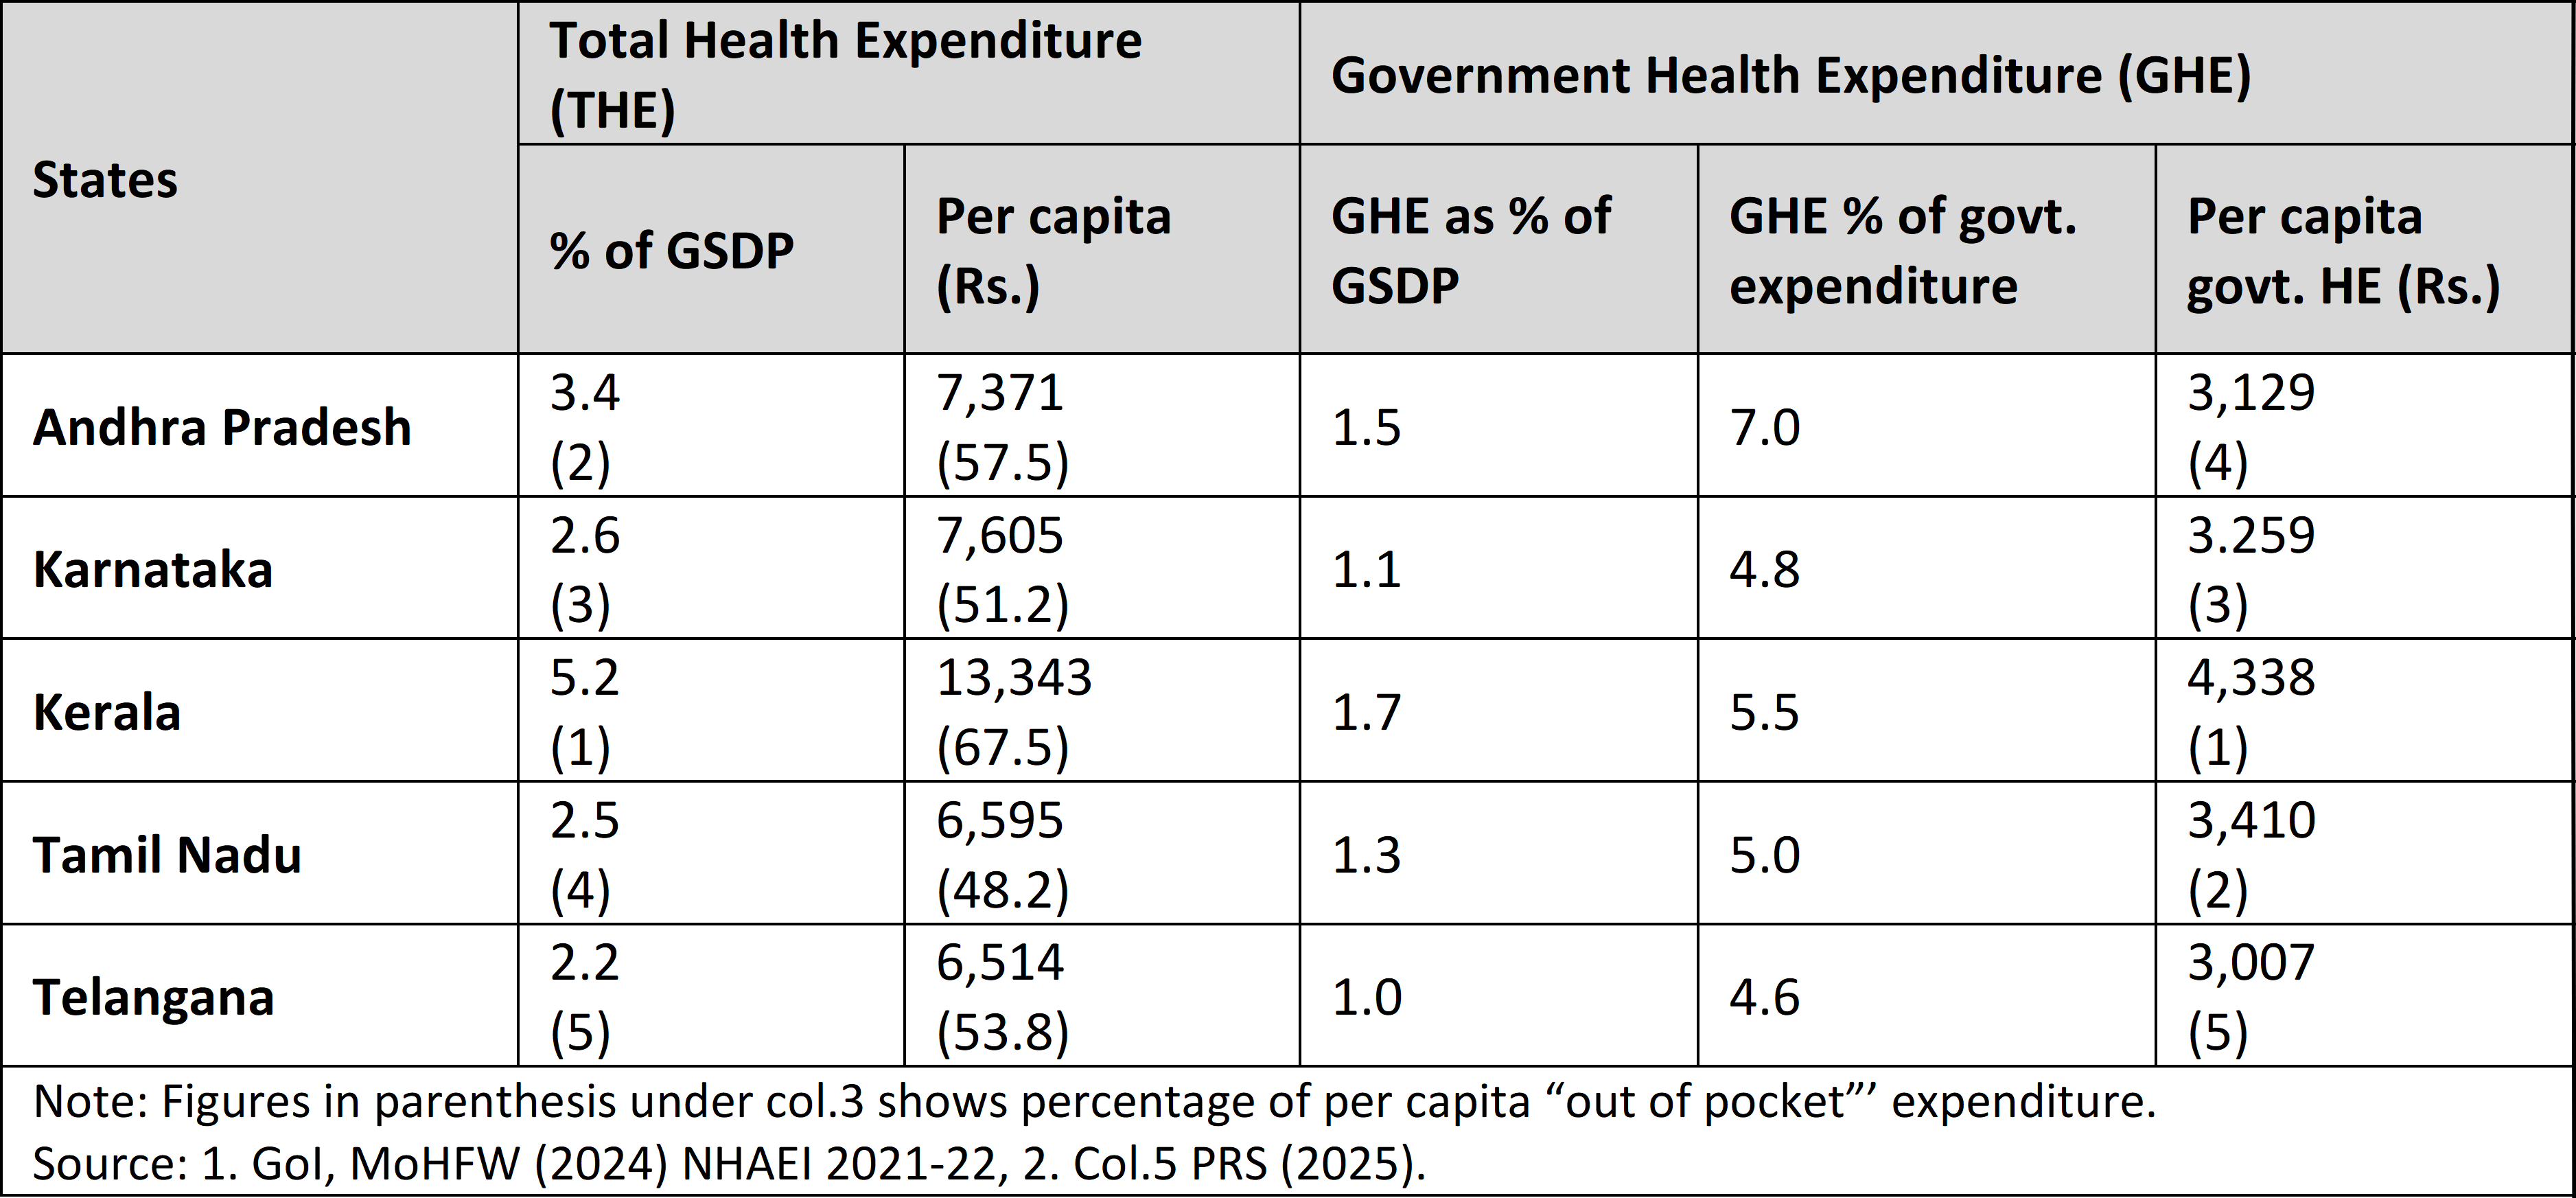
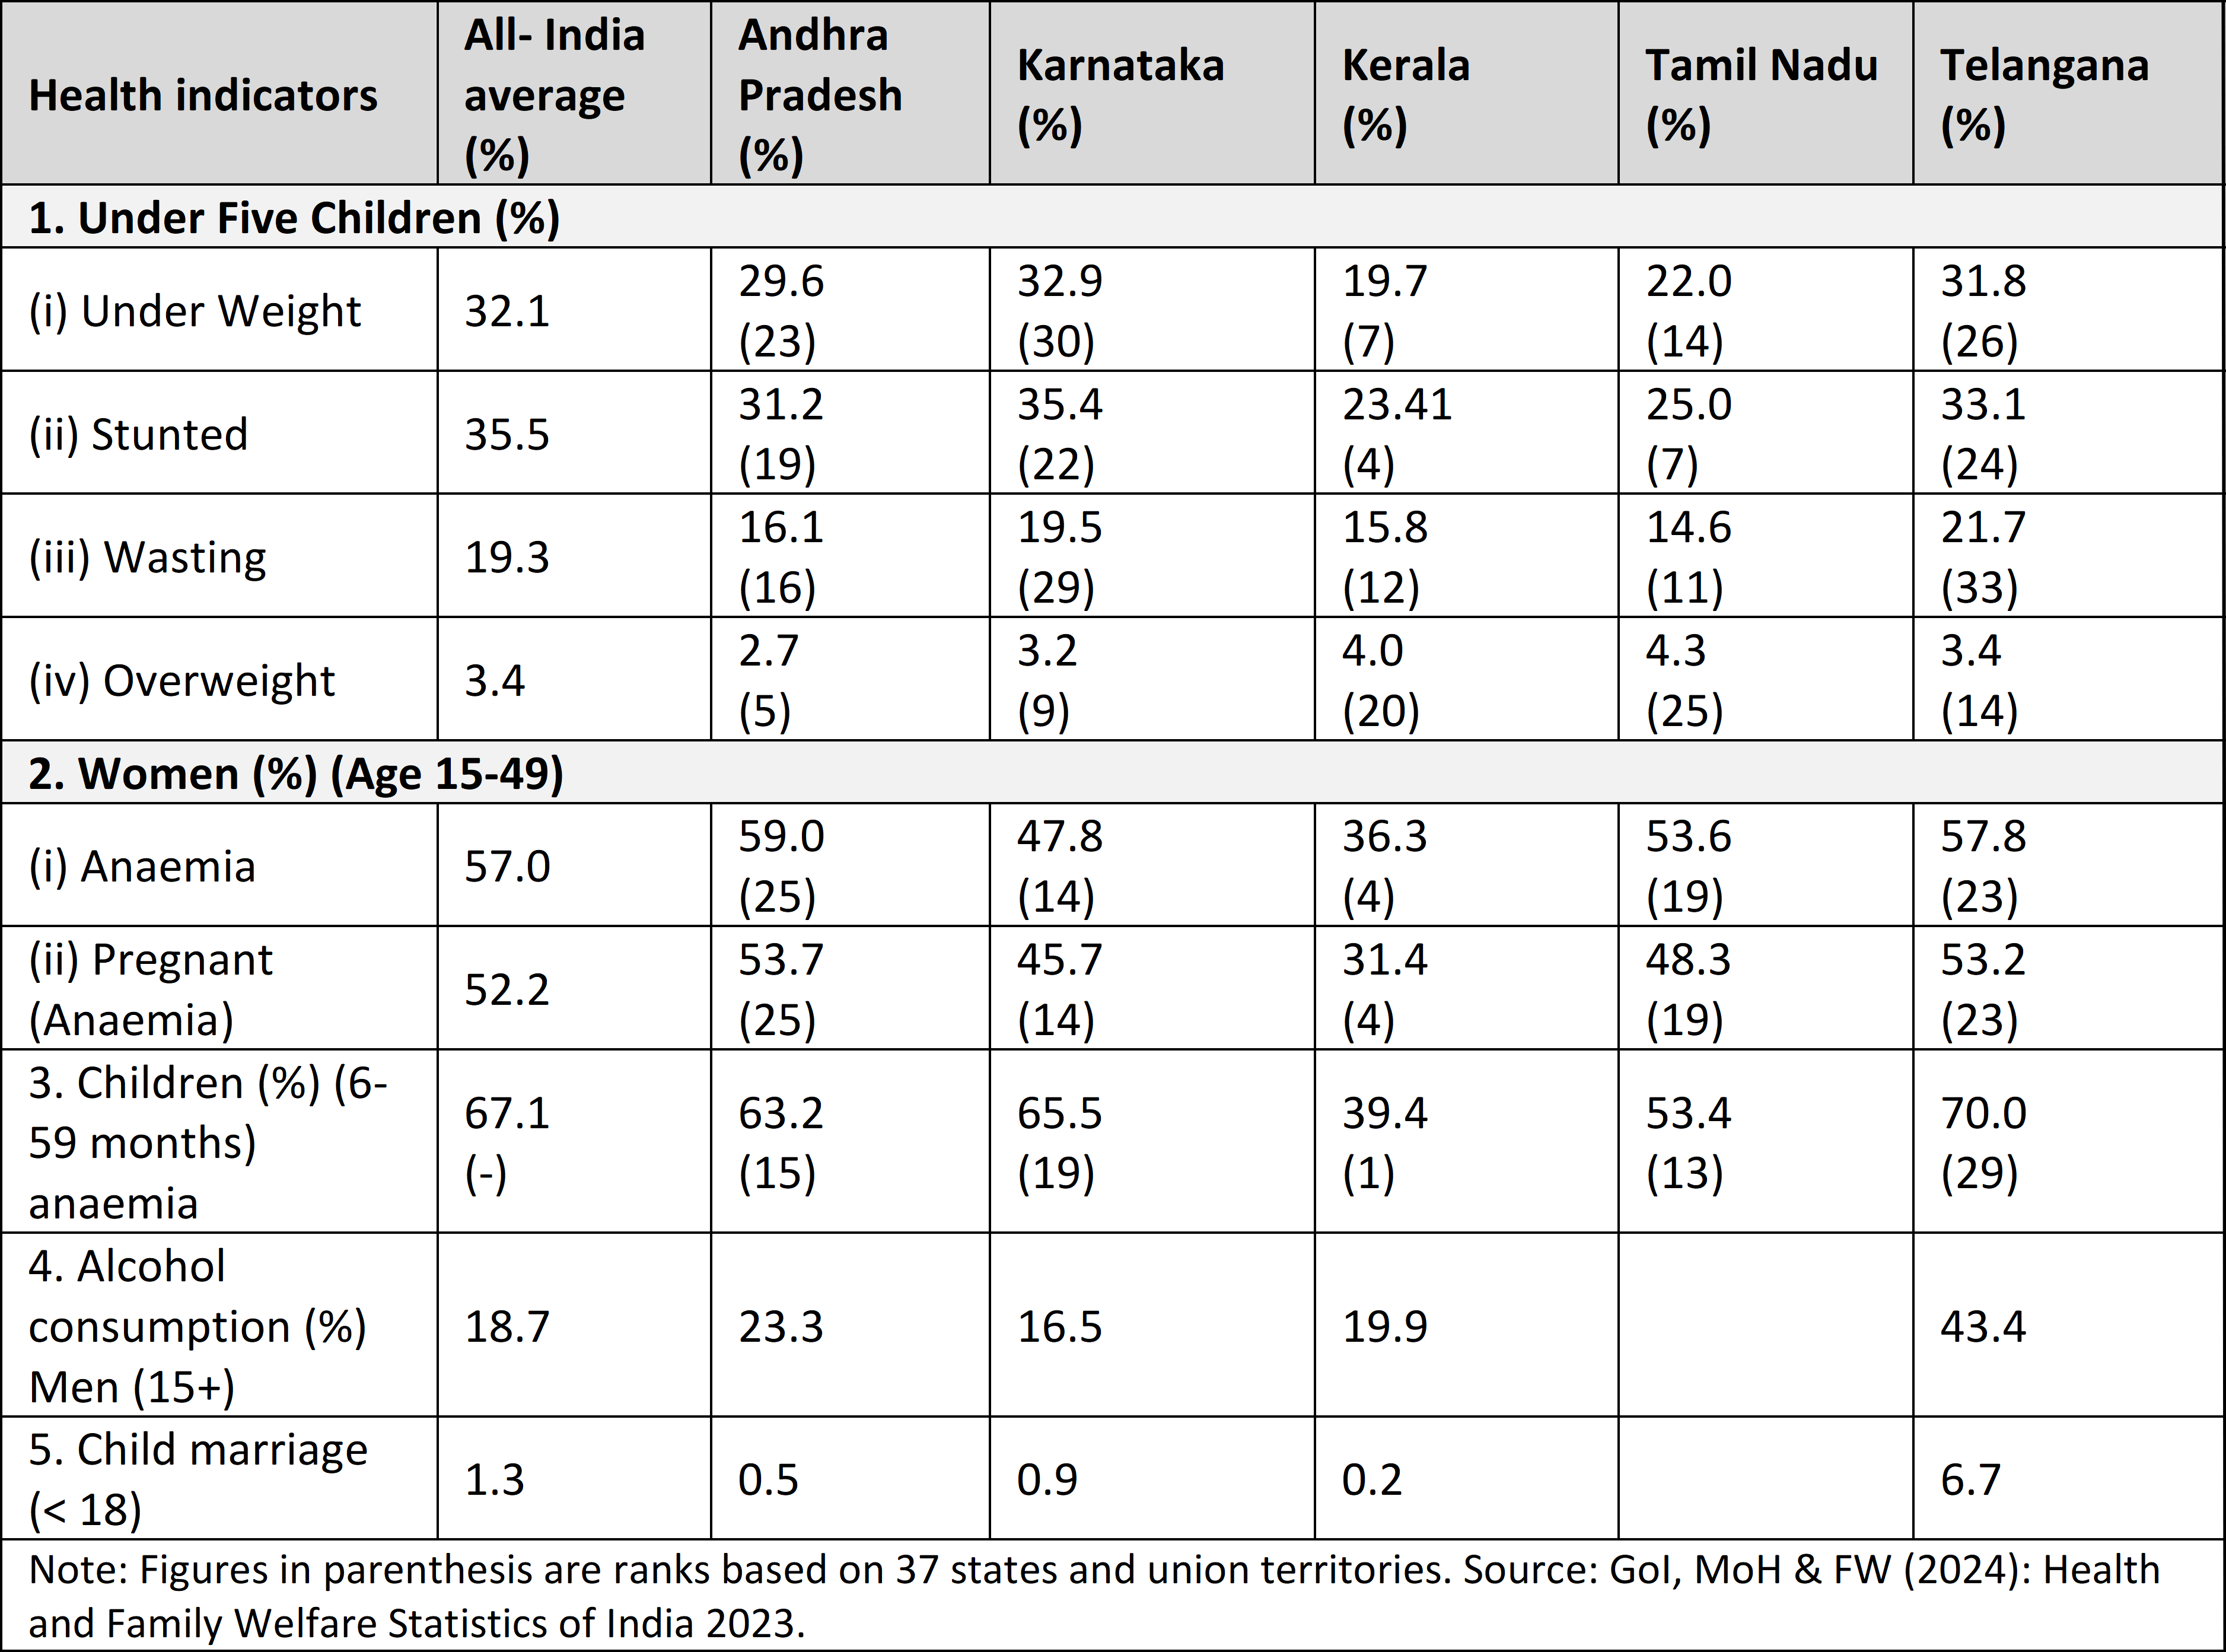
Table 10 presents the state of health in the southern states and India using a set of standard indicators. The indicators relating to children under five years are especially serious, since they affect not only current health but, more importantly, future capabilities. Underweight in this age group can lead to a higher risk of infections, delayed physical and cognitive development, and long-term health problems. Meanwhile, stunting (or linear growth failure) is associated with potentially irreversible physical and neurocognitive damage that severely constrains human development. Wasting weakens children’s immune systems and makes them more vulnerable to developmental delays and infections, and overweight has now emerged as an additional concern, particularly among urban children.
Other indicators of poor health with serious consequences include anaemia among adult women (aged 15–49), including pregnant women, and among infants aged 6–59 months. Anaemia in pregnancy can raise the risk of maternal mortality and low birth weight in newborns; on these dimensions, the southern states perform relatively better than many others.
In overall health outcomes, Kerala is the best-performing state, followed by Tamil Nadu. The state that performs poorly on most indicators is, once again, the “champion” of per capita income growth, Telangana, although Karnataka is emerging as a close competitor on several adverse indicators and, on underweight, even does worse than Telangana.
There is, of course, one area in which none of the southern states can match Telangana: alcohol consumption among men, which stands at about 42–50%, one of the highest levels in the country. These patterns are deeply disturbing, and they carry serious long-term risks not only for public health but also for the health of the state’s economy, which currently seems to draw comfort from impressive growth rates alone.
Table 10: Performance in Terms of the State of Health in Southern States
Inequality Situation
The United Nations has described inequality as the “strategic and existential challenge of the 21st century”. For more than two decades, it has pursued a global sustainable development agenda shaped by consensus among member states. The first phase ran from 2000 to 2015 under the Millennium Development Goals (MDGs), and the current phase, from 2015 to 2030, is guided by the 2030 Agenda, which monitors 17 Sustainable Development Goals (SDGs), including “Good Health and Well-being” (SDG 3), “Quality Education” (SDG 4), and “Reduced Inequalities” (SDG 10).
It is time to move away from an obsessive neoliberal policy path that treats indiscriminate privatisation as the engine of growth and equates “growth” with “development”.
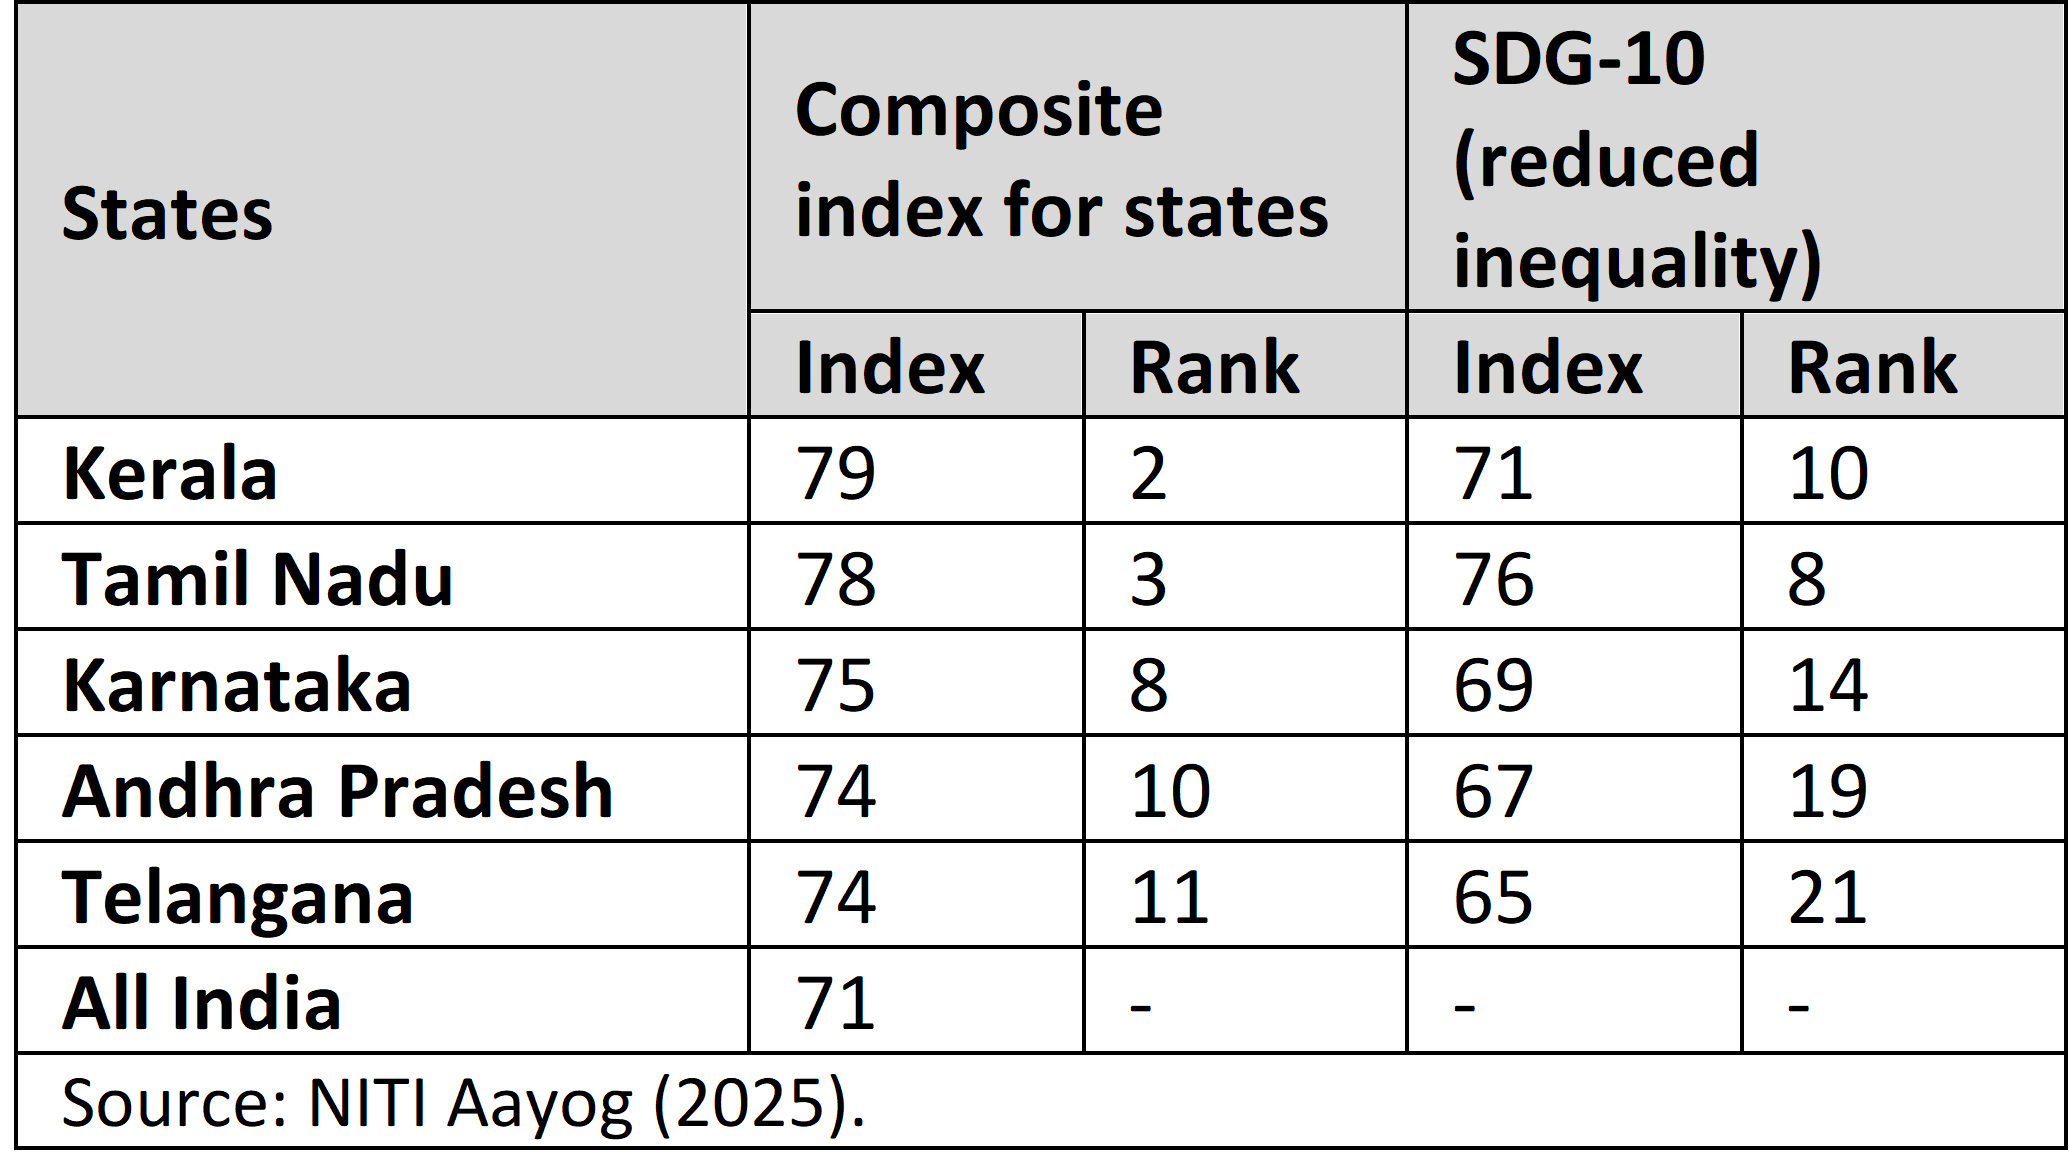
In India, progress on the SDGs is tracked using a set of indicators, and separate indices are calculated for each goal. SDG 10 covers four targets: reducing income inequalities (10.1); promoting universal social, economic, and political inclusion (10.2); ensuring equal opportunities and reducing discrimination (10.3); and adopting, in particular, fiscal, wage, and social protection measures (10.4). These are incorporated into the NITI Aayog’s monitoring of the SDG India Index, which covers 16 of the 17 goals.
Table 11 presents the position of the southern states and the all-India average on a composite index covering all 16 goals, and on the SDG 10 index. Here again, Kerala and Tamil Nadu compete for the top two positions: Kerala ranks first on the composite index (with a score of 79), while Tamil Nadu ranks first on the SDG 10 index (with a score of 71), leaving Telangana at the bottom on both counts.
Table 11: Sustainable Development Goals Index, 2023-24
At the state level in India, data on many indicators of inequality are not available. Even so, district domestic product data show that the Hyderabad Metropolitan Region, now spread over five districts, accounts for about 55% of Telangana’s total domestic product.
Extreme regional disparities are only one part of the story. Sectorally, the pattern is striking—some may find it curious, others shocking. Agriculture, which provides a livelihood to more than 60% of the population, contributes only about 14% of state domestic product; manufacturing, which is expected to drive non-farm employment, contributes about 9%; while “real estate, etc.” accounts for as much as 23.4%. In fact, according to the official Telangana Socio Economic Outlook 2024 the sub-sector “Real Estate, Ownership of Dwellings and Professional Services”, was the largest sub-sector of the Telangana economy in 2023-24 (Annexure 3, p 255).
The analysis above shows that high growth in per capita income can go hand in hand with severe social deprivation in the form of poor education, poor health, and widening inequalities. If this seems abstract, consider the findings of the Committee on Regional Inequalities in Karnataka, chaired by Govinda Rao.
According to it, Karnataka moved from having a per capita GSDP 19% below the national average in 1990–91 to becoming the second-ranked large state, with per capita income 80% higher than the national average in 2022–23. Yet, almost 50% of the value added in the state comes from the capital city and two coastal districts, Dakshina Kannada and Udupi. Karnataka ranks poorly on several social indicators: 22nd in underweight children, 21st in stunting, 20th in secondary-level dropouts, and 17th in higher secondary enrolment and literacy among people above 15 years (Rao 2025).
Growth is therefore necessary, but not a sufficient condition for improving people’s quality of life or well-being. It is time to move away from an obsessive neoliberal policy path that treats indiscriminate privatisation as the engine of growth and equates “growth” with “development”. Instead, public provision of quality education and good health needs to be recognised as a set of public goods, and policy must actively seek to rein in rising inequalities. Only then is there a real prospect of advancing towards the idea of a democratic and socially just Telangana.
(This is an edited and condensed version of the Prof. K. Jayashankar 13 th Endowment Lecture, delivered at Kakatiya University, Warangal on 6 August 2025)
D. Narasimha Reddy was Professor of Economics, University of Hyderabad.