
Circular Labour Migration
India’s migration patterns differ in an important way from those historically seen in North America, Western Europe, and more recently East Asia. In many of those settings, the move away from agricultural employment went hand in hand with large-scale, permanent rural to urban migration. Entire households relocated to cities in search of higher productivity work.
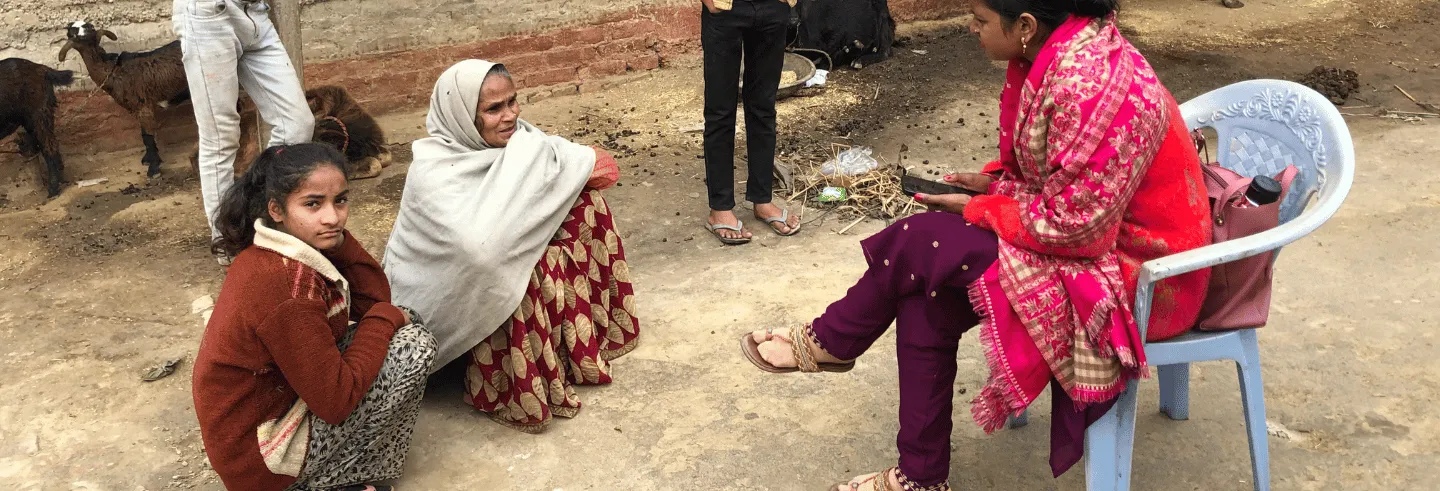
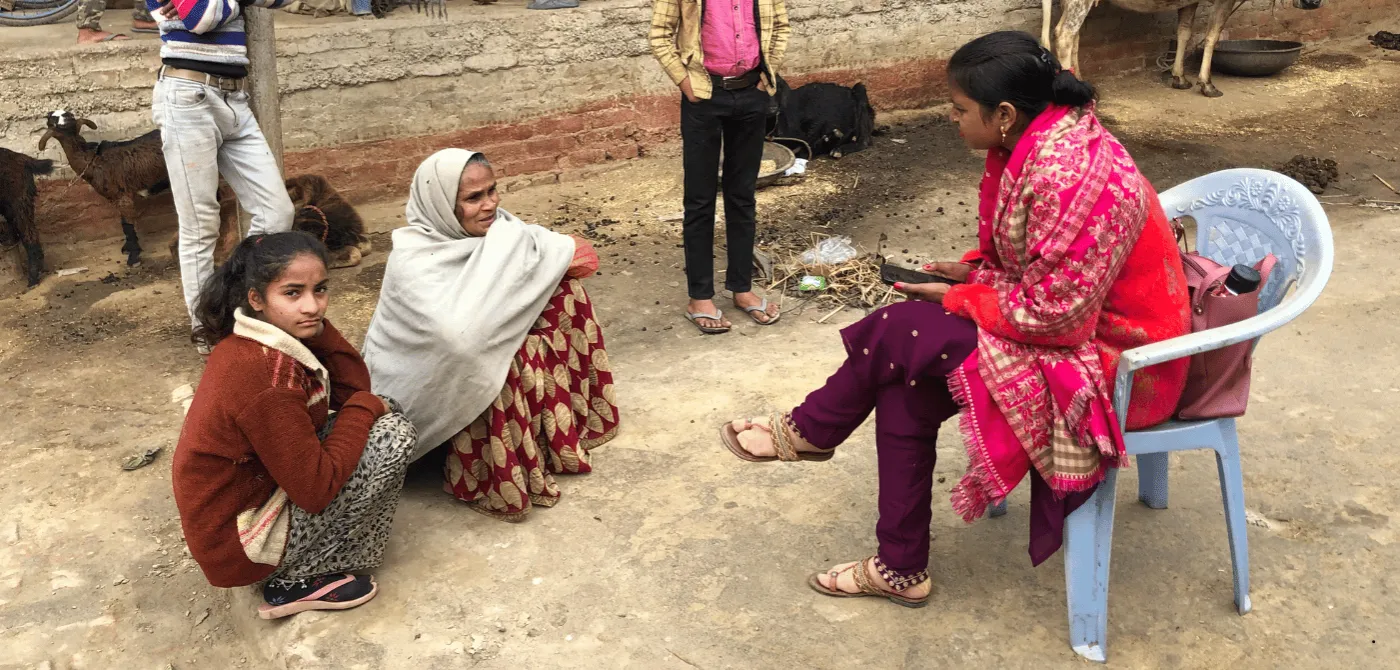
In India, by contrast, economic growth and the shift away from agriculture have not been accompanied by permanent household relocation on the same scale (Van Duijne and Nijman 2019). Instead, much migration takes a circular form—male household members move to towns and cities for months at a time, while the rest of the household remains in the village and receive remittances from them.
Circular labour migration has become an important livelihood pathway for households in predominantly rural areas (Choithani 2017; Datta 2016; Datta et al. 2014; Rogaly and Coppard 2003). Over the past two decades, available evidence suggests that such migration has accelerated to unprecedented levels, likely increasing the volume of domestic remittances sent back to home villages.
This growth can be attributed to two main factors. First, historically male members of rural households have engaged in seasonal migration during the agricultural lean season when local farm work was scarce, supplementing their agriculture-based incomes. Recent patterns, however, suggest that circular migration is becoming less seasonal and less tied to the agrarian calendar.
With longer work stints away from home and a growing number of circular labour migrants, it is reasonable to expect larger and more regular remittance inflows into migrant sending villages.
Many migrants now work for longer stretches away from home. As Choithani et al. (2021: 5) note, “Today, we expect most circular labour migrants to work entirely outside the agricultural sector.” Longer work stints that are unrestricted by the need to return home for cultivating the land means more months of paid work in the city and, in turn, larger and more regular remittances to the household that remains in the village.
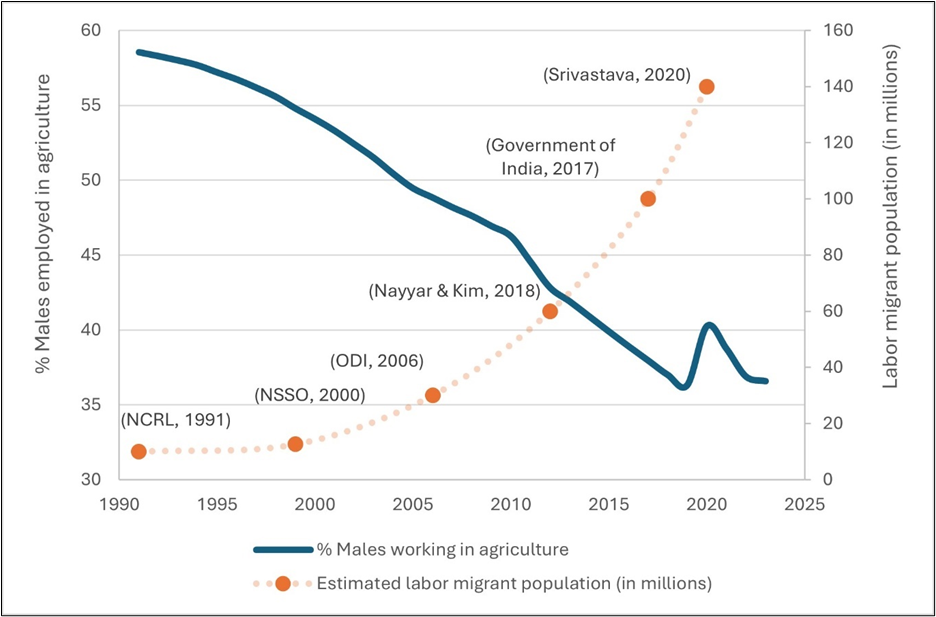
Second, the number of circular labour migrants has grown, more or less simultaneously with declines in agrarian employment (Figure 1). Comparable time-series data on circular migrants are scarce, and estimates vary across studies, but even so, from independent estimates we can piece together a narrative that shows a clear rise in their numbers.
Using nationally representative surveys and remittances data, Tumbe (2011) reports an increase in domestic labour migrants from approximately 10 million in 1999-2000 to approximately 23 million in 2007-2008. By 2011-2012, Nayyar and Kim (2018) placed the figure near 60 million. The Government of India’s Economic Survey of 2016-2017 put the figure at roughly 100 million circular labour migrants (Government of India 2017). 1To underscore the inconsistency in the reported number of circular labour migrants, note that Deshingkar and Akter (2009) argue the total was approximately100 million in the late 2000s. The most recent computed estimates come from Srivastava (2020), who suggests the number of circular labour migrants may be around 140 million.
Figure 1: Male Employment in Agriculture and Estimates of Circular Labour Migrants in India, 1991–2025
With longer work stints away from home and a growing number of circular labour migrants, it is reasonable to expect larger and more regular remittance inflows into migrant sending villages. Geographic research links these flows to a range of local socio‑economic changes, including higher living standards and shifting consumption patterns.
They are also associated with the expansion of private schooling and other fee‑based education and training services, growth in small retail and service businesses (such as medical stores and diagnostic facilities), and housing construction, upgrading, and expansion (Iyer 2017; Choithani et al. 2021; Van Duijne et al. 2023).
In this article, I aim to provide updated estimates of the aggregate volume of domestic remittances using a triangulated approach. I draw on multiple sources from different years—the National Sample Survey’s 64th Round (2007–2008), the India Human Development Survey-II (2011–2012), and my own primary household surveys conducted in 2023. This approach has clear limitations, but it allows me to offer an updated, evidence-based range for domestic remittance flows in 2024.
National Sample Survey’s 64th Round
The first dataset I use to estimate the magnitude of domestic remittances is the National Sample Survey’s 64th round (2007–2008) (NSS-64). This was the first NSS round to systematically collect nationally representative data on migration and remittances, and it remains one of the most comprehensive sources available. The survey covered 125,578 households (572,254 individuals) across 7,921 villages and 4,668 urban blocks, and recorded remittances sent to households over the 12 months preceding the survey.
Tumbe (2011) used the NSS‑64 data to estimate aggregate domestic remittance flows in India using two methods.
The first is a household-level method. It combines (i) the total number of households in India, (ii) the share of households receiving domestic remittances (about 8.1% in the NSS‑64), and (iii) the average annual amount received (Rs. 17,898).
These inputs imply roughly 18 million recipient households and a total remittance volume of about Rs 32,400 crore in 2007-2008 (around $8 billion at an exchange rate of roughly Rs. 40 per US dollar in 2011).
… [I]f a migrant is away for about seven months in a year, an annual remittance of Rs 37,214 corresponds to about Rs 5,316 per month away.
The second is an individual-level method. It multiplies the average annual remittance sent per migrant (Rs 14,600) by the estimated number of domestic migrants (about 23 million), yielding an estimated total of Rs 33,580 crore (approximately $8.4 billion).
Tumbe (2011) notes that self-reported remittance amounts may be under‑reported and therefore suggests an upward adjustment of roughly 30%, which would place domestic remittances in 2007-2008 at around $10–11 billion.
This figure provides a baseline for our updated estimate.
To approximate domestic remittance volumes in 2024, I start from the NSS‑64 per‑migrant remittance figure and update it to today’s prices. Adjusting the 2007–2008 average (Rs. 14,600 per migrant per year) for inflation through 2022 yields about Rs. 37,214 per migrant per year in current rupees.
If the number of circular labour migrants is in the range of 60–80 million (a conservative estimate; see Figure 1), total domestic remittances would fall in the range of roughly $28–37 billion (using an exchange rate of Rs. 80 per US dollar). Applying the same 30% upward adjustment proposed by Tumbe (2011) to account for under‑reporting gives an indicative 2024 range of about Rs 2.9–3.8 lakh crore or $36–48 billion.
It is important to note that the pace of inflation does not necessarily align with real wage increases among domestic labour migrants, which could affect the accuracy of these estimates. Still, the implied magnitude appears plausible—if a migrant is away for about seven months in a year, an annual remittance of Rs 37,214 corresponds to about Rs 5,316 per month away. This level is consistent with modest monthly transfers rather than implausibly large sums.
India Human Development Survey–II
The second dataset I use is the India Human Development Survey–II (IHDS‑II), conducted in 2011–2012. It surveyed 204,569 individuals living in 42,152 households, across 1,420 villages and 1,042 urban blocks (Desai and Vanneman 2015).
The IHDS‑II provides a second benchmark after the NSS‑64. However, the two surveys are not directly comparable because they differ in sampling strategy, sample size, and questionnaire design.
In the IHDS‑II, 5,487 households reported receiving domestic remittances—about 13% of the sample. This share is higher than the 8.1% recorded in the NSS‑64 (2007-2008), which is consistent with the possibility that domestic remittances reached a larger share of households by 2011-2012. 2Despite its insights, the IHDS‑II dataset presents challenges, particularly in accurately distinguishing between international and domestic remittances because of limited location‑specific information on labour migrants. The survey did ask whether migrants were “within the state”, “outside the state”, or “abroad”, but only 99 international migrants were recorded in this large sample. This very low count suggests possible under‑reporting or inconsistencies in how international migrants were recorded.
To reduce the influence of very large transfers, I use the median annual remittance received per household in the IHDS‑II, which is Rs 24,000. Dividing this amount by the average number of migrants per remittance receiving household (1.49) implies about Rs 16,107 per migrant per year in 2011-2012. This is somewhat higher than the Rs 14,600 per migrant reported in the NSS‑64.
Expressed in 2022–2023 rupees (after adjusting for inflation), this becomes about Rs 30,343 per migrant per year. Multiplying this figure by a 60–80 million range for circular labour migrants, and converting at Rs 80 per US dollar, yields an indicative 2024 range of roughly $23–30 billion. Applying Tumbe’s (2011) suggested 30% upward adjustment for possible under‑reporting increases this to around Rs 2.4–3.2 lakh crore, or approximately $30–39 billion.
Primary Survey Data
My third data source consists of primary household surveys collected for several research projects on circular labour migration and remittance practices. Across 2022–2023, I surveyed 2,031 households in rural areas of Uttar Pradesh, Bihar, and Jharkhand—regions long known for high levels of circular migration. These surveys were designed specifically to capture migration spells and remittance behaviour, and data quality was supported through random spot checks and back checks during fieldwork.
The key advantage of these data, relative to the NSS‑64 and the IHDS‑II, is that they are recent and detailed. The key limitation is that they are not nationally representative. Results should therefore be interpreted as indicative of migrant‑sending contexts rather than as national averages.
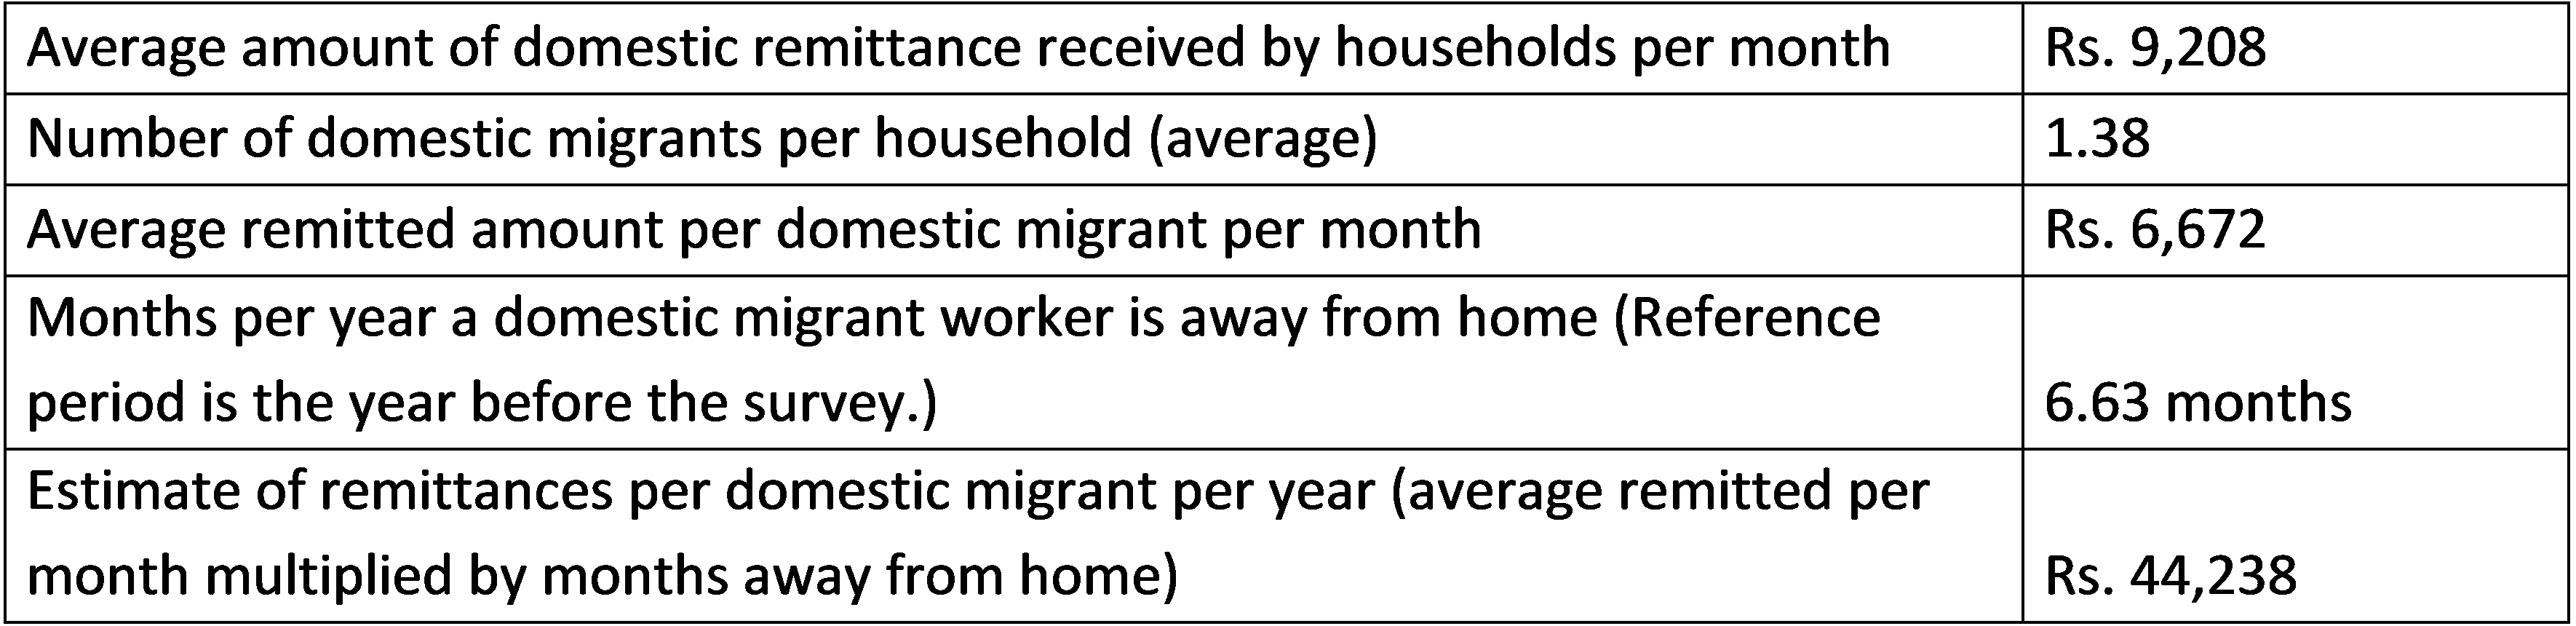
If remittances are sent primarily during those months away (at approximately the reported monthly rate), the implied annual remittance per migrant is about Rs 44,238.
Table 1 summarises the remittance patterns reported by households with migrant members. Among remittance receiving households, the average remittance received is Rs 9,208 per month. With an average of 1.38 migrants per household, this implies roughly Rs 6,672 per migrant per month.
Migrants report spending 6.63 months per year away from home. If remittances are sent primarily during those months away (at approximately the reported monthly rate), the implied annual remittance per migrant is about Rs 44,238. These values suggest that domestic remittances may have broadly kept pace with inflation, though further research and systematic data collection are necessary to confirm this trend.
To illustrate what these magnitudes would imply at the national level, I apply the same per migrant annual figure to a 60–80 million range of circular labour migrants. Using Rs. 80 per US dollar, this produces an indicative range of about $33–44 billion in domestic remittances in 2024. Applying the same 30% upward adjustment used above to account for possible under‑reporting yields roughly $43–57 billion (about Rs. 3.4–4.6 lakh crore).
This extrapolation should be read as illustrative, given the non‑representative nature of the primary survey sample.
Table 1: Domestic Remittances Data from Primary Household Surveys in Uttar Pradesh, Bihar, and Jharkhand, 2022-2023
Summing Up
Domestic remittances are increasingly vital to rural livelihoods. As agriculture-based employment declines, more households rely on circular labour migration to sustain and diversify income. This shift has been associated with visible socio-economic changes in regions once considered predominantly agrarian, including changes in consumption, services, and housing.
These changes are often enabled by remittance inflows (Iyer 2017; Choithani et al. 2022; Van Duijne 2024). Yet, despite their growing importance, we still lack a reliable and regularly updated national measure of the aggregate volume of domestic remittances.
This article has sought to narrow that gap. Drawing on three data sources, I arrive at an indicative 2024 range that runs from a lower estimate of $30–39 billion (based on the IHDS‑II), to a higher estimate of $43–57 billion (based on primary surveys), with a middle estimate of $36–48 billion derived from inflation updated figures from the NSS‑64.
These estimates rest on several assumptions that should be stated plainly.
India needs a routine, standardised system for tracking domestic remittances…
Updating older survey‑based remittance amounts to 2024 requires an inflation adjustment, but inflation does not necessarily translate into equivalent wage growth for circular labour migrants. Similarly, scaling per migrant remittance figures to a national total depends heavily on the assumed size of the circular migrant workforce (here, 60–80 million), which remains contested and is difficult to measure consistently across surveys.
With these caveats, the broader direction of the magnitude of domestic remittances is difficult to ignore. Even if the share of households receiving remittances had remained stable, India’s population growth alone implies more sending and receiving households over time.
The period 2008–2024 also saw the rise of digital payment systems—expanded banking outreach, mobile wallets, the Unified Payments Interface (UPI), and so on—that made sending money home easier. This may have increased the frequency and regularity of domestic remittances.
The central takeaway is not a single headline number, but the recognition of a major measurement gap. India needs a routine, standardised system for tracking domestic remittances, commensurate with their importance for rural livelihoods and for the political economy of internal migration.