

Martin Wolf, chief economics commentator at the Financial Times, writes in his new book The Crisis of Democratic Capitalism, “GDP growth itself tells little about changes in the welfare of the population. How the benefits of that growth are distributed also matters a great deal.”
This is a very important point that tends to get ignored every time anyone offers the GDP growth figure as overall evidence of an economy doing well. GDP, the gross domestic product, is a measure of the size of the economy of a country. By this, it follows that GDP growth is a measure of economic growth. Hence, GDP is an aggregate measure and like any other aggregate measure, it hides more than it reveals.
The Reserve Bank of India has projected a real GDP growth of 7% for 2022–23 and 6.5% for 2023-24. This makes India one of the fastest growing economies in the world. Nonetheless, the question is, how equitable is this growth? Is it spread across or is it concentrated on a small section of society?
To be able to answer these questions, we need to go back to first principles. The GDP of a country can be calculated in multiple ways. One way is to add private consumption expenditure (C), investment (I), government expenditure (G), and net exports (exports minus imports, NX). Or as economists like to put it, Y = C + I + G + NX, where Y is the GDP.
To see whether the economic growth is spread across different sections of the society we need to check different economic indicators that represent different constituents of the GDP and analyse what they tell us. Let us start with private consumption expenditure, or the money you and I spend buying stuff.
Private consumption
In 2022-23, the sale of domestic two-wheelers (motorcycles, scooters, and mopeds) was 15.86 million units, which was 17% higher than in 2021–22. At the same time, the sale in 2022–23 was the same as in 2014–15 – 15.98 million units. The 2022–23 sale was considerably lower than the 21.18 million units sold in 2018–19.
Why is this data point important? For many households, two-wheelers are perhaps their second most expensive thing (after the house) or the third most expensive thing (after a house and car) that they are likely to buy during their lifetime. It is probably the first step that a household takes to be classified under the all-encompassing category called 'middle class'.
What this tells is that the financial capacity of many individuals and households at the lower end of the income spectrum is stretched. This is not just because of the Covid-19 pandemic. The sale of domestic two-wheelers peaked in 2018–19, which was before the pandemic started.
It is worth mentioning that while the sale of two-wheelers on the whole fell by a fourth between 2018–19 and 2022–23, the sale of entry level domestic two-wheelers fell at a much faster pace. A report in Economic Times points out that the sale of entry level scooters (75cc-125cc) fell by around 28% between 2018–19 and 2022–23. The sale of entry level motorcycles (75cc-110cc) fell by around 38% during the same period. What this suggests is that the lower you go down the income ladder, the tighter the financial situation.
The financial capacity of many individuals and households at the lower end of the income spectrum is stretched. This is not just because of the Covid-19 pandemic.
Let us consider domestic car sales. In 2022–23, domestic car sales peaked at 3.89 million units. Nonetheless, as a CNBC TV 18 news report points out: “According to Society of Indian Automobile Manufacturers (SIAM), the sales of small entry-level cars fell 57% to 252,000 units […] from its 2016–17 peak of 5,83,000 units.” On the other hand, the “sales of SUVs […] made up more than 50% of total passenger vehicle sales.” Clearly, high-end SUVs are selling at a fast pace and some even have long waiting periods, whereas entry level cars are not.
Now let us consider sales of smartphones, another important indicator of consumption. Data from the International Data Corporation suggest that 144 million smartphones were shipped in India in 2022, which was 10% lower than in 2021. On the whole, 201 million mobile phones were shipped in 2022, which was 12% lower than in 2021. This, when the high-end Apple iPhone has been doing well in India and the share of the premium smart phone segment has been increasing. Now, compare this to the fact that rural teledensity has been more or less flat over the last five years.
Moving on to air travel. On 1 May 2023, the Ministry of Civil Aviation tweeted that an all-time high of 456,082 passengers travelled domestically on 30 April. This was offered by many as evidence of the Indian economy doing well. Here, it is worth remembering what the Indus Valley Report points out: 1% of Indians account for 45% of flights taken. Also, 456,082 individuals taking a flight in a population of more than 1.40 billion does not amount to much.
In 2022-23, about 137 million passengers flew domestically. This was significantly better than the 54 million passengers and 85 million passengers flying in 2020–21 and 2021–22, respectively. Nonetheless, the number remained slightly lower than the 141 million passengers who flew in 2018–19 and the 142 million passengers who flew in 2019–20. It is safe to say that air traffic has just about gone back to the pre-Covid-19 level.
Let us compare this with the number of individuals who travelled on trains of the Indian Railways. Nearly 6.44 billion passengers did so in 2022–23. This was more than in 2021–22 and 2020–21. But it was more than a fifth lower than in 2019–20 and close to 24% lower than in 2018–19.
When we look at non-suburban passengers, a little over 2.6 billion passengers travelled in 2022–23 on Indian Railways. This was more than a fourth lower than in 2019–20 and 29% lower than in 2018–19. What this tells us is that many individuals are financially stretched and thus unable to afford long-distance travel as well as suburban travel.
Let us take a look at fast moving consumer goods (FMCG) companies, which are in the business of selling everything from toothpastes to detergents to soaps to a lot of other stuff that people buy for everyday use.
The volume growth of FMCG companies or an increase in the sales of number of units of different products sold by these companies has not been looking good for a while. As Ritesh Tewari, chief financial officer of Hindustan Unilever, an FMCG behemoth, said in a 27 April earnings call of the company, “We need to be mindful that FMCG market volumes have been declining for almost a year and a half. Rural market volume is still declining.”
That the number of households demanding work under the [MGNREGA] scheme is still greater than in the pre-pandemic years tells us that the overall financial state of the rural poor is not really great.
What this means is that, on the whole, rural India has been cutting down on the consumption of products of everyday use. This has happened primarily because of the high inflation that has prevailed over the last three years. Inflation has recently begun to fall but that only means that the rate of increase in price growth is falling. The high prices that have been reached because of high inflation will stay.
Another good indicator of the state of the rural economy is the work demanded by households under the Mahatma Gandhi National Rural Employment Guarantee Scheme (MGNREGS), the work guarantee scheme. In 2022–23, the work demanded by households under the MGNREGS was lower than the work demanded during the Covid-19 years of 2020–21 and 2021–22. Nonetheless, the work demanded continues to be significantly more than the pre-Covid-19 years.
The scheme is a self-selecting scheme given the low daily wages that it offers. It is only when people are very desperate for work that they demand work under this scheme. That the number of households demanding work under the scheme is still greater than in the pre-pandemic years tells us that the overall financial state of the rural poor is not really great.
Compare this with domestic tractor sales, which in 2022–23 stood at an all-time high of 0.95 million units. This shows that the rural rich are doing better than they were doing in the past.
Indeed, private consumption expenditure is the biggest part of the economy. In recent years, it has been around three-fifths of the overall size of the economy. In 2022–23, it was 60.55% (in nominal terms, that is not adjusted for inflation) of the overall economy. These data points show us very clearly that there are large sections of the population that do not have the same consumption power as they had before the pandemic. Meanwhile, the well-to-do are doing much better than they were in the past.
Investment
Let us take a look at investment in the economy. Chart 1 plots the investment to GDP ratio (in nominal terms).
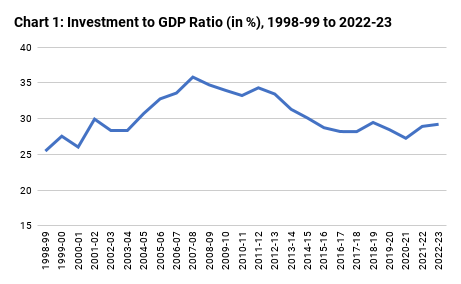
The investment to GDP ratio has been largely falling for many years now. It peaked at 35.81% in 2007–08, which was 15 years ago. In 2022–23, it is estimated to have been 29.21%, an improvement over the three years before that, but worse than where it was before the pandemic broke out. Less of an investment in the economy implies the creation of fewer jobs, which has an impact on the incomes that people earn, and which, in turn, affects private consumption and further job creation.
Now take a look at Chart 2. It plots the private sector investment to GDP ratio and the household sector investment to GDP ratio.
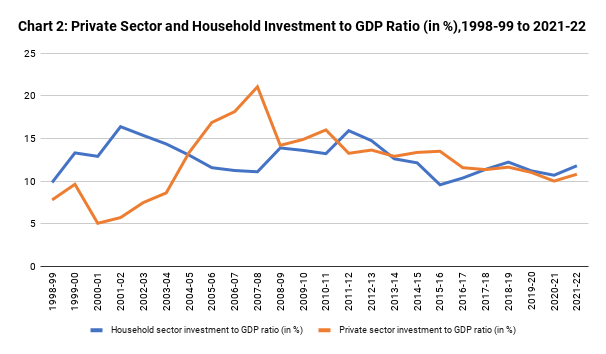
The household sector investment in the economy was at 15.9% in 2011–12 and has followed a largely downward trend since. It was at 11.8% in 2021–22. This fall has been happening from before the Covid-19 pandemic. What does it imply? The household sector investment to GDP ratio is a good proxy for small informal businesses operating in the economy. A falling ratio indicates that informal businesses have not been doing well. Many have even shut down, thus destroying jobs.
Along with the household sector investment in the economy, the private sector investment in the economy has also been shrinking over the years. It peaked at 21% in 2007–08 and stood at 10.8% in 2021–22. Clearly, while private sector CEOs might be very bullish on India when it comes to making public statements, their revealed preference tells us something different. They are not putting their money where their mouth is.
Clearly, while private sector CEOs might be very bullish on India when it comes to making public statements, their revealed preference tells us something different. They are not putting their money where their mouth is.
The data in this case is only available up to 2021–22. Also, the GDP at the end of the day is a theoretical construct. So, let us look at other economic indicators to judge the state of investment in the economy. Take, for instance, bank loans given to industry. The lending by scheduled commercial banks to industry peaked at 22.43% of GDP in 2012–13. A lot of this lending was indiscriminate in nature and turned into bad loans, which were not repaid. Not surprisingly, a decade later in 2022–23, bank loans to industry as a proportion of GDP stood at a much lower 12.27% of the GDP.
Lending to industry is divided into three parts: large industry, medium industry, and micro and small industry. While large industries have other sources of borrowing, that is not the case with the others. The data points clearly suggest that medium, micro, and small industry are not in a great shape.
Lending to medium, micro and small industry peaked at 5.32% of GDP in 2009–10. From there, it fell to a low of 2.47% of GDP in 2019–20. It has since jumped to 3.14% of GDP in 2022–23. It was at 3.18% in 2021–22. It is these businesses that create jobs when they grow. And that has not been happening in India, though the bank lending to medium, micro and small industry has improved marginally since hitting a low in 2019-20.
All the projects that are announced are not necessarily started and completed. In 2022-23, 2,817 projects worth Rs 15.1 lakh crore were dropped. In 2021-22, 2,624 projects worth Rs 13.59 lakh crore were dropped.
What holds some hope is that starting from 2015 onwards, public sector banks, with a lot of help from the government and some adept management by the Reserve Bank of India (RBI), have managed to clean up their balance sheets. This implies they are in a good condition to lend money now.
Take a look at Chart 3, which plots the total value of new investment projects announced each year along with the number of new investment projects announced, for more than last two decades.
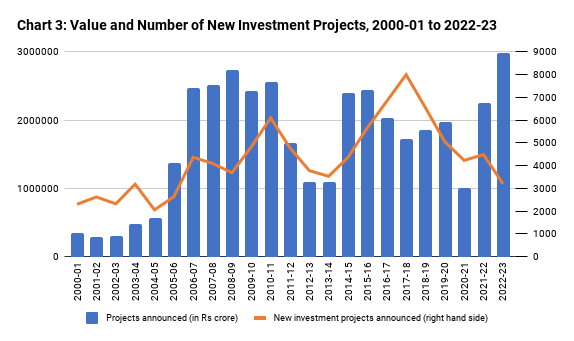
The data tell us that the total value of projects announced in 2022–23 stood at Rs 29.87 lakh crore, the highest ever. Nonetheless, it was very similar to the projects worth Rs 27.32 lakh crore announced in 2008–09. Further, this data has not been adjusted for inflation or that the Indian economy in 2022–23 is much bigger than it was in 2008–09.
It is also worth mentioning here that all the projects that are announced are not necessarily started and completed. In 2022–23, 2,817 projects worth Rs 15.1 lakh crore were dropped. In 2021–22, 2,624 projects worth Rs 13.59 lakh crore were dropped.
There is another point that needs to be made here. The number of new projects being announced has come down over the years (as can be seen in Chart 3). This leads to the conclusion that larger projects are being announced. As economist and former deputy chairman of the Planning Commission Montek Singh Ahluwalia put it in a September 2022 column in the Mint, “Some large houses have announced some large investments. This is good, but announcements by a few large houses will not correct the underlying problem of a much broader slowdown in private sector investment.”
Further, as can be seen from Chart 4, net foreign direct investment (FDI) in India has also been stagnating for a while now.
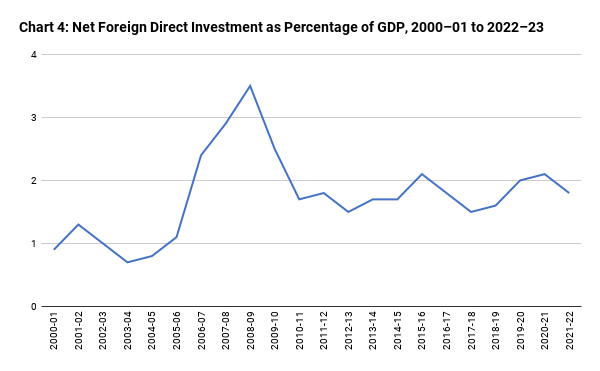
Note: Gross foreign direct investment into India minus repatriations, expressed as a proportion of the GDP. This does not adjust for foreign direct investment from India into other countries.
Net FDI in India peaked at 3.5% of GDP in 2008–09, in the financial year during which a global financial crisis broke out. It stood at 1.8% in 2021–22. It has stagnated between 1.5% to 2.1% of GDP since 2010–11. At the time of writing, the full data for 2022–23 was not available. But data for April 2022 to February 2023 shows that the net FDI to India during the period stood at $40.34 billion. During the same period in 2021–22, the net FDI in India had stood at $51.09 billion. The point is that the net FDI in India in 2022–23 in absolute terms, as well as once adjusted for the GDP, is likely to be lower than that in 2021–22.
Clearly, CEOs of foreign companies come to India and give big speeches about the country’s great potential, but, like their Indian counterparts, they are all talk.
Let us take a look at a few more economic indicators to gauge the state of investment in the economy. The sale of domestic commercial vehicles in 2022–23 stood at 0.96 million units, recovering from a sale of 0.57 million units in 2020–21. Also, the 2022–23 performance was almost similar to the sale of 1 million units in 2018–19.
These sales indicate activity on the infrastructure and industrial front is picking up. Commercial vehicles are used to move around finished as well as semi-finished goods. Further, in 2022–23, the consumption of finished steel reached an all-time high of 119.86 million tonnes, again suggesting some improvement in investment in the economy.
All in all, there seems to a marginal turnaround when it comes to investment in the economy. Nonetheless, the question is how much of this is sustainable without an improvement in (overall equitable) private consumption. Firms make stuff that people buy and unless that grows there is no point in them investing and expanding.
Jobs
The lackadaisical performance on the investment front is one reason why enough jobs have not been created over the years. Data from the Centre for Monitoring Indian Economy shows that the labour force participation rate has been falling over the years. It was at 46.22% in 2016–17. It fell to 39.48% in 2022–23, with a good portion of the fall coming before the Covid-19 pandemic stuck.
The labour force participation rate is defined as the ratio of the labour force to the population greater than 15 years of age. The labour force comprises individuals 15 years or older who are employed or are unemployed and willing to work and actively looking for a job. A simple explanation for this fall is that many individuals who are unable to find a job have simply stopped looking for one. Also, it is worth remembering that the population in 2022–23 is more than the population in 2016–17. This means that the absolute number of people dropping out of the labour force has increased considerably.
Data from the World Bank (modelled International Labour Organization estimate) suggests that the India’s labour force participation rate has been largely on its way down over the last two decades. It was 57% in 2000, fell to a low of 48% in 2018 and 2020, and was 49% in 2022. This is a low figure and can be gauged from the fact that the global labour force participation rate, which has also been falling, was 60% in 2022. Vietnam, Bangladesh, and China had rates of 73%, 59% and 67%, respectively, in 2022.
If we look at the government’s Periodic Labour Force Survey, the latest annual data is available for the period July 2021 to June 2022. The labour force participation rate during the period stood at 55.2%, having improved from 50.2% for the period July 2018 to June 2019. Much of this improvement came from fact that the proportion of the workforce in agriculture has gone up from 42.5% in 2018–19 to 45.5% in 2021–22. Historically, as a country makes economic progress, it moves its workforce away from agriculture into more productive jobs. In India’s case, largely because of the Covid-19 pandemic and increasing formalisation of the economy, the opposite seems to be happening.
Further, there is huge disguised unemployment in agriculture. On the face of it, people seem employed. Nevertheless, agricultural production will not suffer even if some of these employed people stop working.
Government
Let’s now take a look at the government part of the GDP. Chart 5 plots the gross tax revenue earned by the central government (before it is shared with the states) as a percentage of GDP.
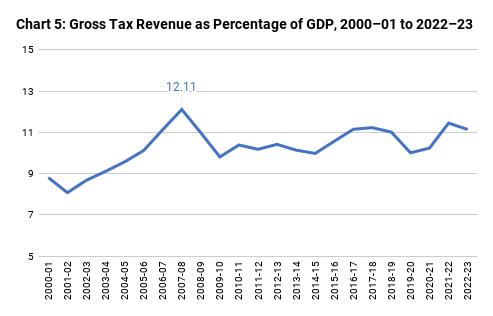
While the gross tax revenue as a proportion of GDP peaked in 2007–08 at 12.11%, in the last couple of years there has been some improvement. The gross tax revenue in 2022–23 is expected to be at 11.14% of the GDP. In 2021–22, it had stood at 11.45%, after having fallen to 10.01% in 2019–20.
Tax collections have gone up majorly due to three reasons. First, there is better implementation of goods and services tax (GST) through increasing compliance. So, the economic activity on which a GST was not being paid earlier is being paid now. Of course, it remains to be seen how much more GST the government can squeeze out of better compliance.
Second, the upper echelons of society have done well in the past few years and that has led to personal income tax collections increasing. They were at 2.38% of the GDP in 2020–21 and are expected to jump to 2.89% in 2022–23. This is also reflected in that the number of income tax return filers who declare an income of more than Rs 10 lakh has gone up substantially in recent years. Third, inflation has helped drive up taxes collected under the GST.
This has helped the government increase the money it spends under direct benefit transfer schemes. This spending had stood at Rs 3.82 lakh crore or 1.9% of the GDP in 2019–20. It has since jumped to Rs 6.67 lakh crore or 2.45% of the GDP in 2022–23. This increase again indicates that the financial situation of many Indians is not good.
Exports
The overall export of goods and services in 2022–23 is expected to be Rs 61.07 lakh crore or 22.45% of the GDP. The total goods and services exports peaked at 25.43% of the GDP in 2013–14 and started to fall after that, reaching a low of 18.66% in 2019–20 and 18.71% in 2020–2021, respectively. They have jumped since then.
Goods exports went up by just 6% in 2022–23. It has been widely argued that the China+1 strategy of large multinational companies should help drive up goods exports. On the other hand, services exports went up by around 27%. It is widely believed that services exports will emerge even stronger in the days to come. One line of business driving services exports is the data analytics sector through the operation of Global Capability Centres (GCCs) in India.
As Raghuram Rajan and Rohit Lamba recently wrote in the Times of India, “These are offices set up by large multinational firms that provide IT, research, and analytical support to the parent companies. India currently hosts 40% of the world’s GCCs [Global Capability Centres] and this number is expected to rise.”
So, the rise of the GCCs, like the rise of the IT sector before it, will create jobs only for skilled workers. Nonetheless, there is bound to be a huge multiplier effect on other support jobs, like it was in the case of the IT sector as well. The thing to observe here will be if this sector goes beyond the IT cities of Bengaluru, Chennai, Hyderabad, and Pune. If it does, it will help towards building a more equitable growth.
Conclusions
To conclude, there are a few major issues that stand out. First, a large section of the population is still struggling financially. Adequate data bear that out. The government is trying to help. But there is only so much it can do. There are really no solutions here. Everything that needs to be sorted cannot always be sorted. It is something that hopefully time will heal.
Second, there has been a marginal turnaround when it comes to investment in the economy, but the question is if this can be sustained without a more equitable growth in consumption. Take the case of the two-wheeler sector, an important part of the manufacturing sector. Sales peaked in 2018–19. Clearly, there is more than excess capacity in the sector. So, why should firms invest and expand?
Third, more people have gone back to agriculture over the last few years and that is not a good trend. As the economist Himanshu wrote in a March 2023 column in the Mint, “The absolute number of workers in agriculture declined by 33 million between 2004–05 and 2011–12. Almost a matching decline was observed between 2011–12 and 2017–18.”
Nonetheless, “the slowdown and pandemic reversed this process”, and “the agricultural sector witnessed a return of 36 million workers between 2017–18 and 2021–22”. This has led to a scenario where “the absolute count of workers in agriculture stood higher in 2021–22 than in 2011–12.”
There are not enough jobs for India’s youth. That is clear in the low labour force participation rate, whether we believe in the government’s data or the World Bank data or the Centre for Monitoring Indian Economy data.
This is perhaps an impact of the gradual destruction of the informal sector, which has always been a major job creator. A solution to this could be affordable real estate, where homes in cities are available at a price of less than Rs 25 lakh. The building of these homes will require labour, which will help people move away from farming. But for that to happen, many other structural reforms need to be worked on.
Fourth, micro, small and medium enterprises, which are usually major job creators, have been struggling for a while now. There are just too many rules, regulations, and laws that they need to follow, making many such businesses unviable.
Fifth, there are not enough jobs for India’s youth. That is clear in the low labour force participation rate, whether we believe in the government’s data or the World Bank data or the Centre for Monitoring Indian Economy data. The figures may vary but the overall story is similar.
Sixth, the RBI’s economic growth forecast for 2023–24 is at 6.5%. RBI governor Shaktikanta Das even reiterated that he was confident that India would grow by 6.5% during 2023–24. This despite the World Bank cutting India’s growth forecast to 6.3% from 6.6% earlier, and the International Monetary Fund cutting India’s growth forecast to 5.9% from 6.1% earlier.
.Talking heads [...] appear in the media and paint just one side of the picture simply because they are incentivised to do so.
Economic growth might come in at 5.9% or 6.3% or 6.5%, but that will not change the larger point that a considerable part of the Indian economy continues to struggle. This leads us to the question: Where is such gung-ho optimism about the Indian economy coming from when substantial parts of it continue to struggle?
The answer might perhaps lie in the fact that there are largely three kinds of economists going around. One kind work for large corporates and stock brokerages. The second kind work for think tanks. Then there are those who are associated with the government, both directly as well as indirectly. These are the talking heads who appear in the media and paint just one side of the picture simply because they are incentivised to do so. The trouble is that the data do not bear them out and most of this data, unlike the GDP calculation, is not a theoretical construct. That is the long and the short of it.
Vivek Kaul is a Mumbai-based writer who explains economics, investments, and finance in a simple, lucid, and jargon-free way.