


1. Introduction
Popular discussions on inequality in India receive periodic attention with the annual publication of reports by the World Inequalities Database (WID), Oxfam, as well as the global rich lists published by Forbes and Hurun. These tend to focus on income and wealth, while discussions about consumption levels (or to be more precise, consumer expenditure) are less frequent mainly because of paucity of data.
The National Statistical Organization (NSO), earlier called the National Sample Survey Organization (NSSO) used to publish countrywide consumer expenditure surveys every five years from 1972-73 onward, but since 2011-12 it has not published a survey. 1The NSSO merged with the Central Statistical Office (CSO) to form the NSO in 2019. The results of the 2017-18 survey were withheld due to concerns about “data quality” 2The NSO has now announced that the next consumption expenditure survey will be conducted in 2022-23. . Since 2014, the Consumer Pyramid Household Survey (CPHS) carried out by the Centre for Monitoring Indian Economy (CMIE) has been filling this gap to some degree, but several researchers have raised questions about how representative the sample frame is, especially in covering the extremely poor.
Different data sources, which are usually collected in different ways and measure different aspects of economic activities, can often lead economists to draw different conclusions on how economic inequality has evolved. This also makes the discussion regarding changes in Indian inequality over the past decade to be always generating some controversy.
For example, data from the recently published “World Inequality Report 2022” suggests that inequality – of both income and wealth – in India kept increasing in the last few decades and that this trend has continued even in recent years. In particular, after 1990, the share of the national income of the top 10% and top 1% has consistently increased while the share of the national income of the bottom 50% has consistently declined. (See Ghatak (2021) for a review of this evidence based on the data provided by the World Inequality Database (WID).)
Similarly, since 1971, the share of the wealth in the economy of the top 10% and top 1% has consistently increased while the share of the national income of the bottom 50% has consistently declined. However, analysis of more recent data from micro-level surveys including National Sample Survey (NSS), All-India Debt and Investment Survey (AIDIS), and the Consumer Pyramids Household Survey (CPHS by CMIE), as we shall show in this report article, provide a contrasting picture of the last decade. Based on these data sources, economic inequality in India appears to have gone down in more recent years, with lower (and even negative) growth rates of consumption and wealth for richer households and higher growth rates for the poor.
In this article, we carry out a comprehensive analysis of growth and inequality of income, wealth, and consumption in India. We try to synthesize the various data sources and measurement methodologies, as well as provide an explanation for the contradictory findings on the trends in inequality in recent years in India.
In particular, in recent years, the World Inequality Report (WIR) uses estimates of income and wealth inequality that are projections from 2014 – due to lack of availability of fresh survey results, their primary data source. This provides a partial answer to why estimates of income and wealth inequality provided by WIR and other primary sources from more recent years, diverge. Another explanation is provided by Anand and Kumar (2022) who correct for the change in the composition of assets that the rich hold – in particular, the growing importance of equities – and find that the decline in wealth inequality is more modest. Moreover, they find that if one looks at the very top of the wealth distribution (going beyond the top 10% or top 1%), then there has indeed been a rise in the share of wealth of the very rich.
Besides looking at different data sources, we also look at the evolution of economic inequality in India over the past decade from three angles, i.e., inequality in terms of consumption, income and wealth. From the conceptual point of view, we would expect consumption, income and wealth to be highly positively correlated – after all, those who are poor are likely to have low levels of all three and those who are rich, the opposite. These variables are influenced by each other through choices made by individuals (e.g., how much you save out of income determines wealth) as well as their circumstances, which in turn are shaped by both individual and aggregate level factors. Individual factors include the nature of the work they do, how predictable and certain their income flows are, whether they receive inheritance, the economic or health shocks they experience, as well as life-cycle considerations – such as saving for old age. The aggregate factors include macroeconomic conditions and shocks to income that may lead individuals to try and maintain consumption levels by drawing on their savings, which are part of wealth. Due to these reasons, the correlation will tend to be imperfect.
However, we can conceptually anticipate some patterns about the relative magnitude of inequalities in these dimensions. First, since wealth reflects savings, returns from investments that accumulate over time as well as inheritance, the long-run cumulative aspect of wealth accumulation would make wealth inequality to be greater than income inequality, which reflects current circumstances. Second, while consumption increases with income, the rate at which it increases tends to diminish as income grows, resulting in the well-known stylized fact that the savings rates of the rich tend to be higher than the poor. This factor tends to make inequality in consumption typically less than inequality in income. Moreover, to the extent that income flows tend to vary, individuals typically try to maintain their consumption levels. Despite economic trends that make the distribution of wealth or income more or less equal, the distribution of consumption tends to be more stable. Empirically, it is indeed an observed pattern that wealth inequality tends to be greater than income inequality, which, in turn, tends to be greater than consumption inequality (Bonsang et al. 2005).
2. Wealth Inequality
2.1 World Inequality Database
We examine wealth inequality in India by looking at two different data sources: the World Inequality Database (WID) and the recent All-India Debt and Investment Survey (AIDIS) report.
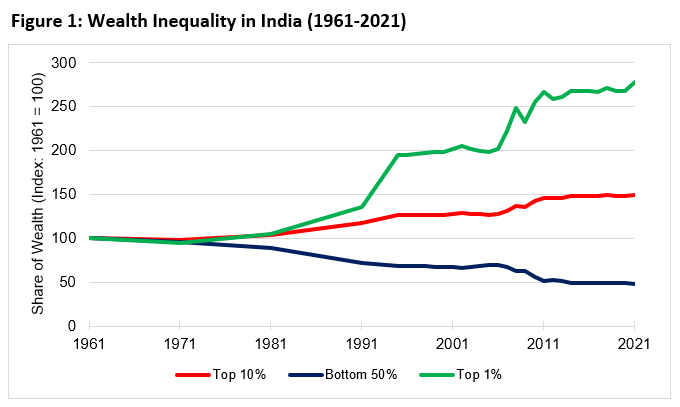
The WID provides important time-series data, enabling us to understand the evolution of inequality, while the AIDIS provides micro-level data for examining the changes in wealth inequality in India in the more recent years. Based on the WID data, since 1981 the share of the wealth of the top 10% and top 1% has consistently increased, while the share of wealth of the bottom 50% has consistently declined (Table 1 and Figure 1). For the most recent decade, the top 10% group has taken up more than 60% of the total wealth in India. This is in sharp contrast with the mere 6% of the total wealth shared by the bottom 50% of the population, suggesting a significant increase of wealth inequality in India over the past 40 years.
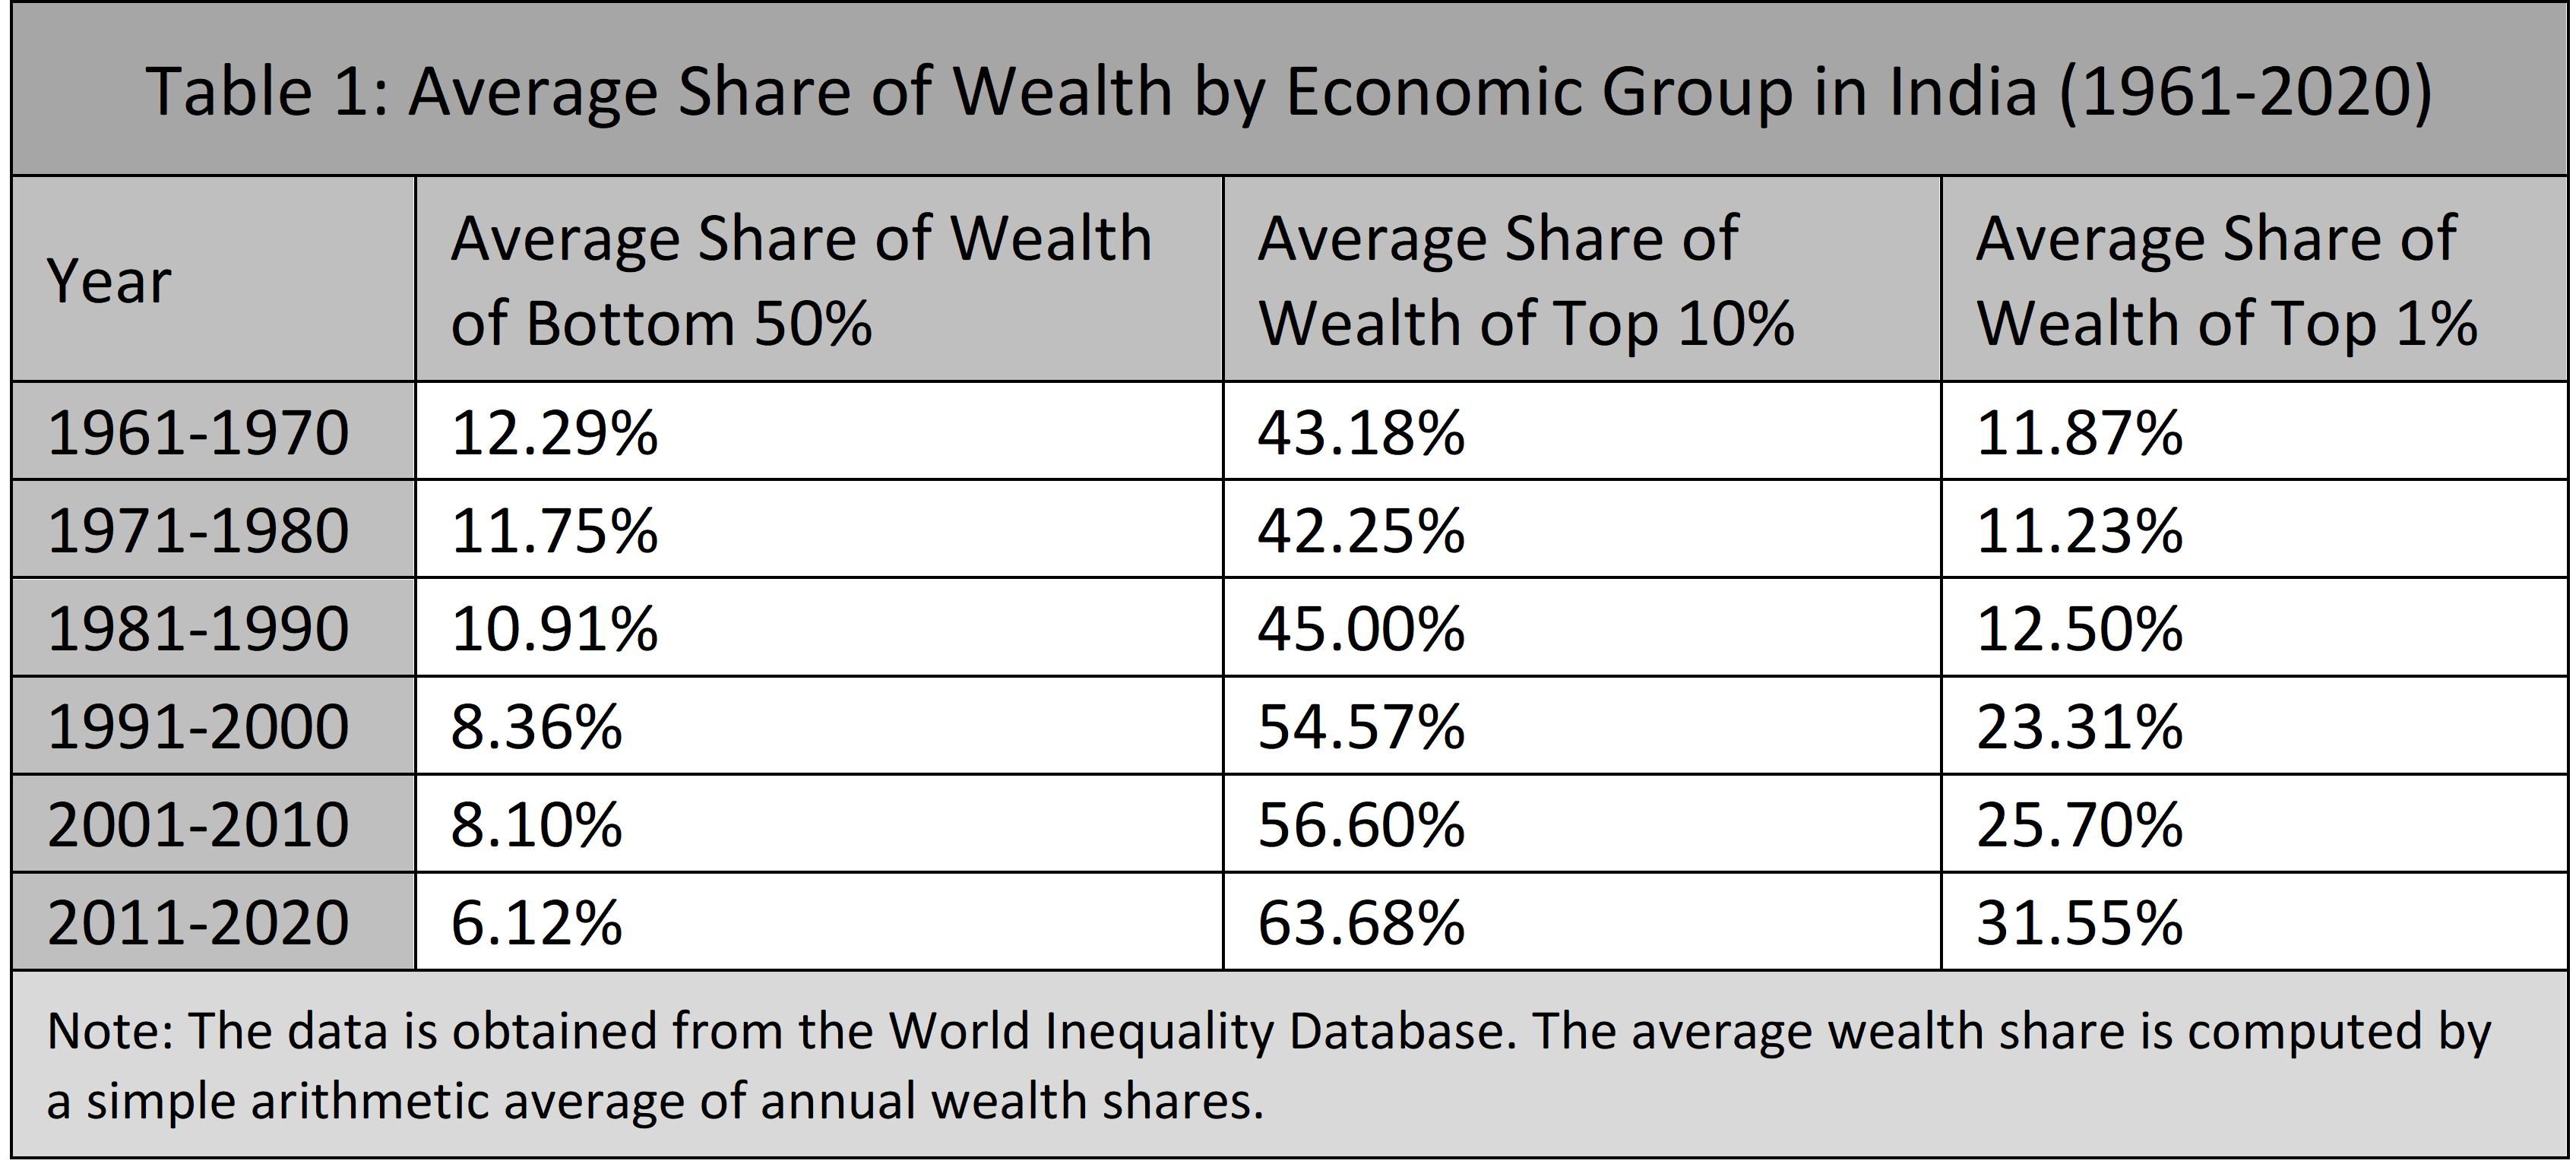
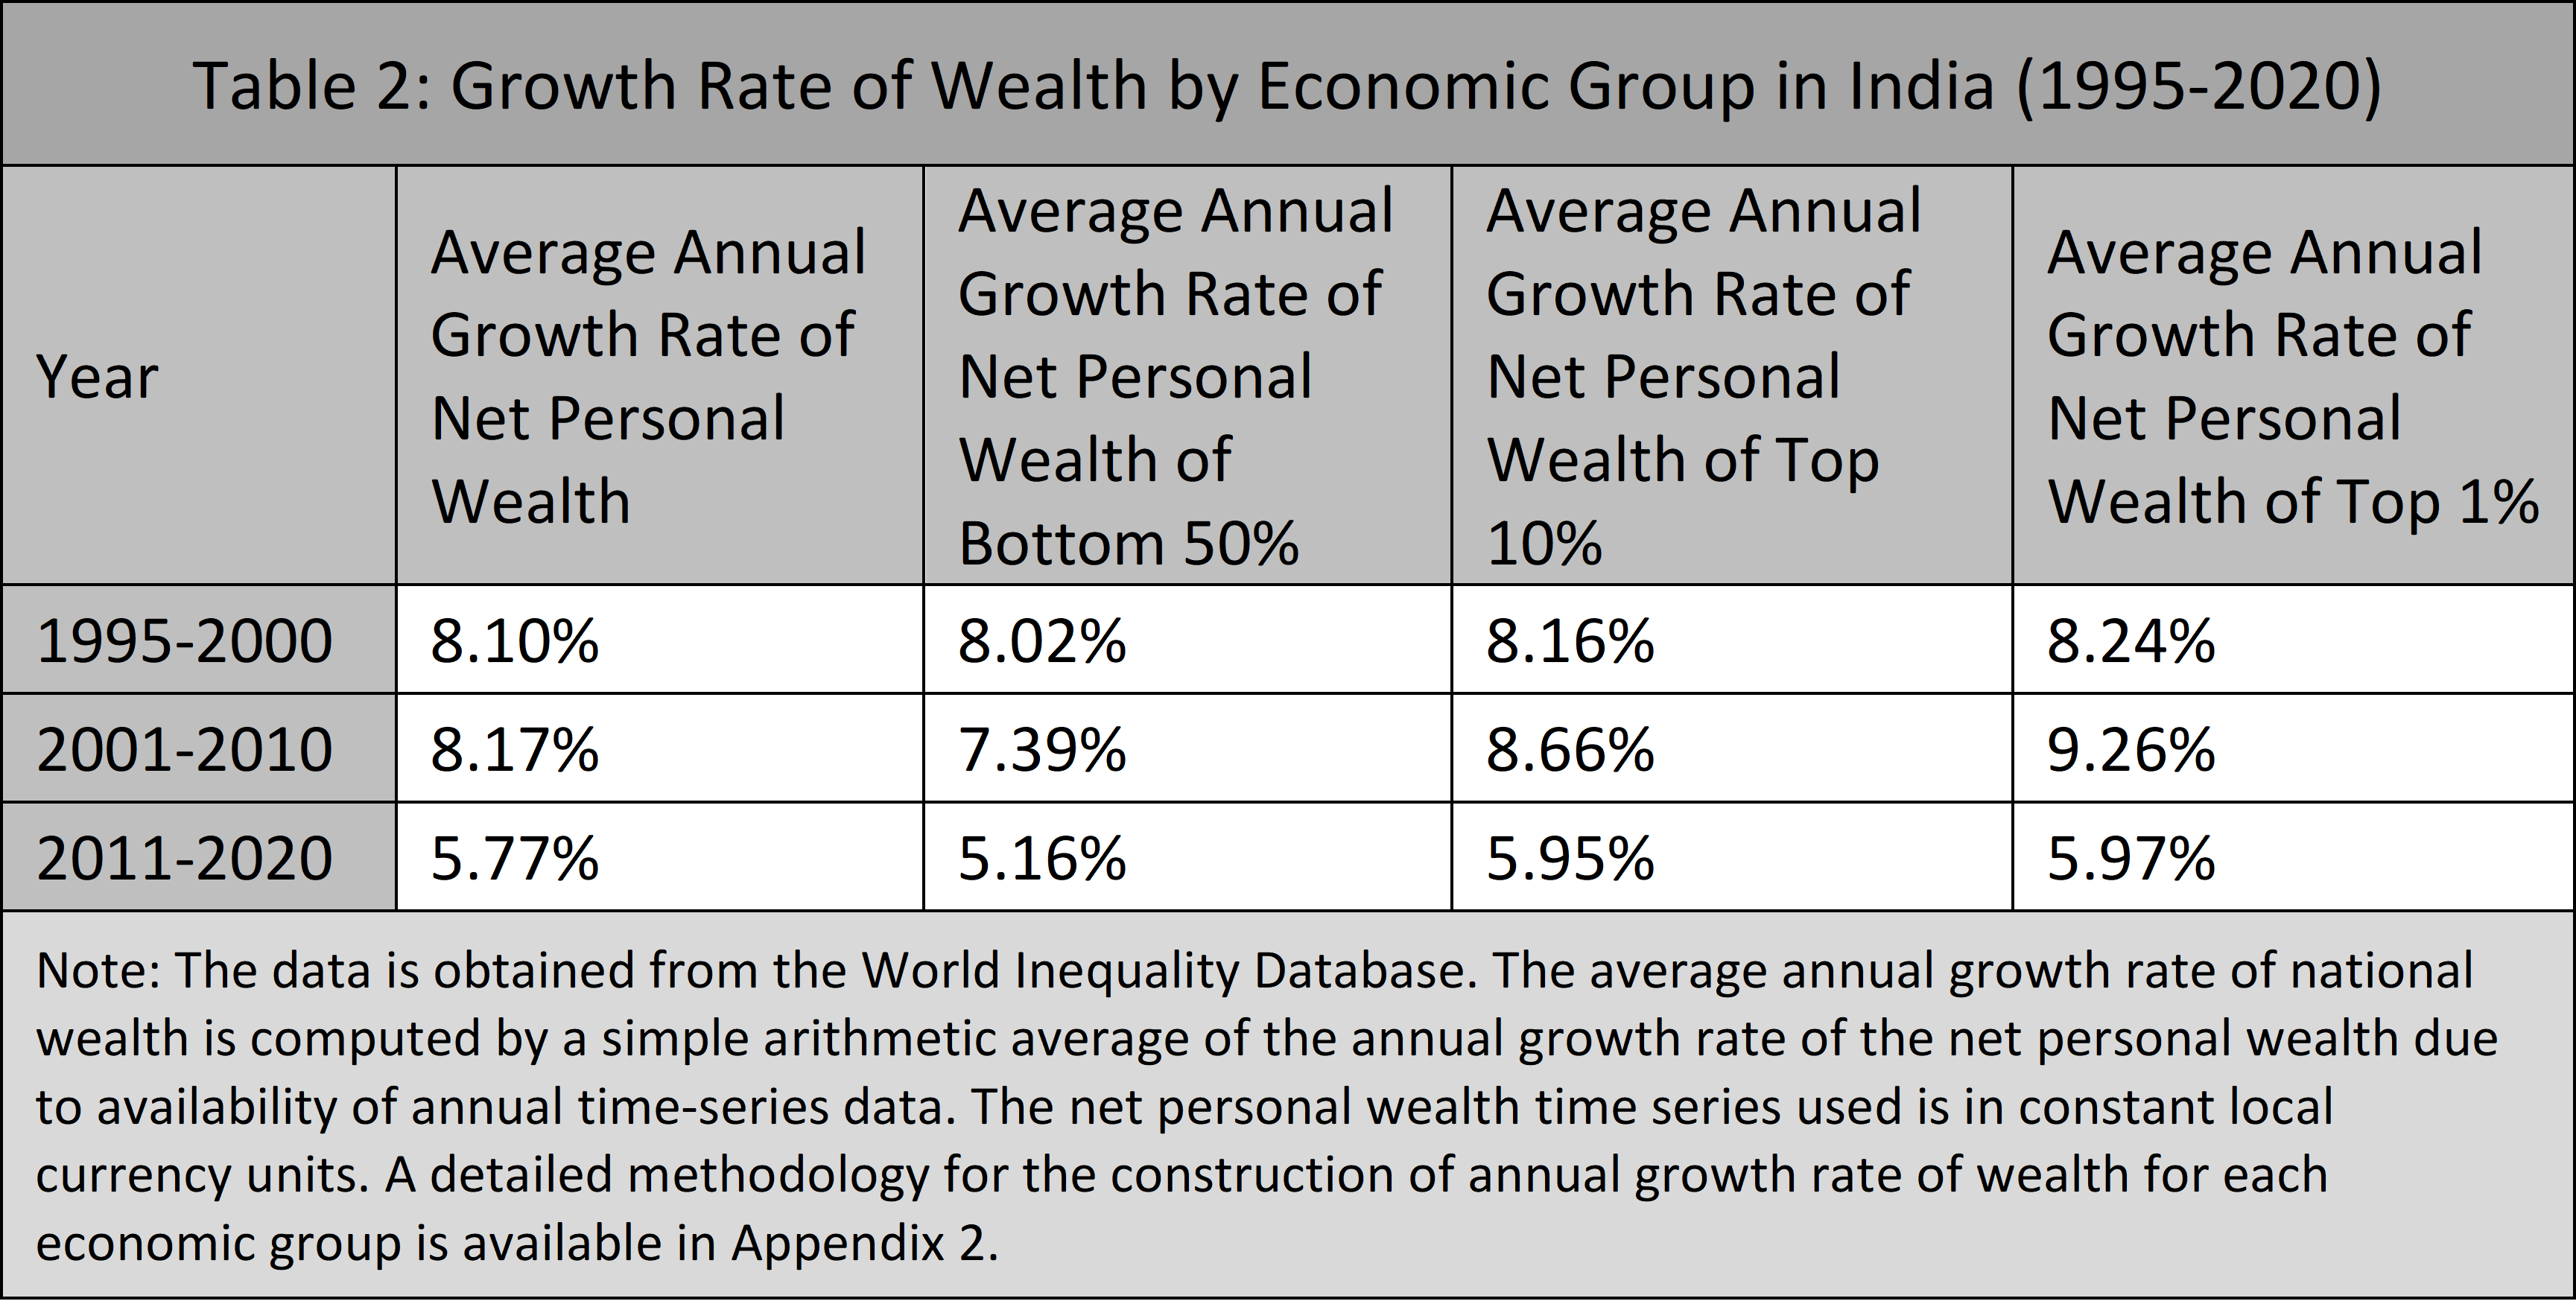
To understand the dynamics of wealth across different economic groups, we calculate the group specific growth rates of wealth based on the WID data. As shown in Table 2, the rich groups (i.e., top 1% and top 10%) experienced faster wealth accumulation than the bottom 50%, especially at the turn of the 21st century. Another takeaway from Table 2 is that wealth growth significantly slowed down after 2010, from a growth rate of roughly 8% in 1995-2010 to 5% in 2011-2020.
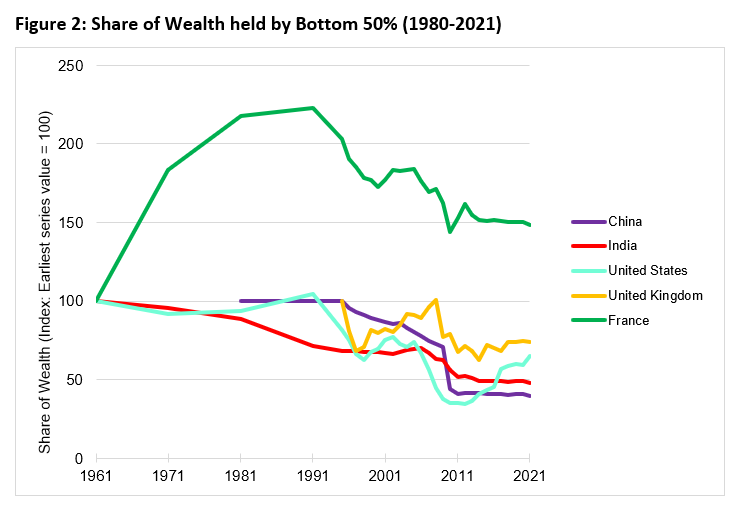
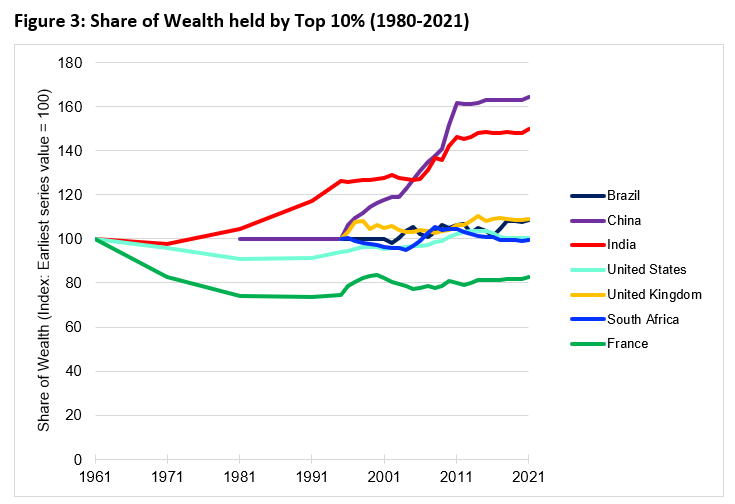
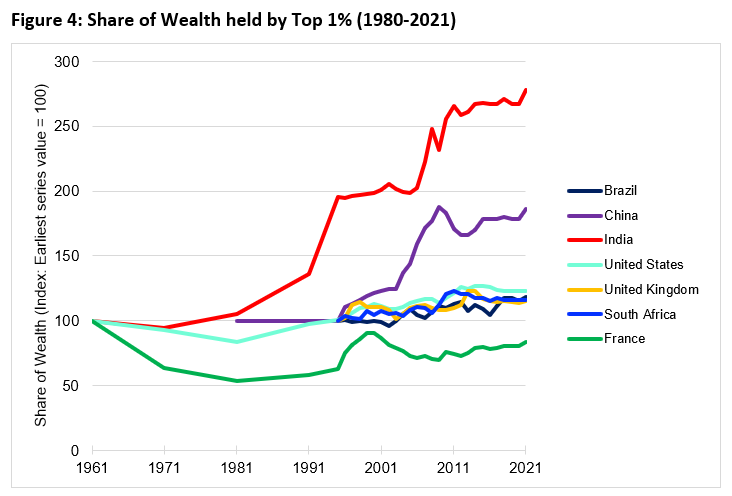
The WID also allows us to take an international comparison of the wealth distribution dynamics among peer and advanced economies. For India, the share of the wealth of the bottom 50% has nearly halved since 1961 (Figure 2). In contrast, the share of wealth of the top 10% has increased by around 50% (Figure 3) and the share of wealth of the top 1% has increased by around 180% since 1961 (Figure 4). Among the economies, India has experienced the largest increase in the share of wealth of the top 1% since 1961. However, even in terms of other measures (such as the share of the bottom 50% and the top 10%), it is at the top of the list, with only China being slightly ahead.
2.2 All-India Debt and Investment Survey Data
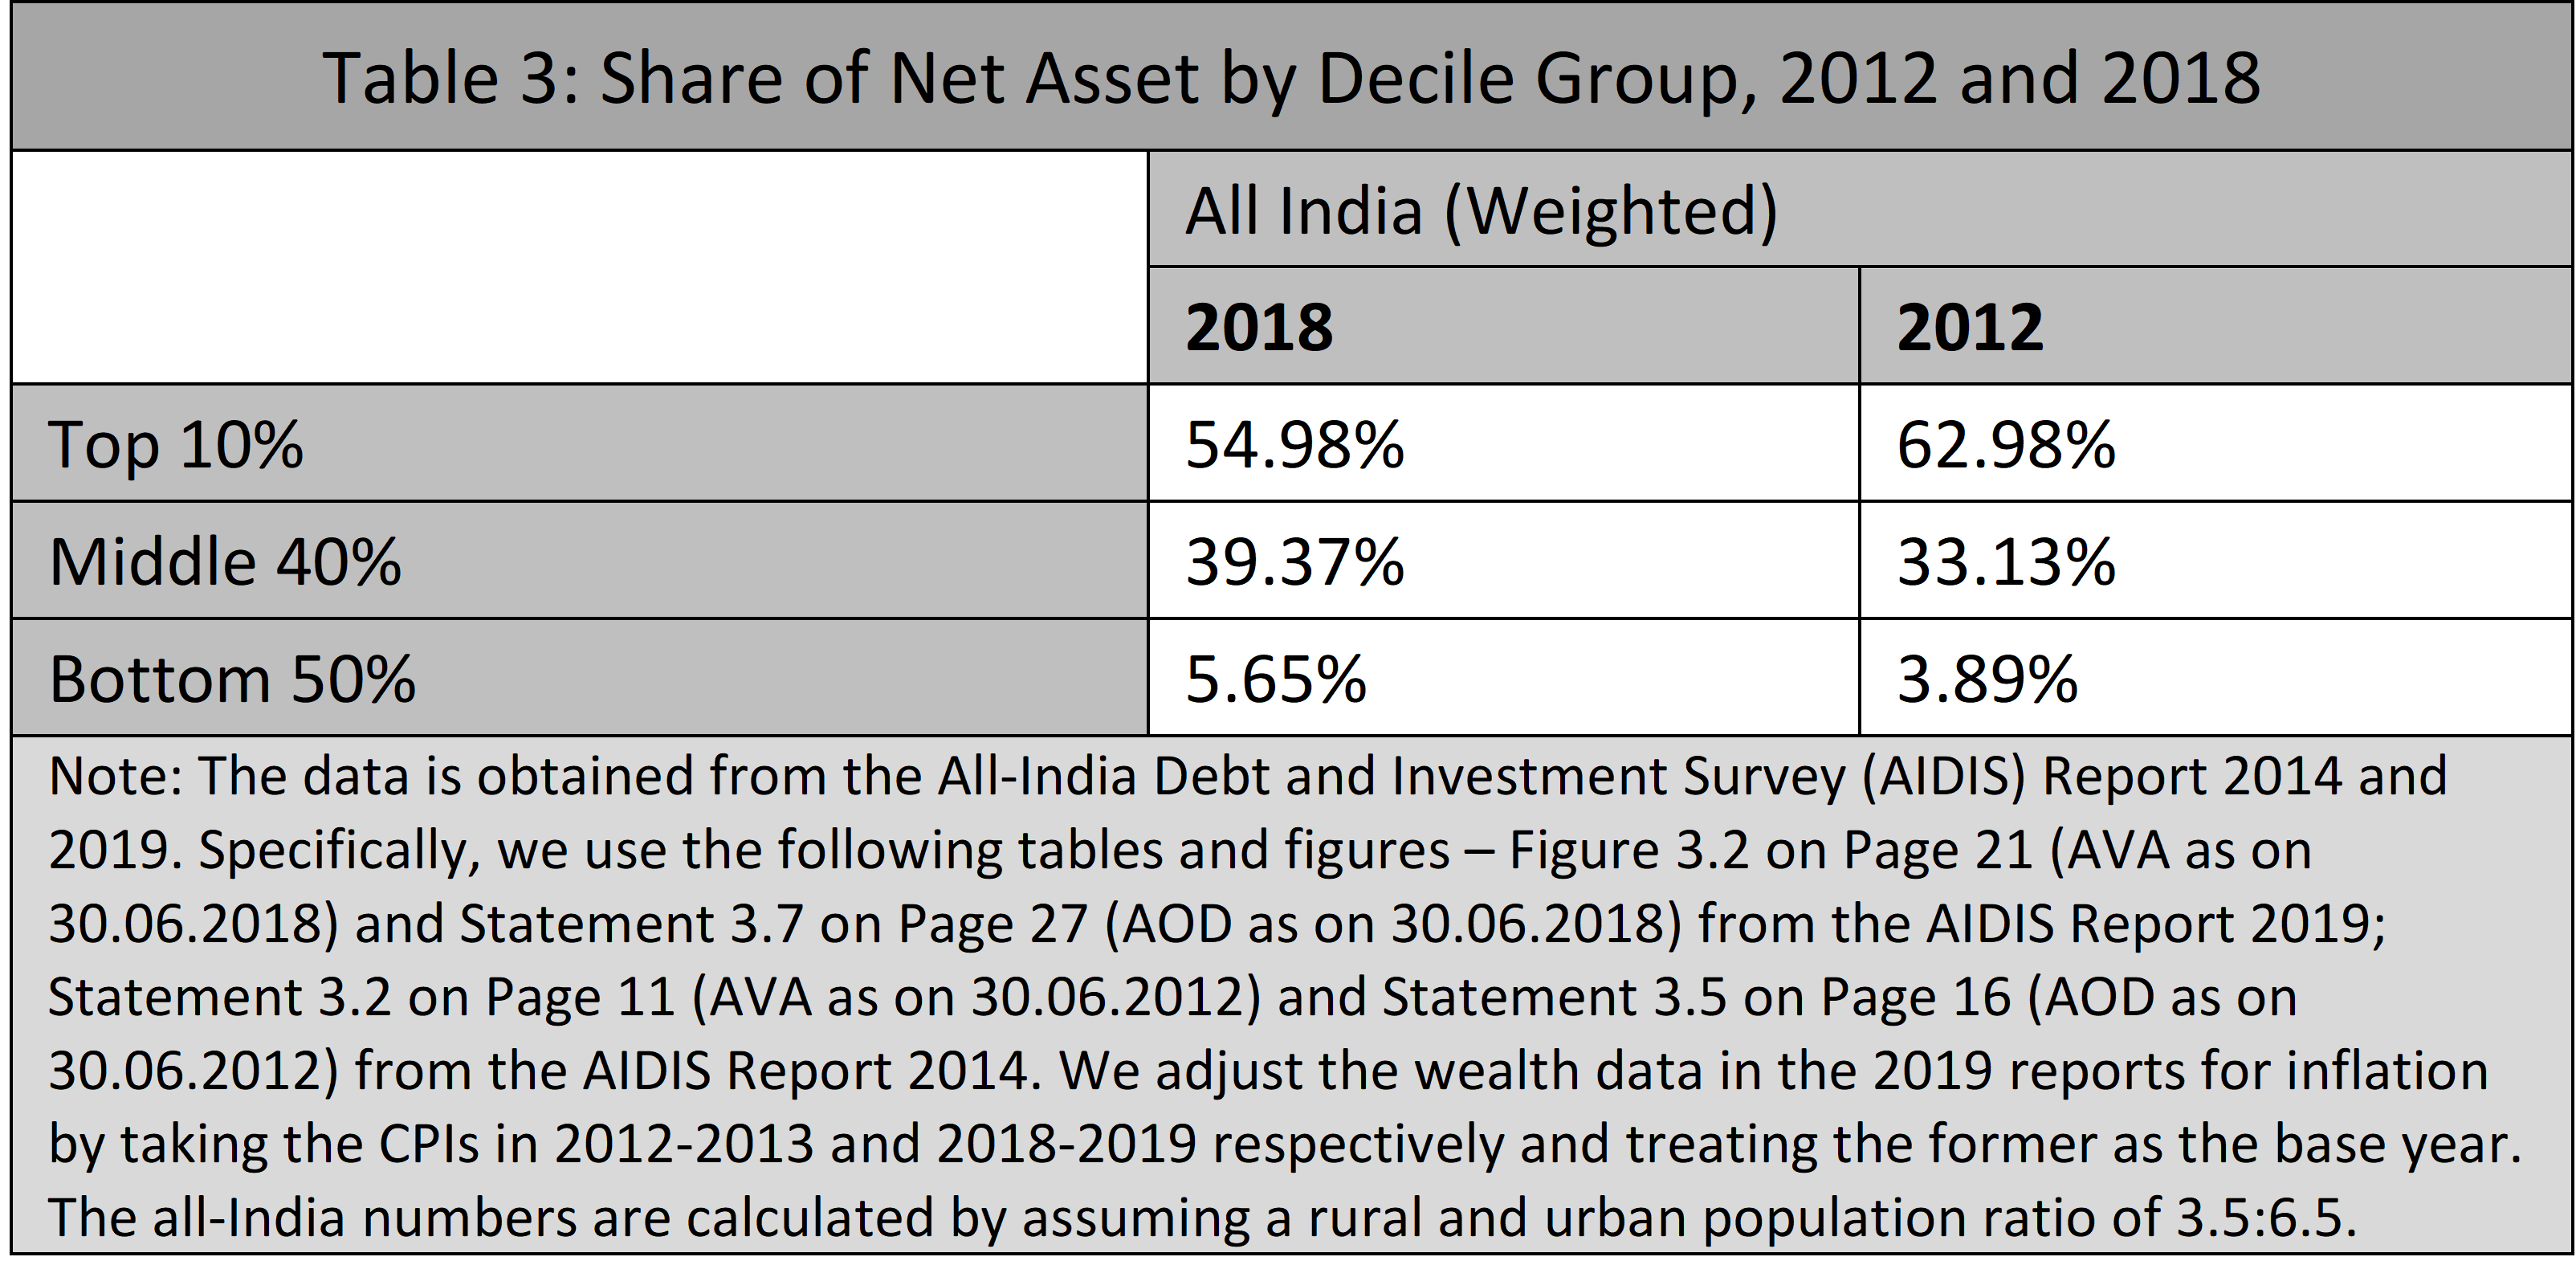
The WID data does incorporate the AIDIS reports (except for the very last round) but it is instructive to look directly at the AIDIS report to assess changes in wealth inequality in India. Table 3 presents the share of net assets (out of total net assets) among the rich, middle class, and the poor households in 2012 and 2018. The share of net assets of the middle 40% and bottom 50% has risen, respectively, from 33% to 39%, and from 4% to 6%. The top 10% 's net asset share has fallen from 63% to 55% – suggesting that wealth inequality went down in recent years.
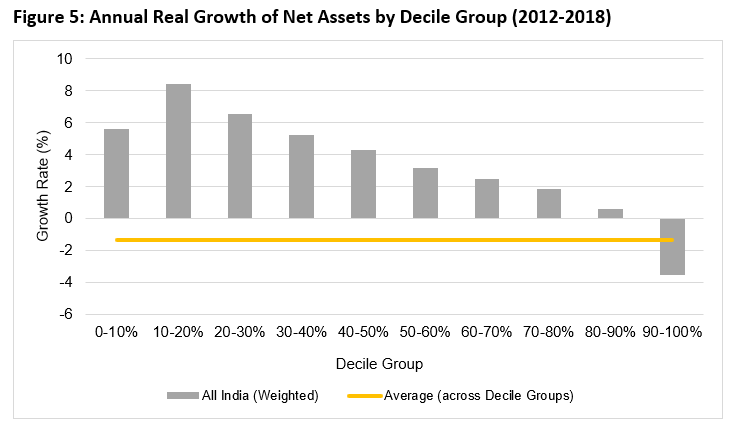
Similar to our analysis with the WID data, the decile group-specific growth rates of assets as in the AIDIS data are plotted below to capture the dynamics of wealth accumulation over the recent years. In Figure 5, we present the annualized growth rates of net assets (that is, gross assets minus debt) for each decile group in the asset distribution, adjusted for inflation. From these sets of figures, we find that among the ten decile groups, only the richest top 10% experienced a negative growth rate of net assets, while all other groups witnessed positive net asset growth—with annualized growth rates ranging from 2% to 8%. The bottom 10-20% group experienced the highest growth rates of assets, suggesting that the poor are gradually accumulating wealth in recent years. The yellow line captures the average real growth rate of net assets, and it is significant that this is in fact negative, which is driven by the negative growth rates of the richest 10%.
Our two data sources seem to show conflicting trends in wealth inequality in India over the last decade. The WID data, which covers a longer time span, reveals a stark increase in wealth inequality over the last 40 years, and this is not generally seen in peer and developed countries. However, based on the AIDIS reports, we find that Indian households have been experiencing a more recent decrease in inequality, measured in terms of gross and net assets from 2014 to 2019. It should be noted that the WID wealth data uses the AIDIS survey to estimate agricultural land by households in 2012 and, then, extends the estimates for 2013-2020 by assuming a constant share of agricultural land in national income as in 2012 (Bauluz et al. 2021). 3See Appendix 1 for more details on the data issues. Hence, it might be instructive to look at more recent changes in wealth inequality from the AIDIS reports directly. While in general, the WID data provides a valuable picture of the long-term evolution of wealth dynamics in India, we expect an updated version of WID to factor in the more recent data provided by AIDIS.
We should also be cautious about interpreting the AIDIS results as the sample frame is unlikely to capture what is going on at the very top of the distribution. Anand and Kumar (2022) argue that the AIDIS survey data is likely to be subject to under-reporting and under-sampling of the rich. In an interesting exercise that they carry out, they append the AIDIS data with data released from rich lists and document a sharp increase in wealth concentration in the top 0.001 percentile of the population, with a 16% growth in wealth (as opposed to the negative growth observed for the richest, based on the AIDIS data alone). As a result, the overall decline in wealth inequality becomes more modest by taking into account the missing rich in the survey data.
3. Income Inequality
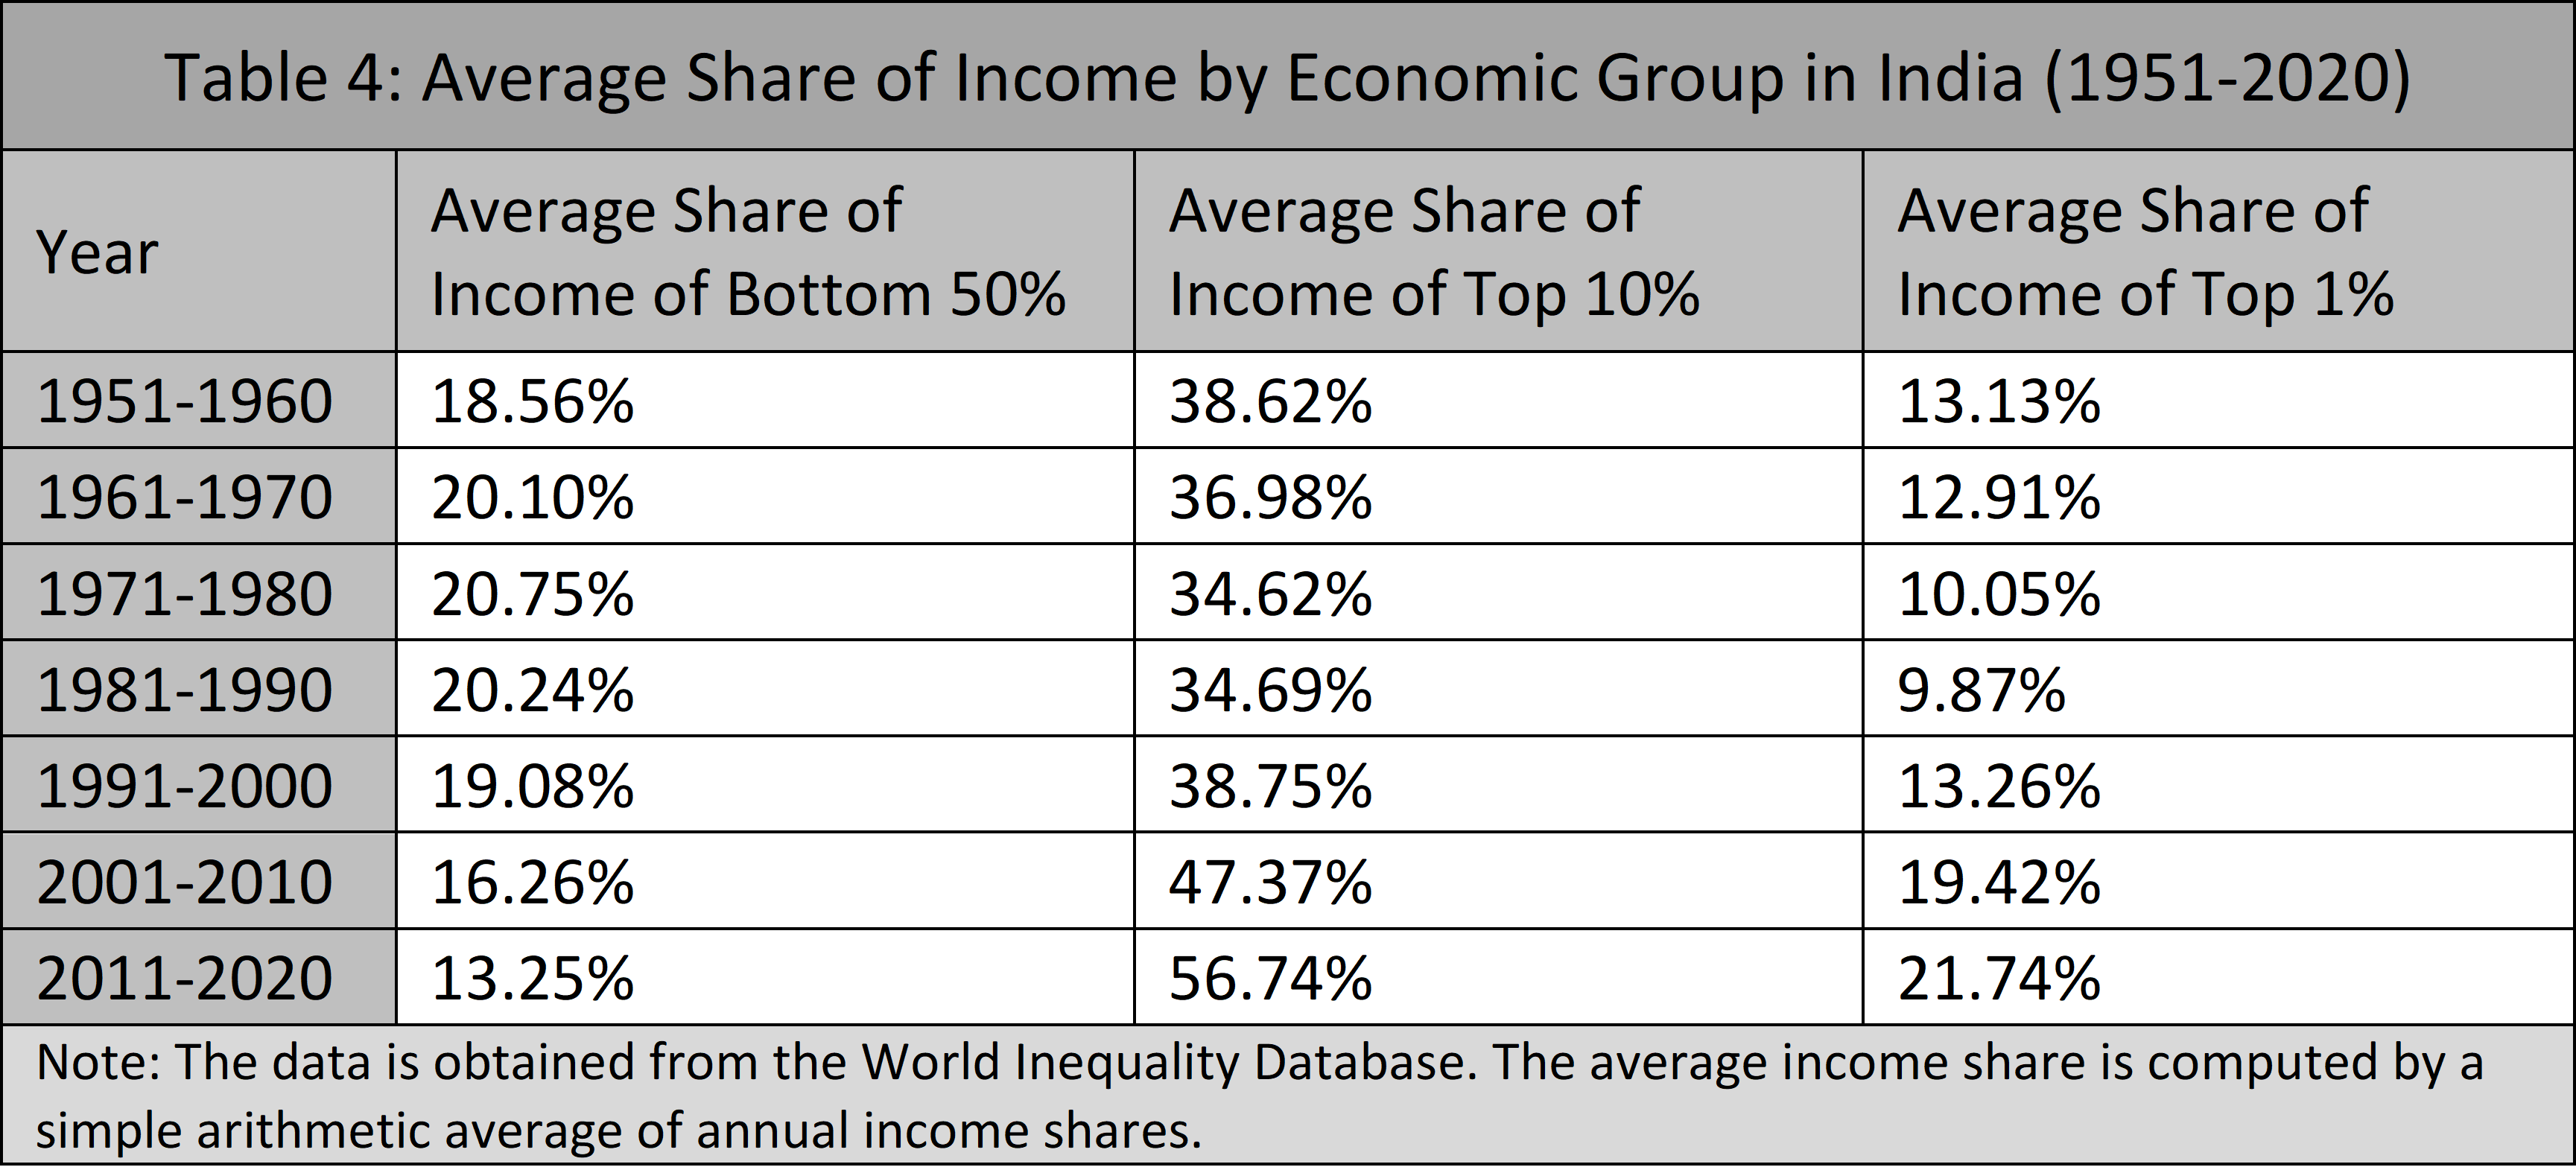
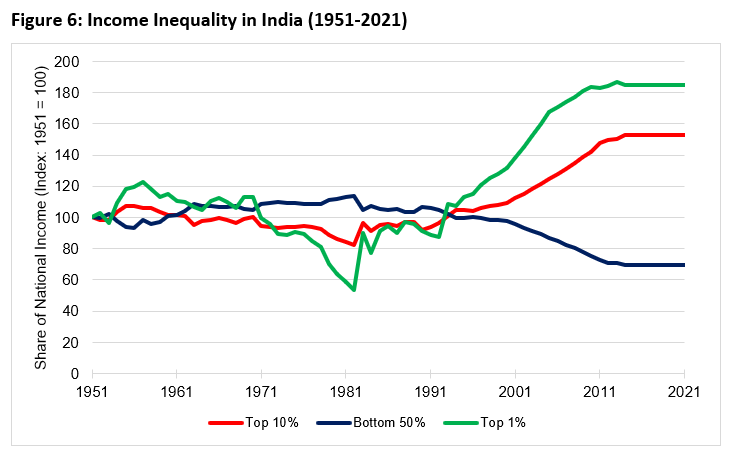
Based on WID data, Table 4 and Figure 6 present the average share of national income held by the bottom 50%, top 10%, and top 1% of the population, by decade. (See Appendix 1 for details)
Between 1951 and 1991, the share of national income held by various economic groups witnessed modest increases and declines. However, after 1990, the share of the national income of the top 10% and top 1% has consistently increased while the share of the national income of the bottom 50% has consistently declined, suggesting a widening gap of income between the rich and the poor.
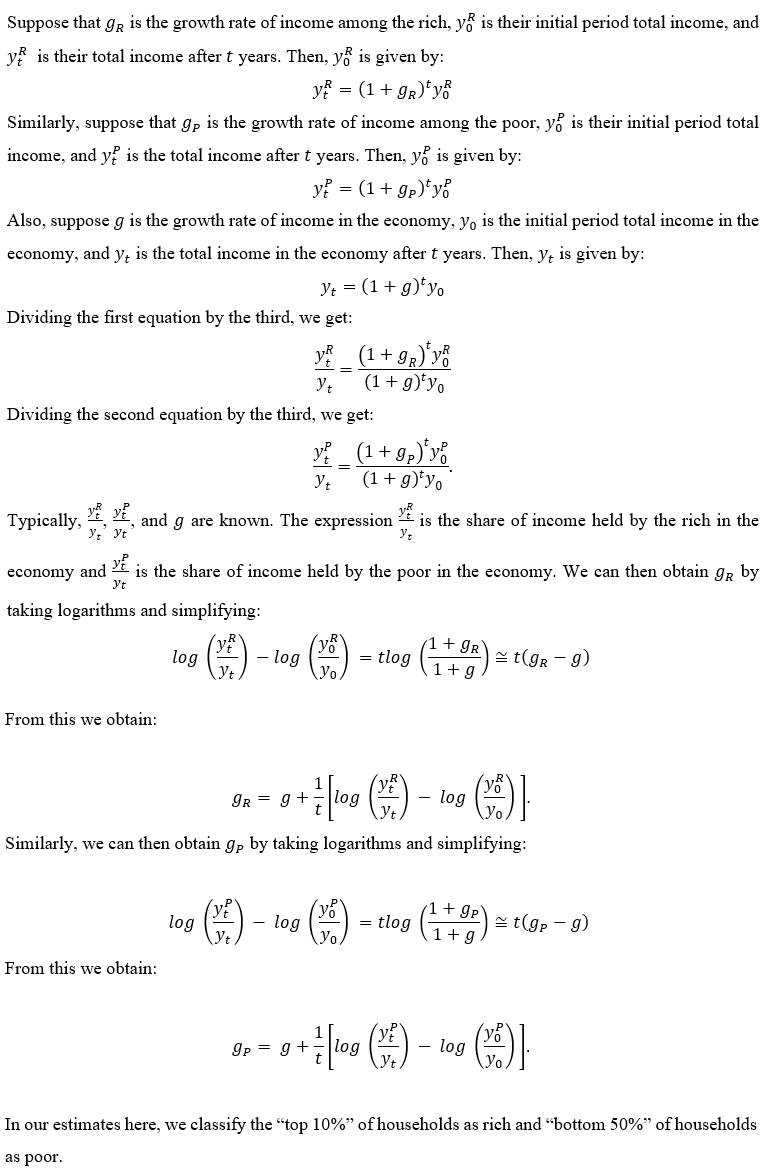
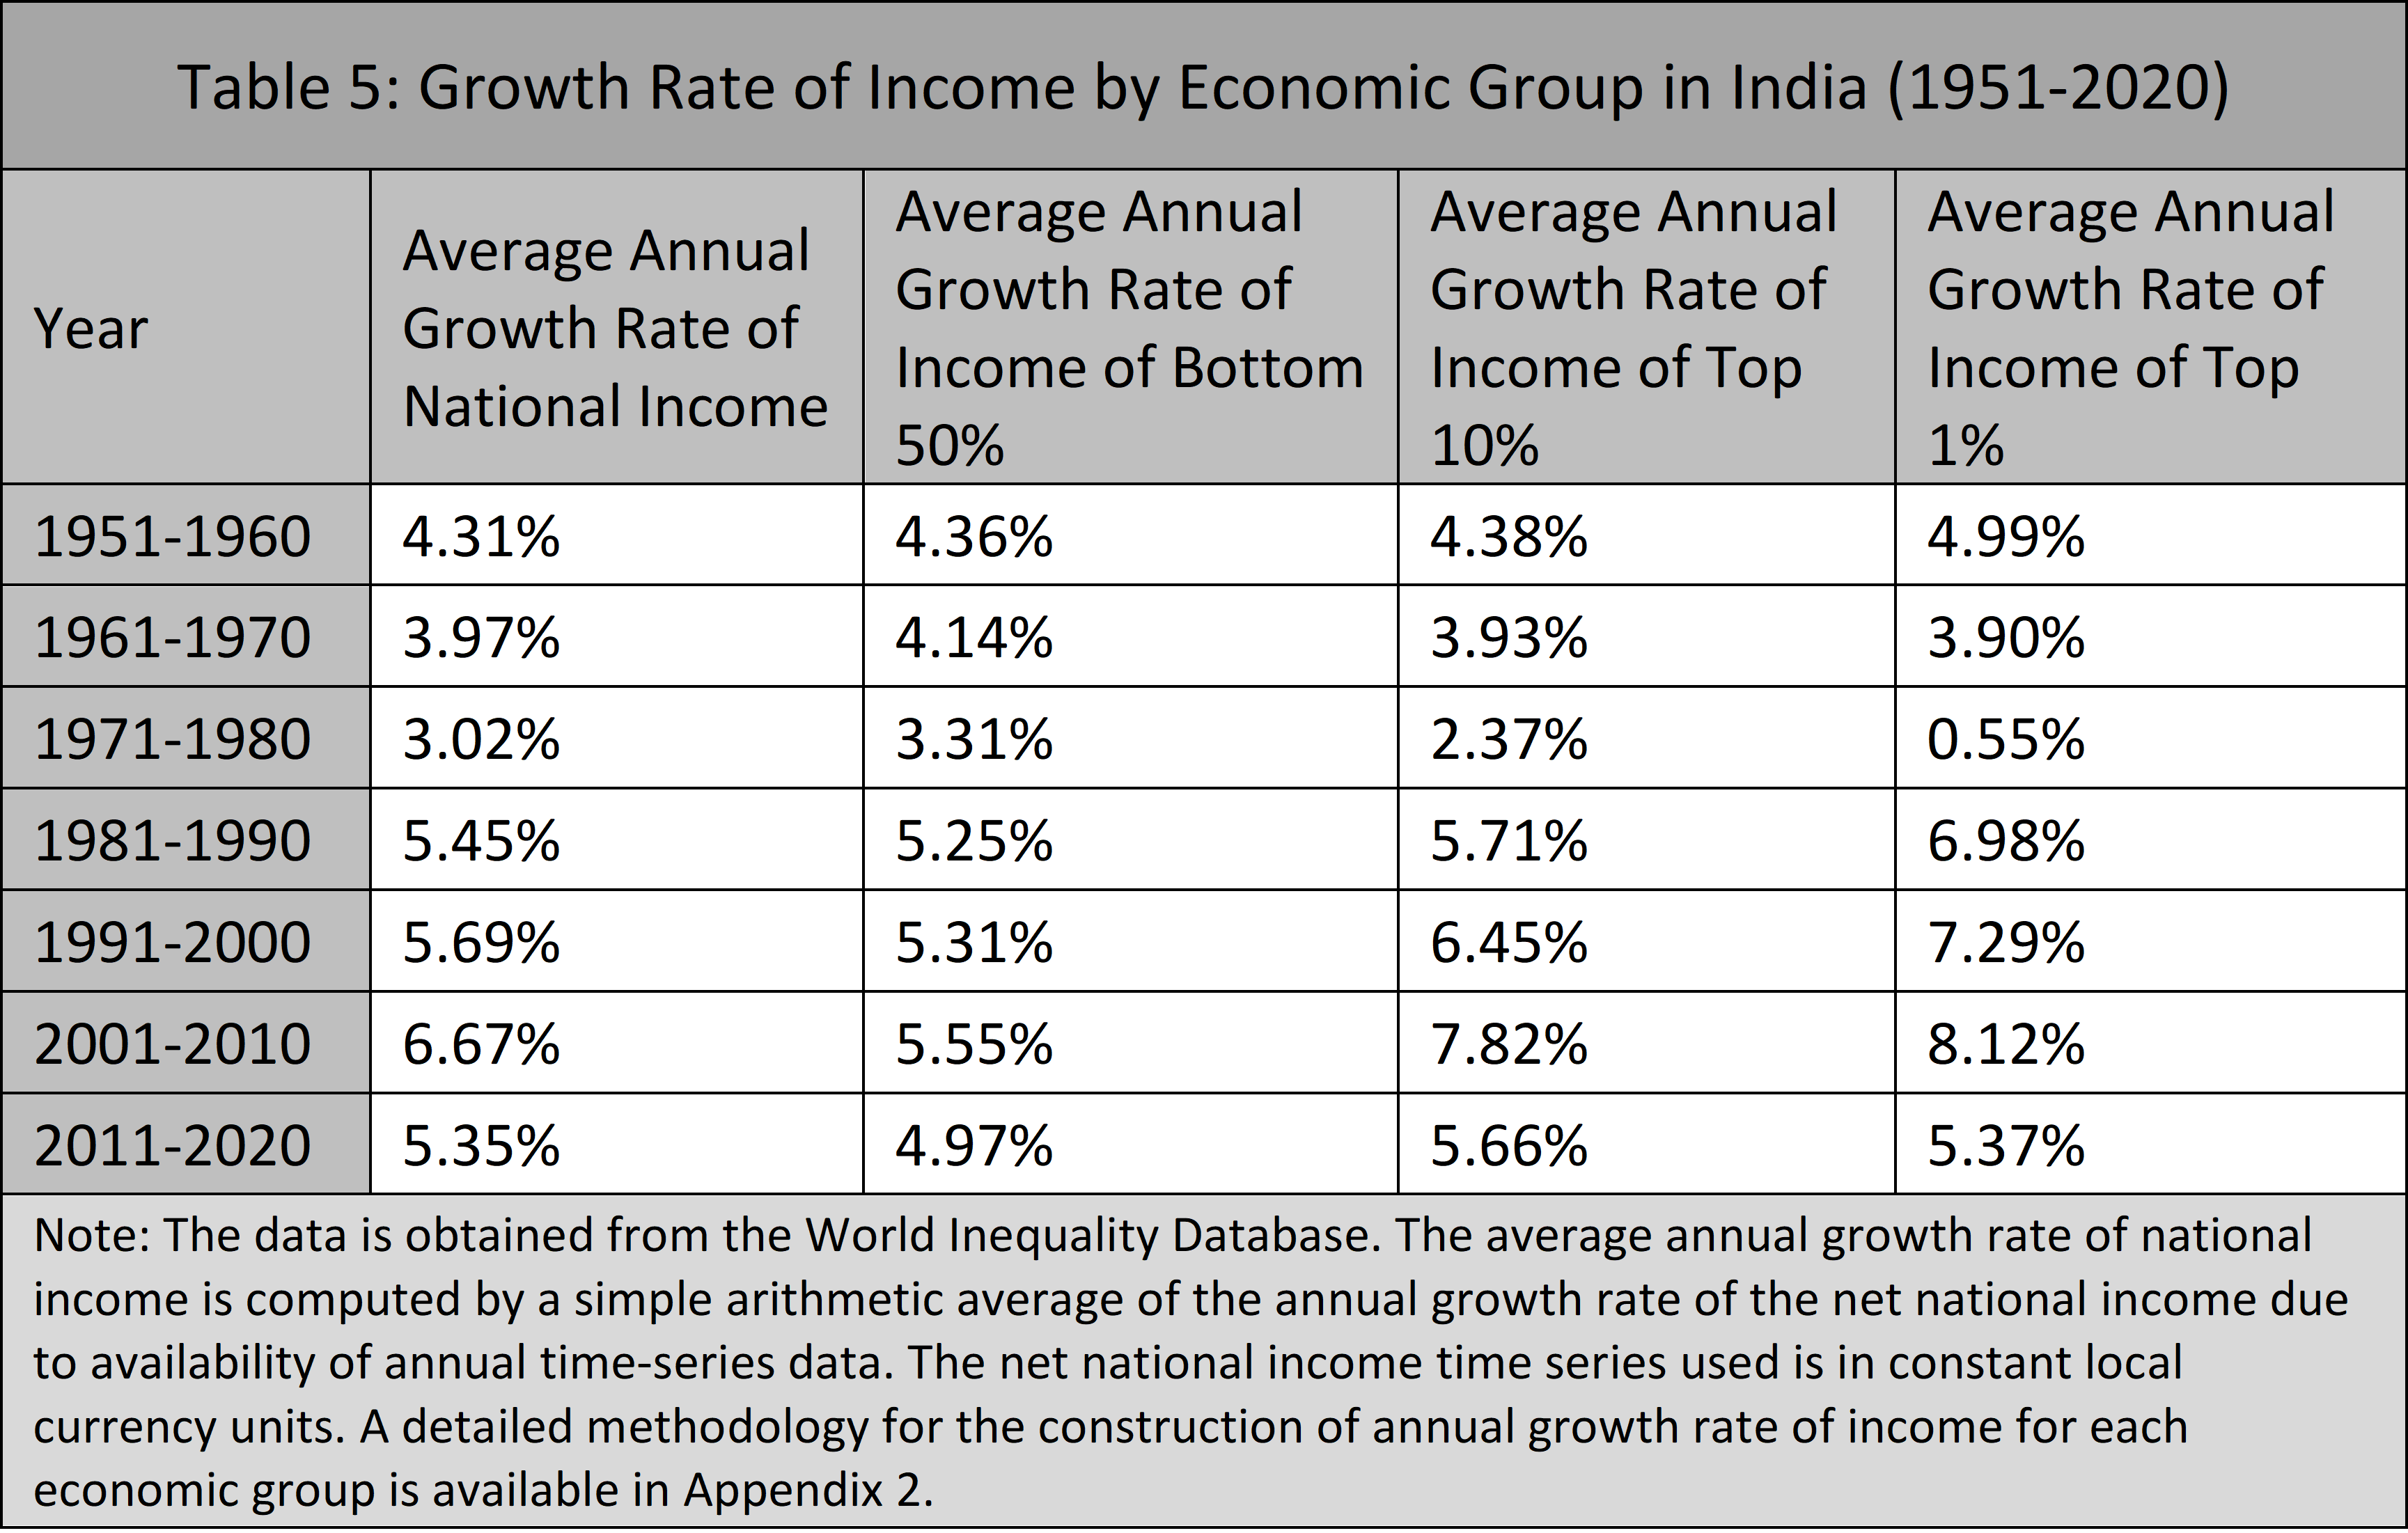
The growth rate of income in an economy is an important measure of the health of an economy, indicating the size of change in economic output. The underlying reason for emphasis on economic growth is that positive economic growth trickles down to the poor, thereby benefiting all individuals. However, data suggests that the growth of income of the poor typically lags behind that of the rich. We compute growth rates of income across economic groups in India since the mid-20th century using the share of the national income of each economic group. (A detailed methodology is available in Appendix 2). As shown in Table 5, the growth rates of income of the rich (top 1%, top 10%) and poor (bottom 50%) diverge more prominently after 1980. The most recent decade, however, shows a decrease in the gap between the growth rates of income of the rich and the poor.
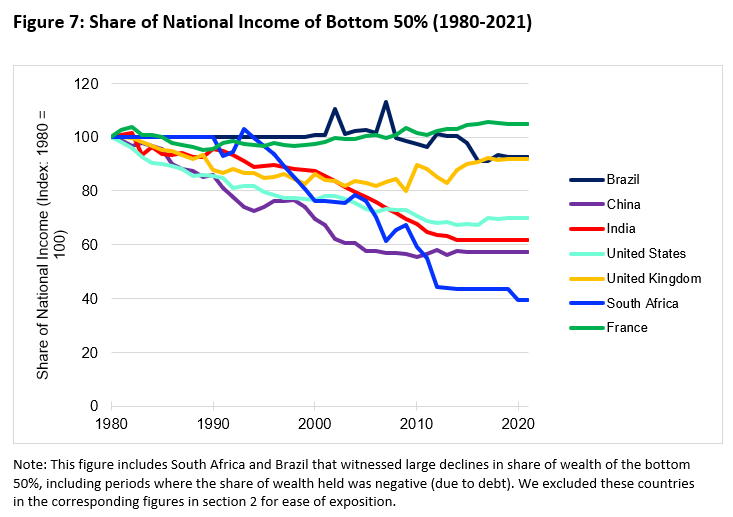
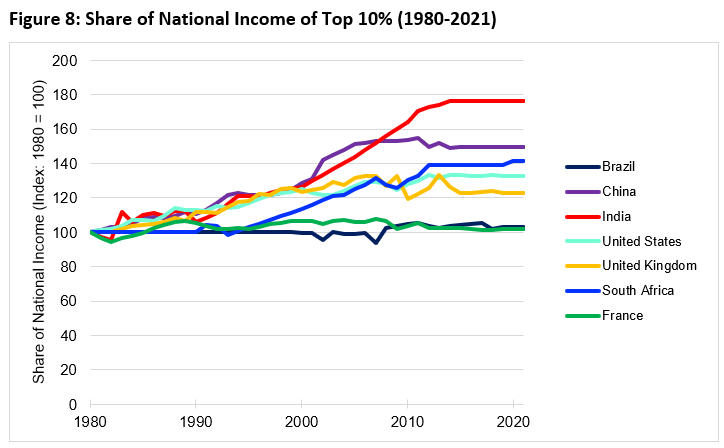
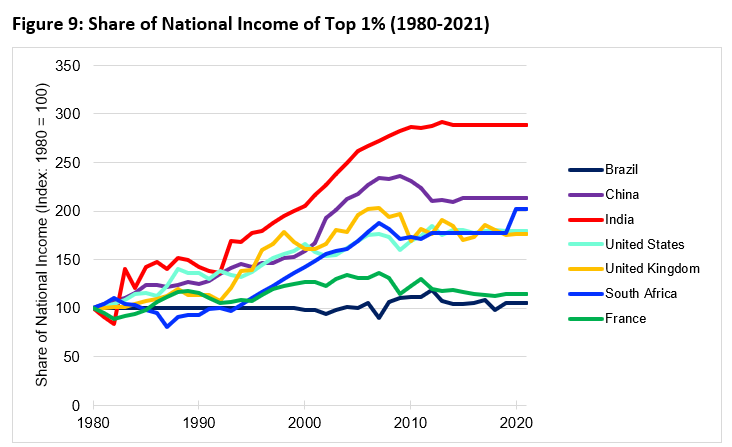
We also compare the evolution of income shares in India to peer and advanced economies. In India, the share of the national income of the bottom 50% has decreased by around 40% since 1980 (Figure 7). In contrast, the share of the national income of the top 10% has increased by around 80% (Figure 8) and the share of the top 1% has increased by around 180% since 1980 (Figure 9). Among the economies we compare India with, India has experienced the largest increase in share of the national income of the top 1% and top 10% since 1980. Other emerging economies such as China and South Africa also witnessed a widening income gap between the rich and the poor, similar to the Indian experience.
As we mentioned previously, one might need to take extra care while analyzing Indian income inequality in recent years using data from WID. The income levels are estimated from tax data (for the top income groups) and are extrapolated based on consumption survey data by assuming certain income-consumption ratios. For years where tax or consumption survey data are missing, the WID data assumes a constant growth rate between the years (Chancel and Piketty (2019)). Subject to these data limitations for the recent years, there appears to be a trend of increasing income inequality since the early 1980s. When new consumption survey data become available and are incorporated into the WID, we can obtain a more accurate picture on changes in Indian income inequality in recent years.
4. Consumption Inequality
4.1 NSS data
Our data sources suggest a decline in consumption inequality over the recent decade. The NSS data collected by the NSSO indicates that consumption inequality in India decreased from 2011 to 2017. 4We use the leaked draft of the NSO Report on Household Consumer Expenditure for 2017-18 that was never officially released, and has been previously analysed by Subramanian (2019). Table 6 presents the share of monthly consumption expenditure by the rich, middle class, and the poor households (out of the total consumption expenditure in the economy) across India in 2011 and 2017. The share of consumption expenditure by the top 5% and top 10% groups has decreased between 2011 and 2017, while the share of consumption expenditure by the bottom 50% has increased.
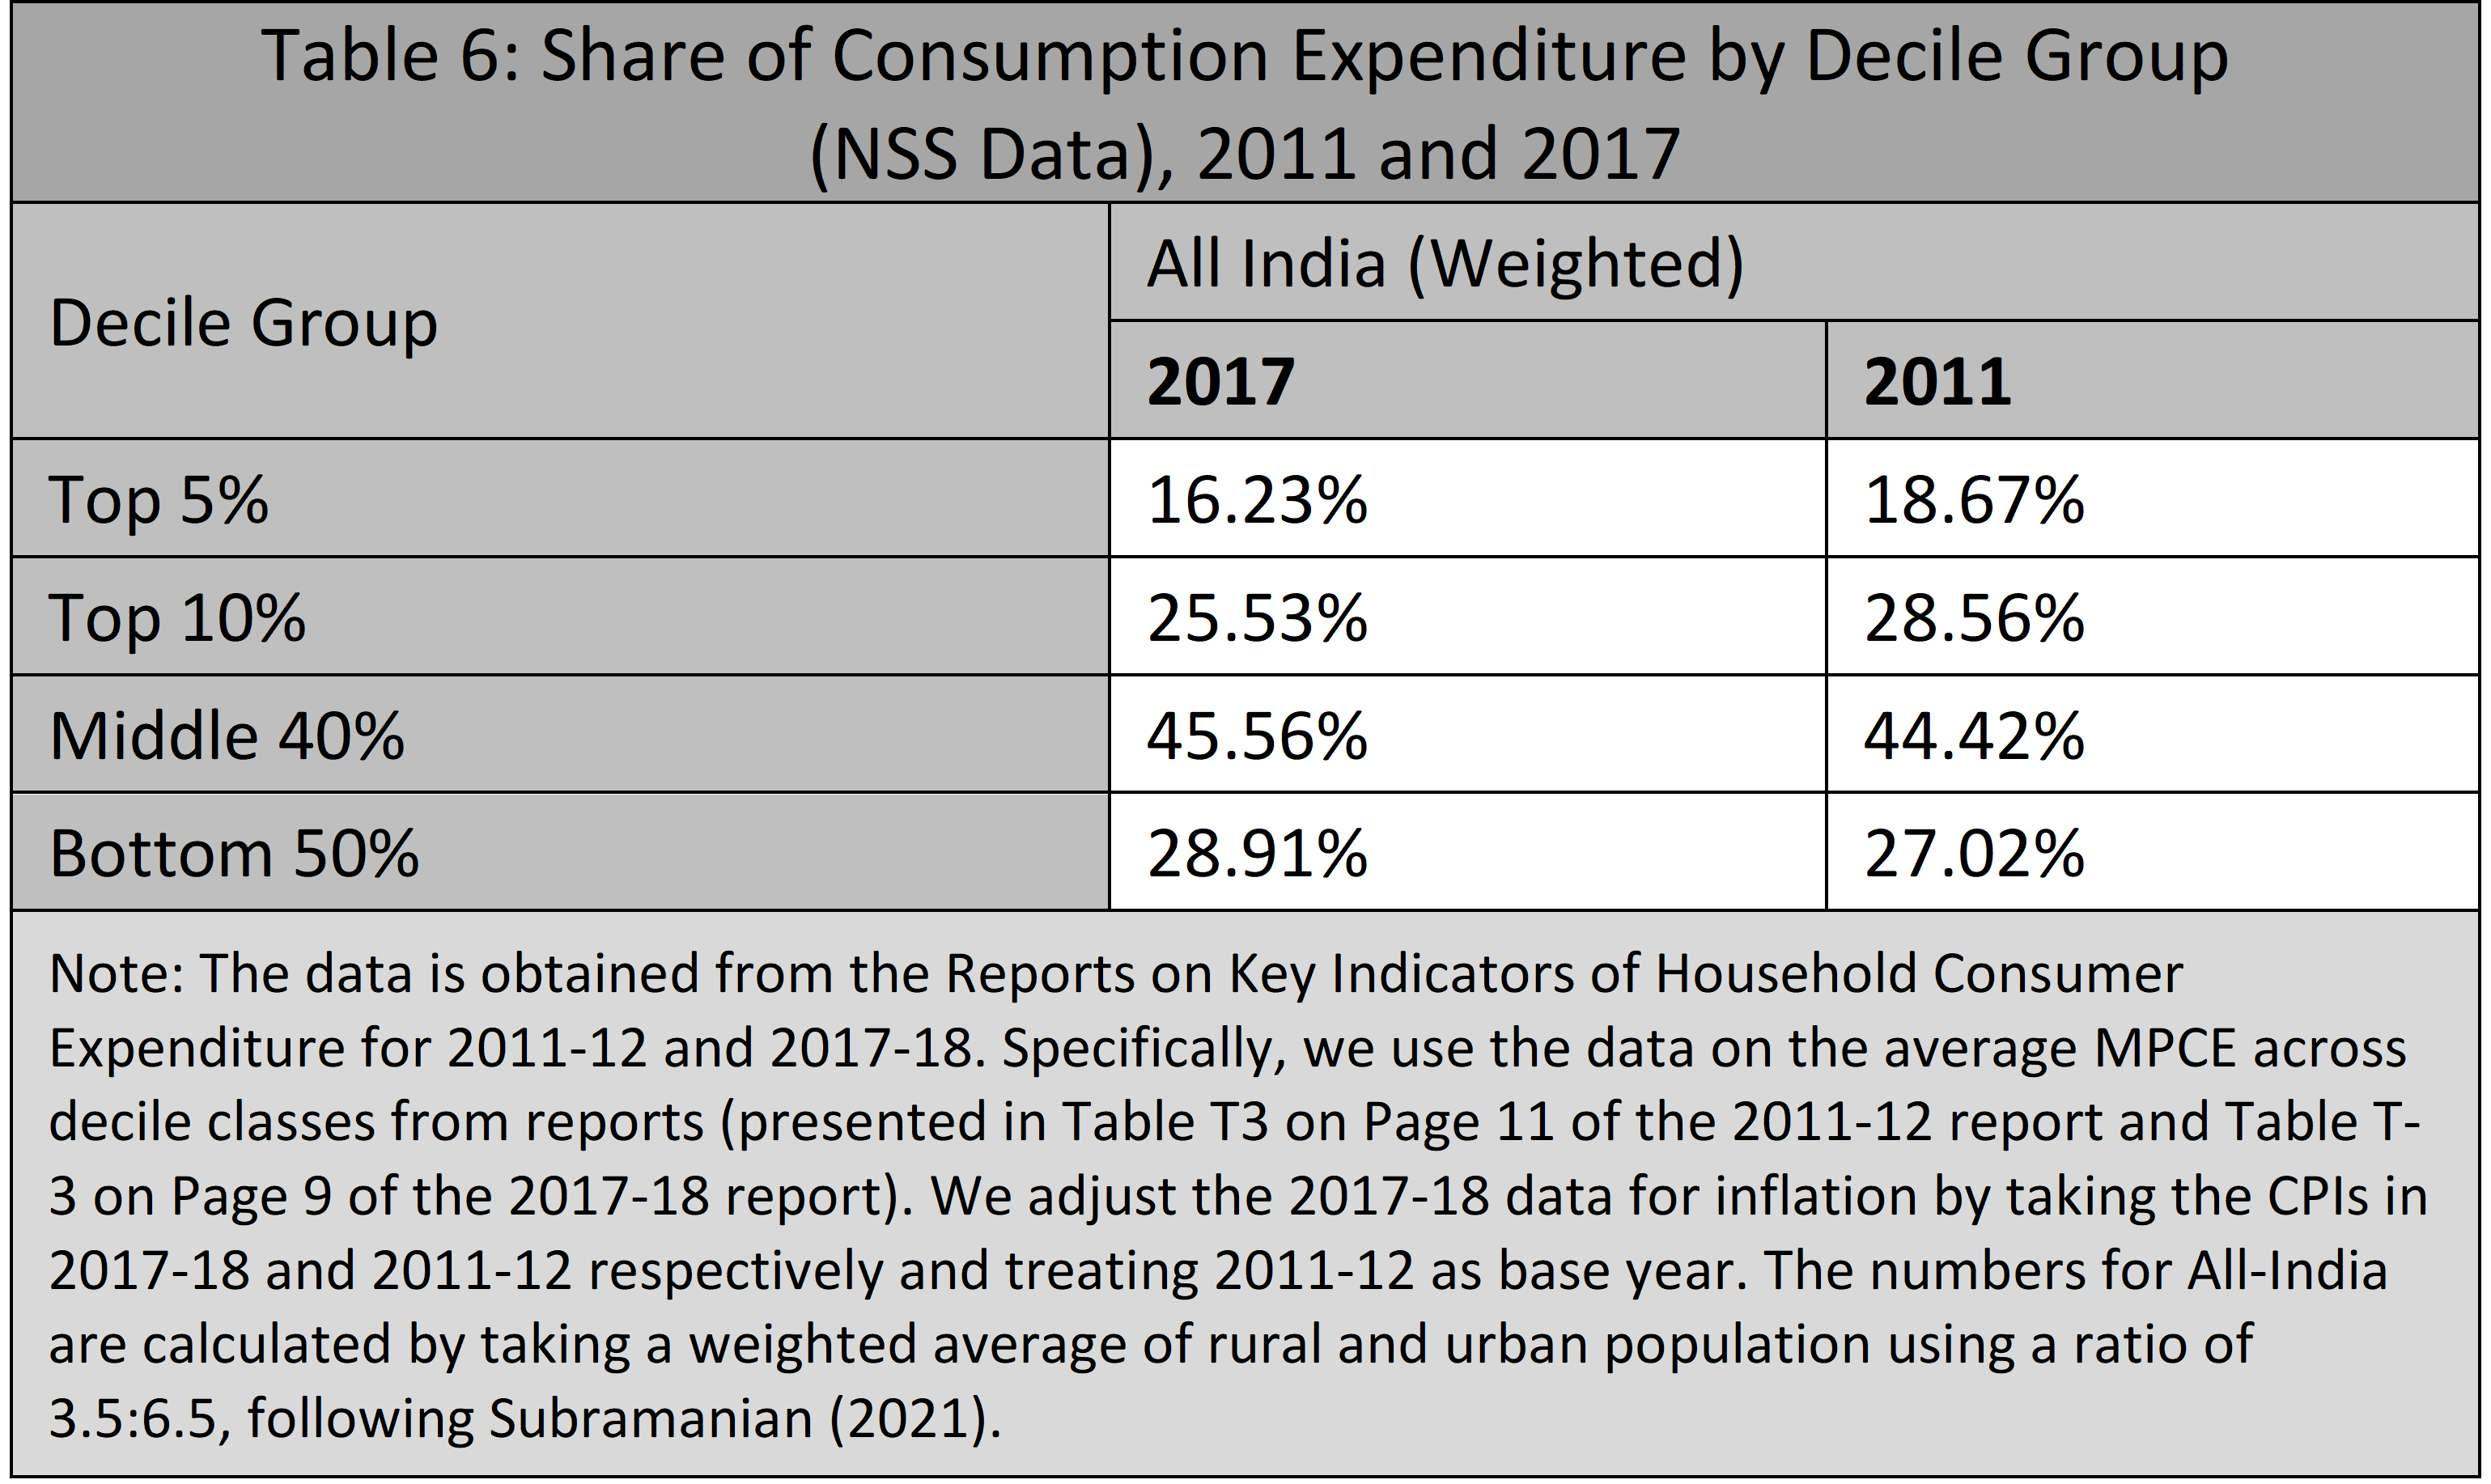
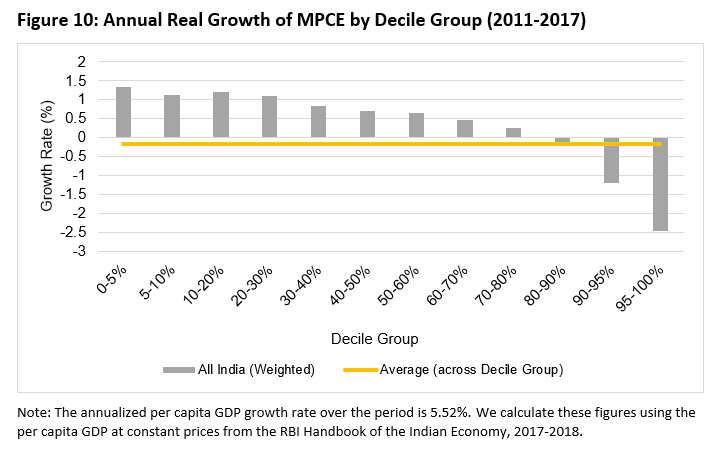
Table 7 presents the annualized real growth rate of the average monthly per capita consumption expenditure (MPCE) between 2011 and 2017, for the rich, middle class, and the poor households. We observe positive consumption growth for the middle 40% and bottom 50% alone. The top 10% households have been spending less in 2017 than in 2011 (corrected for inflation), witnessing a sharp drop in consumption expenditure and negative consumption growth rates of around 2%.
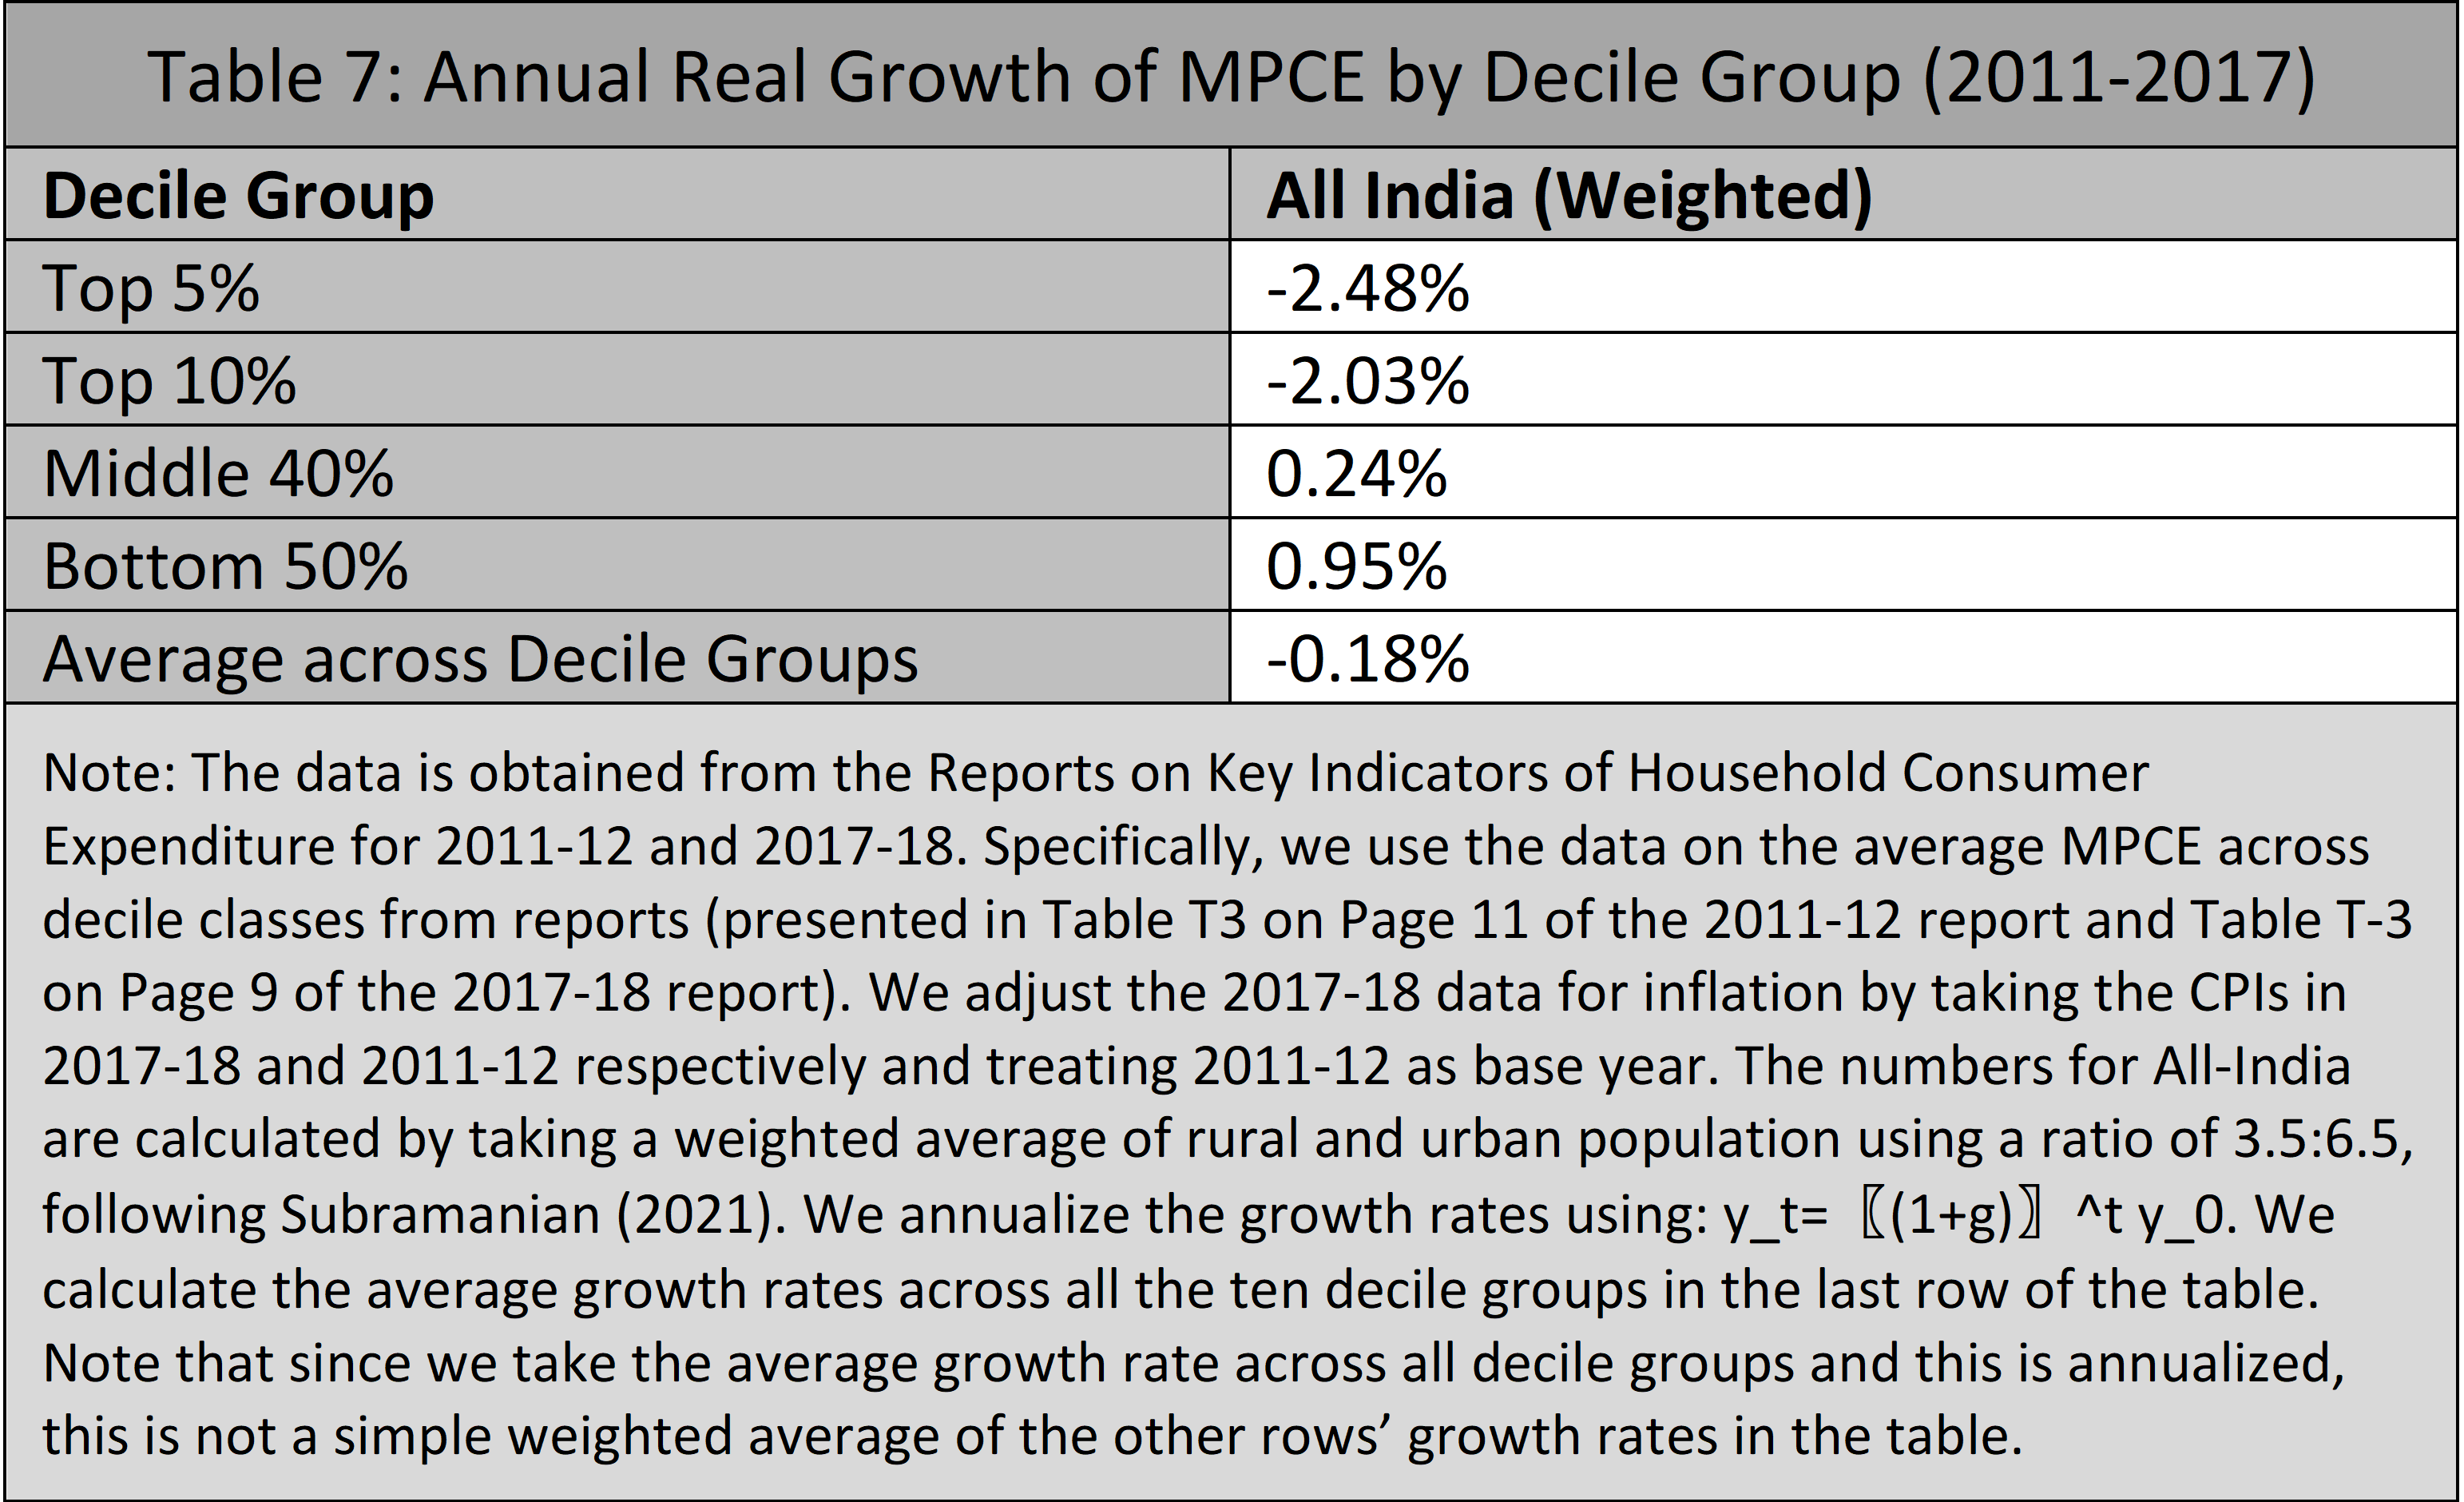
Figure 10 presents the annual growth rate of MPCE between 2011 and 2017 across the ten decile groups. We see positive growth rates of consumption expenditure for the bottom 80% of the population. The consumption growth rates for the decile groups are much below the per capita GDP growth rate. The yellow line captures the growth rate of consumption expenditure averaged across the ten decile groups. Again, the average consumption expenditure growth is negative, brought down by the sharp drop in consumption of the richer groups. This is in line with our findings for wealth inequality using the AIDIS data.
4.2 CPHS data
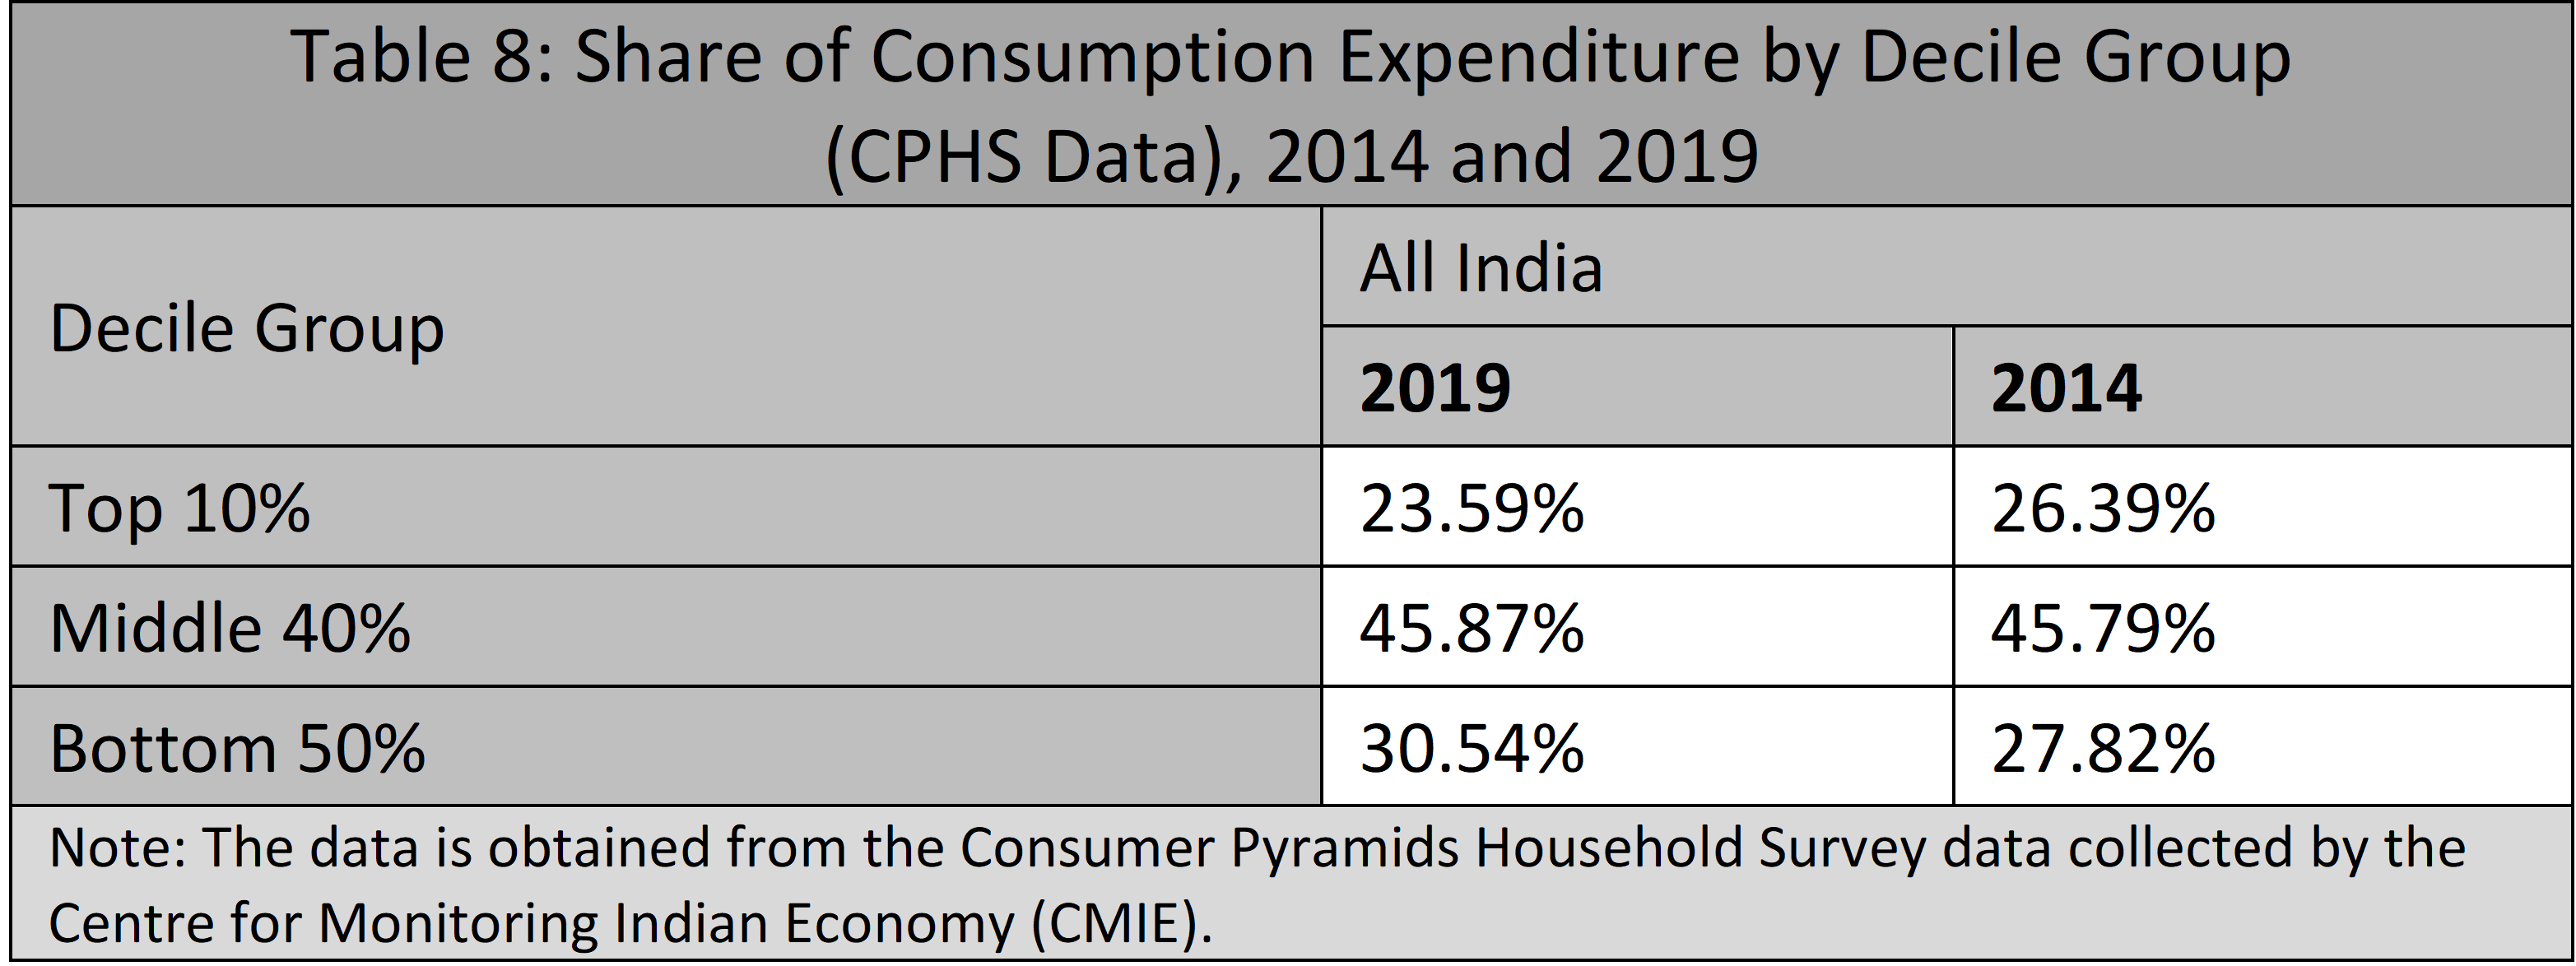
Another data source we examine is the Consumer Pyramids Household Survey (CPHS) collected by the Centre for Monitoring Indian Economy (CMIE). The results point toward a similar pattern: consumption inequality has declined from 2014 to 2019. The share of consumption expenditure by the top 10% has decreased while households at the middle and bottom of the distribution witnessed increasing shares (Table 8). The picture that emerges here is not very different from what we see with the NSS data.
We conduct a similar exercise of computing growth rates for different expenditure classes using the CPHS data, adjusted for inflation. Table 9 and Figure 11 present the annual growth rate of MPCE between 2014 and 2019 across different groups in the population.
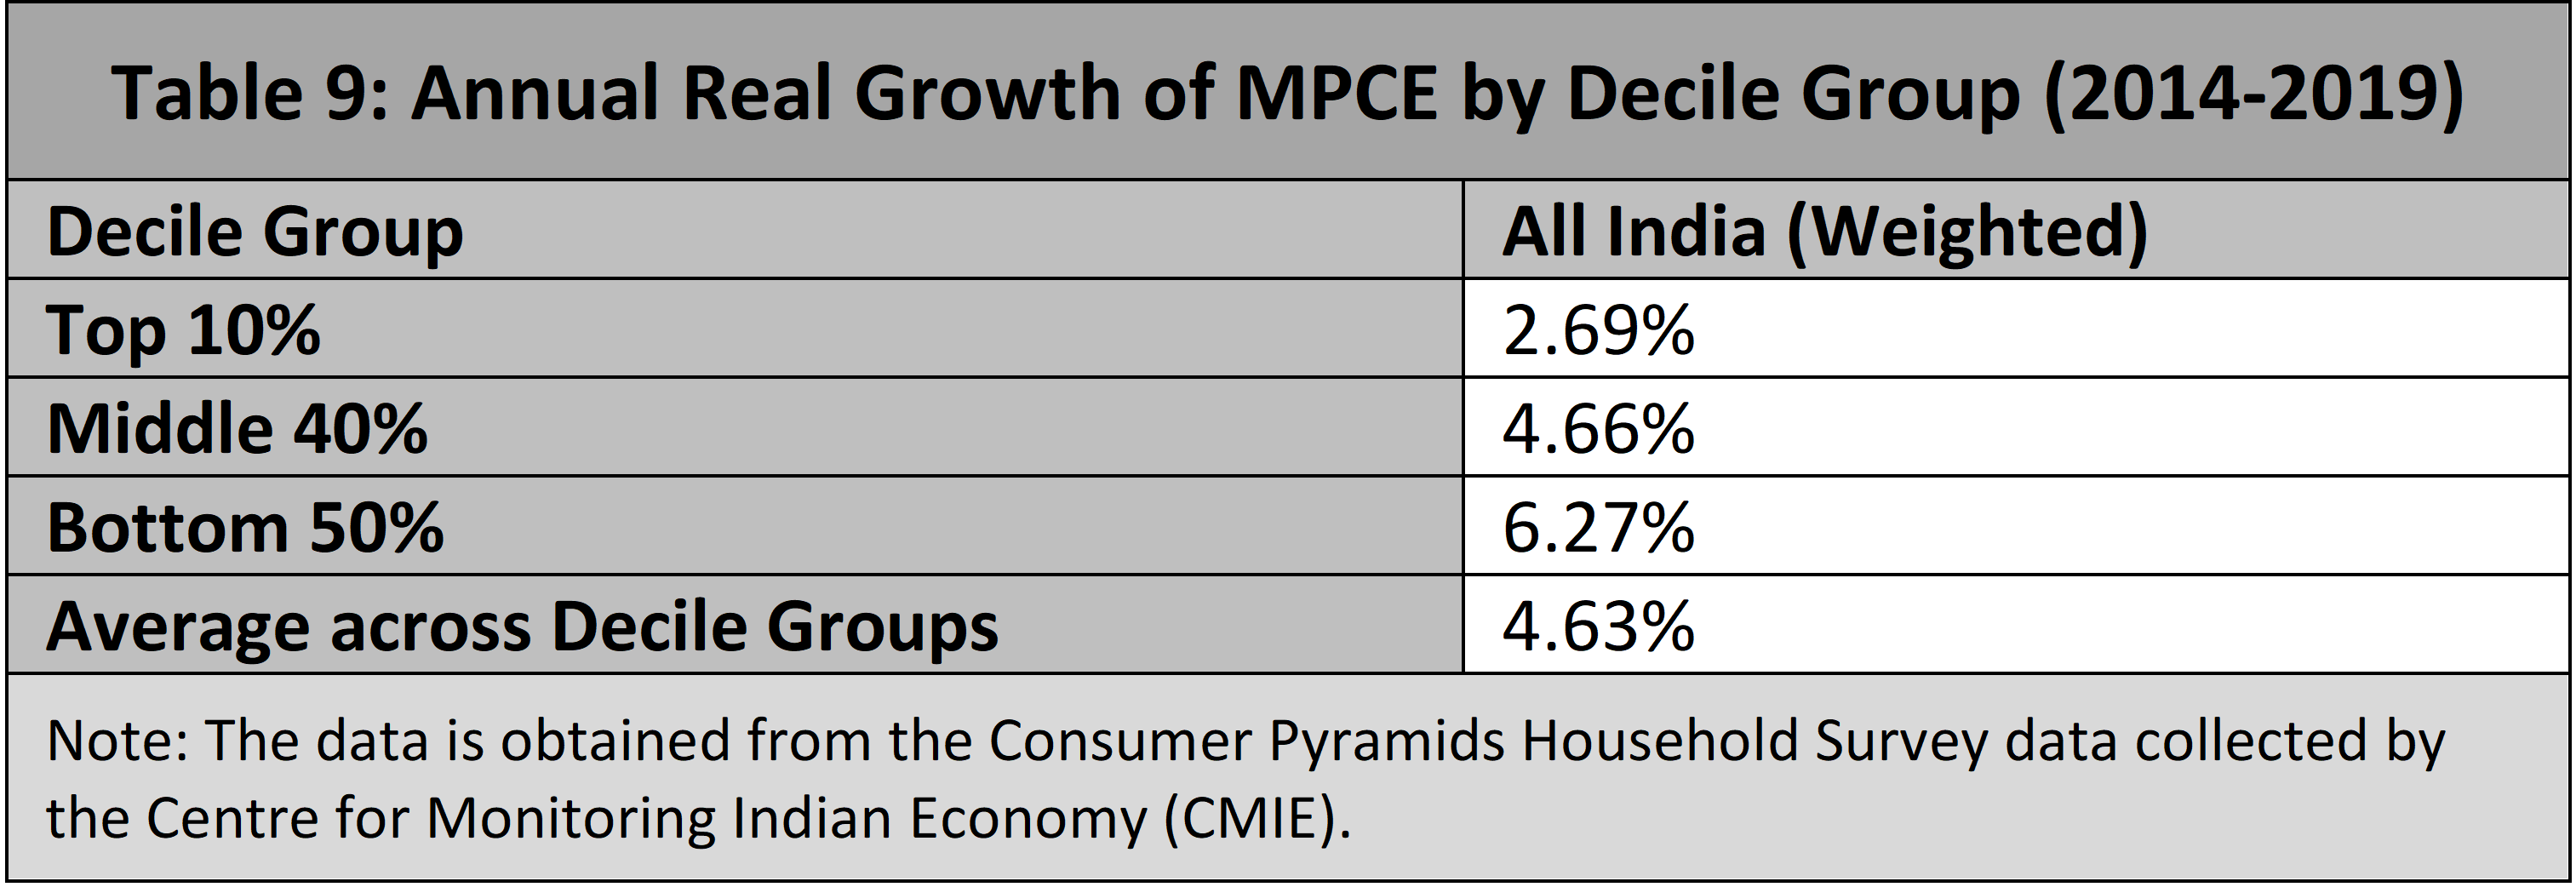
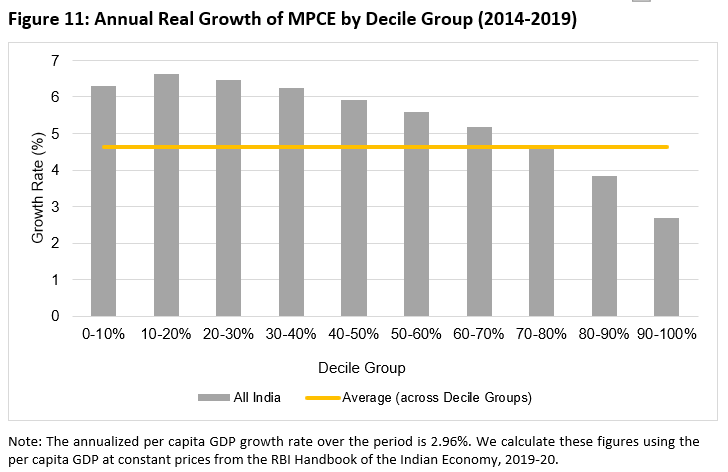
As before, we find higher consumption expenditure growth rates for poorer households. However, we do not see negative growth rates on average, or for any group, that was previously observed in the NSS data. Instead, we have positive growth rates in each of the decile groups, and the average consumption growth (4.63%) during this period is higher than the per capita GDP growth rate (2.96%). This finding has to be placed in the context of concerns that have been raised about CPHS data, including exclusions at the lower end of the consumption distribution. The sample appears to be biased towards better-off households over time, thereby underestimating the level of poverty. (See Dhingra and Ghatak (2021), Drèze and Somanchi (2021), Pais and Rawal (2021), and Somanchi (2021).
3.3 Consumption Inequality during COVID
Along with the public health crisis, COVID also delivered a shock to the economy. Using the CPHS data, we are able to analyze how household consumption was affected, and what happened to consumption expenditure inequality before and after the COVID lockdown. In Table 10, we calculate the share of consumption expenditure for the rich, middle class and poor households in August 2020, and compare these to our previous calculations for December 2019. The consumption expenditure share of the bottom 50% rises by around 1 percentage point, and the share of the top 10% has witnessed a decline. We document a further decline in consumption inequality during COVID. This is in line with the argument made by Gupta et al. (2021) who find that income inequality declined during COVID (so did consumption inequality, but to a lesser extent). Their explanations are associated with the contraction in capital income for richer groups and the falling demand for labour in the upper part of the wage distribution 5The impact of COVID on inequality using the CPHS data is subject to some disagreements, a full-blown analysis of which is beyond the scope of this article. In contrast to what Gupta et al. (2021) find and the results from our simple analysis, Jha and Lahoti (2022) argue that inequality, measured in terms of Gini or the Theil index, had increased during the lockdown period but then returned to the pre-pandemic level afterwards. As Jha and Lahoti (2022) note, part of the answer to these different findings may lie in whether individuals moved across different percentiles of the distribution of income or consumption expenditure (i.e., upward and downward mobility), as well as problems of tracking households using CPHS data during COVID because of sample attrition. .
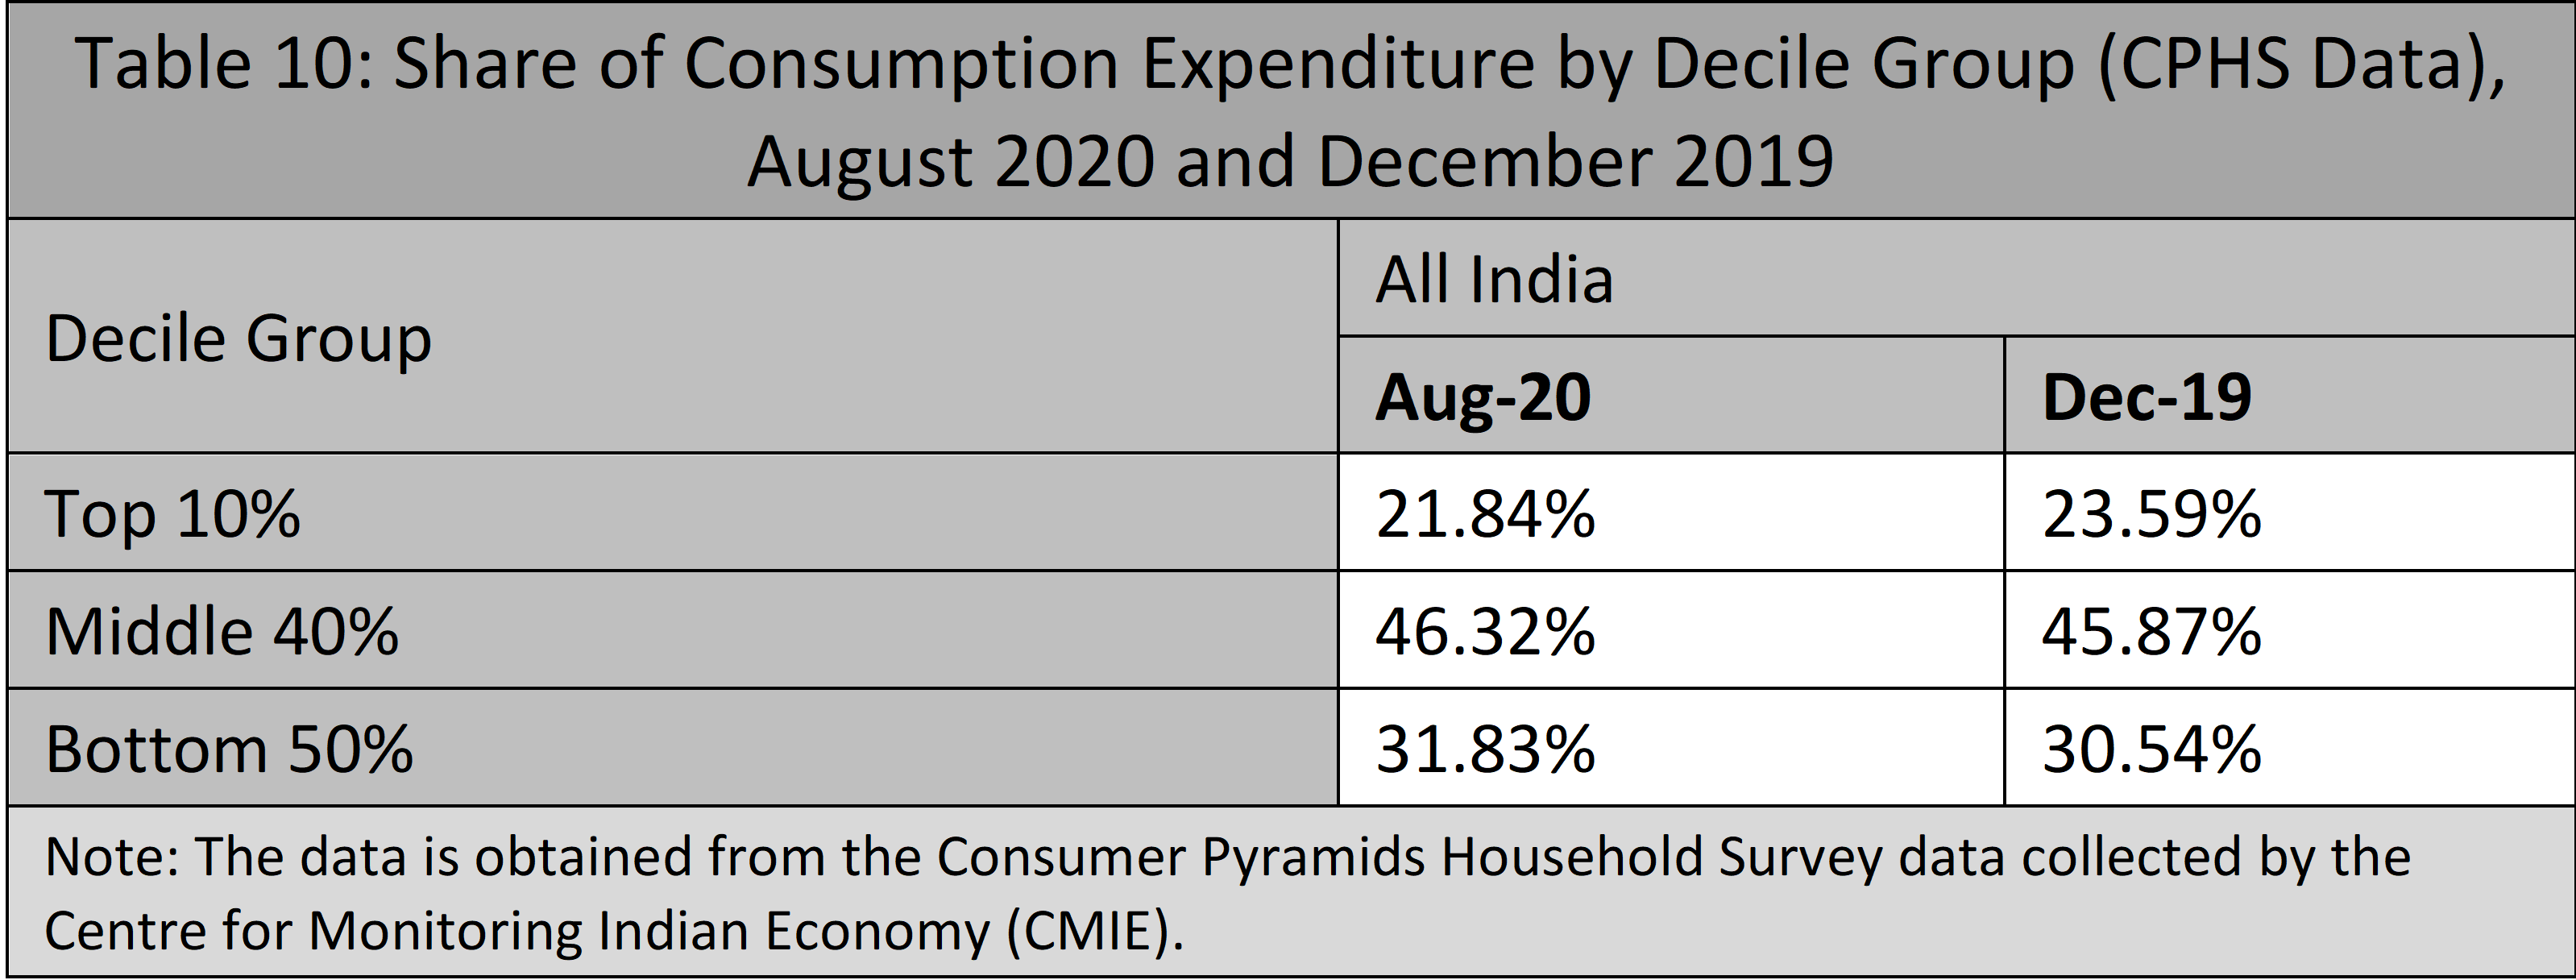
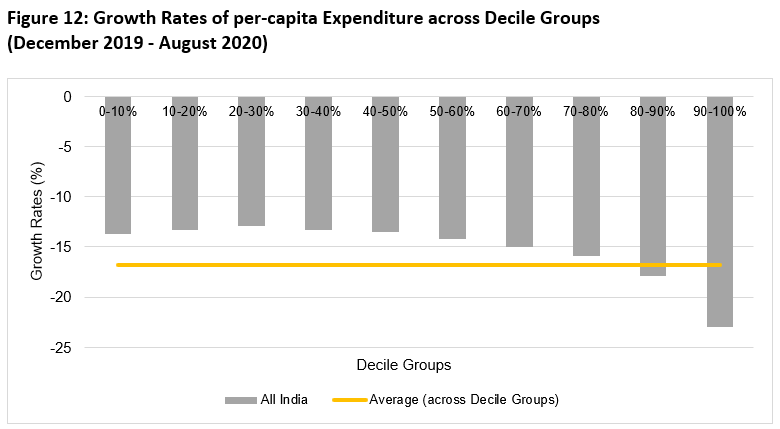
Figure 12 captures the growth rates of consumption expenditure between December 2019 and August 2020 for each decile group. The decline of consumption inequality during COVID has to be seen in the context of a decrease in the average consumption expenditure across all decile groups (by 16.8%). All groups experienced negative growth rates, with the richest group experiencing the largest drop (at least before August 2020, with the first round of lockdown).
However, it should be noted that while the focus of this article is on economic inequality, an important issue we have not discussed is poverty. Dhingra and Ghatak (2021) find that based on CPHS data, rural poverty increased by 9.3 percentage points and urban poverty by over 11.7 percentage points year-on-year from December 2019 to December 2020. Earlier months of the CPHS show that rural poverty increased by 14.2 percentage points and urban poverty by 18.1 percentage points. The actual increase in poverty due to Covid-19 is likely to be higher than what the CPHS data suggest, given some of the problems that have been noted with this data.
5. Discussion
In this article, we walk through a general picture of Indian economic inequality from various data sources and different angles of measurement. Based on the WID data we find an increase in economic inequality in India over the past few decades, and the gap between the rich and the poor is among the largest of several peer and developed economies. However, we find a decrease in economic inequality (in particular, wealth and consumption) in more recent years based on our analysis of recent household-level surveys.
Calculating the decile-group specific growth rates allows us to identify what might be driving the decrease in economic inequality in recent years – which is essentially a downward shift of the entire distribution as in Subramanian (2019) and a shrinkage of wealth and consumption among the rich. This is also consistent with a rise in poverty, an issue we did not discuss in depth. Using NSO’s Periodic Labour Force Survey (PLFS), Mehrotra and Parida (2021) find that both the poverty head count ratio and absolute number of the poor in India has risen from 2011-12 to 2019-20, a finding that is consistent with those based on NSS numbers (Subramanian, 2019).
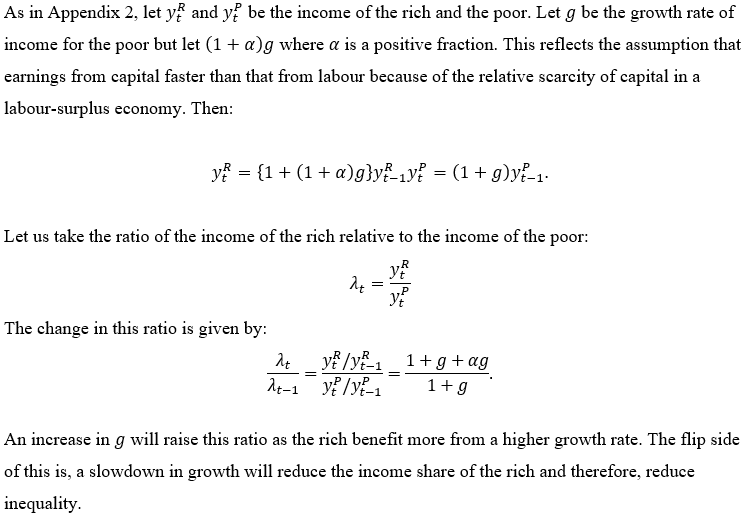
While data issues remain, a simple explanation of our findings would be along the following lines: If the process of growth in an unequal and labour-surplus economy leads to increasing inequality, a slowdown of the overall growth rate can lead to a reduction in inequality. This reflects the idea that if the rich benefit more from economic growth than the poor (as earnings from capital rise faster than that from labour, due to the relative scarcity of capital in a labour-surplus economy), then on the flip side, a growth slowdown would tend to decelerate this process. (In Appendix 3, we sketch a simple theoretical model that illustrates this argument. ) Other things being constant, increasing inequality is obviously undesirable. However, with the slowdown of overall growth (or contraction, as observed during the immediate aftermath of Covid-19), with the economic outcomes of all groups slowing , focusing only on inequality and not on averages as well as poverty, might be misleading.
Maitreesh Ghatak is Professor of Economics at the London School of Economics; Ramya Raghavan is a PhD scholar in Economics at the Northwestern University, United States, and Linchuan Xu is a PhD scholar at the London School of Economics.