


In the just released State of Working India 2023: Social Identities and Labour Market Outcomes report, we take a long view of what India’s growth and structural transformation process has meant for various social groups. Has growth succeeded in reducing group-based disparities? Who has been able to benefit from the new opportunities created in the past two decades?
In this article we present a few findings on the connection between growth and jobs, the movement of workers out of agriculture and into regular wage employment, and the reversal of this process during Covid-19. This analysis is based on the NSSO Employment-Unemployment Surveys and the more recent Periodic Labour Force Surveys The full report is available online.
Gender, jobless growth and structural change
The Indian economy presents an interesting combination of jobless growth with (slow) structural transformation. By jobless growth we refer to the lack of correlation between the output and employment growth rates. We define structural transformation as both a rise in the proportion of workers engaged in non-agricultural activities (the Kuznets process) and a rise in the proportion engaged in regular wage or salaried work as opposed to casual wage work or self-employment (the Lewis process).
The pattern of growth in India has been less job intensive than the developing country average.
Coming to the connection between gross domestic product (GDP) growth and employment, we find that India’s non-agricultural employment elasticity (the ratio of non-farm employment growth to non-farm GDP growth) for the period 1990 to 2019 is 0.47, which is significantly lower than the mean across 50 developing countries (which is close to 0.7). This means that even though most developing countries have been facing headwinds that make employment generation difficult, the pattern of growth in India has been less job intensive than the developing country average. 1Aggregate employment elasticity is lower at 0.2 than the elasticity of non-agricultural employment at 0.47. This is expected since agriculture has been shedding labour over a significant part of the period under analysis. From a structural change perspective, it is the non-agricultural elasticity that is more important.
Since the elasticity is a ratio of two growth rates, this number cannot help us answer the question – does employment growth occur faster when GDP growth also increases? In economic policy making, it is commonly assumed that higher GDP growth will lead to higher employment growth. Strikingly, over the past three decades, we find almost no relationship (and if anything a weak negative relationship) between GDP growth and employment growth for India (the coefficient is -0.11). Note that the developing country average is 0.3, which means that on average there is a positive relationship between GDP growth and employment growth.
There are two main reasons for this lack of correlation. First, as is well known, the fastest growing industries in India during the past couple of decades have tended to be modern services, which are not employment intensive. The second reason is also well appreciated though perhaps not necessarily in this context: the exit of women from the workforce. Since the high growth period (2004 to 2011, and to a lesser extent, 2011 to 2017) was accompanied by a large decline in the female labour force participation rate, we have another explanation for the lack of correlation between growth and employment.
Next we come to the relationship between growth and structural change. The parameter that captures this relationship is the growth semi-elasticity of structural change. This is the percent point change in the share of the workforce engaged in a particular sector for a given amount of GDP growth.
Table 1 shows these semi-elasticities at the all-India level for the period 1983–84 to 2018–19. The pace of exit from agriculture was such that a doubling of GDP would result in a drop in the agricultural share of employment by 15.5 percentage points. By itself, this number is hard to interpret. How do we know if a 15 percentage point decline is good or bad?
To answer this question, we need to have a comparison point. The contrast is provided by the semi-elasticity for the Lewis Process. Table 1 also shows that a doubling of GDP reduced the share of self-employment and casual wage work by just under 6 percentage points (-3.06 for self-employment share and -2.7 for casual wage share). The higher decline in agricultural employment share as compared to informal employment share means that even though growth was able to pull workers out of agriculture, these workers were more likely to move into informal non-farm employment (such as in construction) rather than directly into regular wage or salaried work.
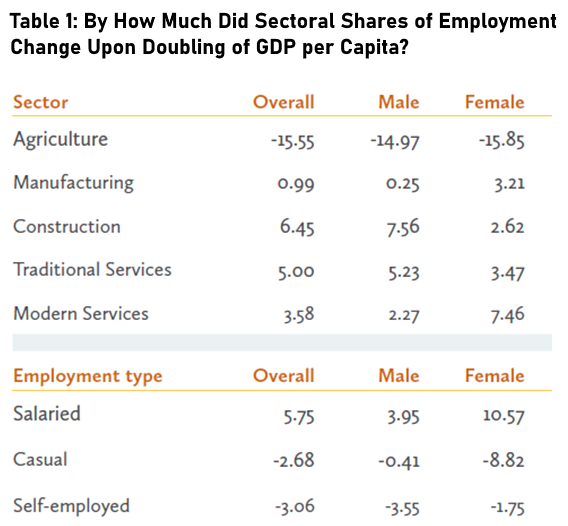
When we start looking at the experience of structural change disaggregated by gender, some more interesting differences emerge. Table 1 shows that the agricultural semi-elasticities are similar for men and women, but the semi-elasticities for construction and modern services are very different. The modern services elasticity for women is 7.5 as opposed to only 2.3 for men. Correspondingly, the same amount of growth caused a far larger increase in the salaried share for women as compared with men (10.6 percentage points compared with 4). Women saw a far larger drop in the share of casual labour compared to men.
How do we square these results with the general impression that the Indian labour market has not been welcoming of women? The answer lies in that economic growth since 2004 has caused a large churn in the composition of the female workforce. On the one hand, older, less educated women engaged in agriculture withdrew in large numbers. On the other hand, younger, more educated women entered the workforce, mostly in regular wage employment.
The rise in the proportion of regular wage work among women only applies to women who are employed in the first place and the majority of Indian women continue to be outside the workforce.
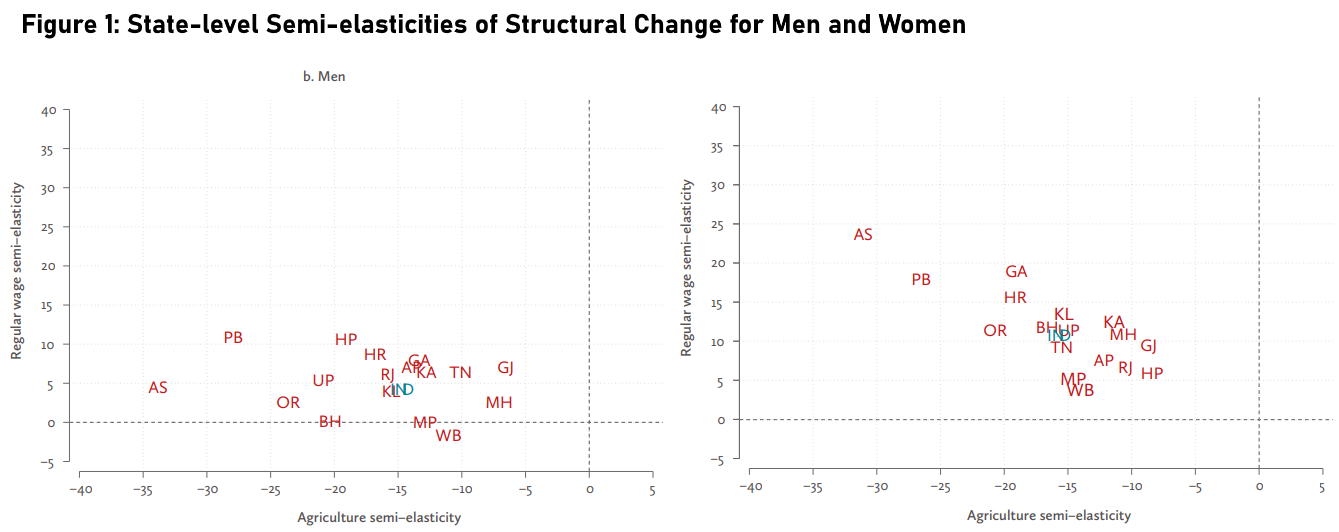
We summarise the gender-based contrast between the Kuznets and Lewis processes in Figure 1. These are scatter plots which show the two semi-elasticities for each state separately for male and female workers. Ideally, we would like to see all the states clustered high up in the top left, indicating a robust decline in the agricultural share and a rise in the regular salaried share.
The pace of change varies a great deal across states. As expected from the preceding discussion, the points are more or less flat for men but on an upward slope for women. However, it should be kept in mind that the rise in the proportion of regular wage work amongst women only applies to women who are employed in the first place and that the majority of Indian women continue to be outside the workforce.
Structural change during high growth
Who benefited from the creation of regular wage or salaried jobs in India during the high growth period? We look at this question in two ways. First, we analyse the correlates of regular wage employment in a regression framework since 2004. And, second, we look at the extent of intergenerational mobility across father-son pairs.
Expectedly, being a non-Scheduled Caste/ Scheduled Tribe (SC/ST) Hindu male who is well educated strongly improves the chances of being in a regular wage job.
But, less expectedly, the recent increase in the prevalence of regular wage work because of high economic growth has had two opposing effects. It has increased the probability of women being in such work compared to men and decreased the probability of SC/ST workers having such jobs compared to other castes.
The first is connected to the churn in the female workforce and the rapid increase in the educational attainment of women referred to earlier. The second is likely to be related to the reduction in the proportion of public sector employment amongst salaried jobs.
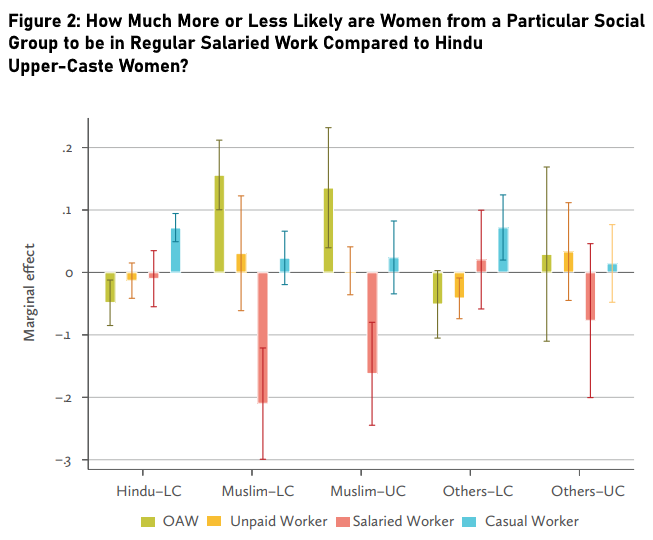
To go deeper into the intersectional effects of gender and caste or gender and religion, we perform an analysis only for women workers (separating rural and urban regions). This is done only for the most recent year, 2021–22. We use the combined religion-caste variable that has the following levels: Hindu lower caste, Hindu upper caste, Muslim lower caste, Muslim upper caste, other religions-lower caste, and other religions-upper caste. Here, lower caste refers to individuals from an SC or Other Backward Classes (OBC) background. Upper caste refers to everyone else.
...[T]he recent increase in the prevalence of regular wage work because of high economic growth has had two opposing effects—it has increased the probability of women being in such work compared to men, and decreased the probability of SC/ST workers having such jobs compared to other castes.
Figure 2 shows the results for urban areas (rural effects are not strong). The base category here, which is not on the graph, is Hindu upper-caste women. The effects are to be interpreted as an increase or decrease in the probability of being in a certain type of work compared to this base category.
Thus we see that compared with urban Hindu women (either lower caste or upper caste), urban Muslim women are far less likely to be in regular wage work, controlling for age, education, state of residence, and other factors. Note that where regular wage work is concerned, the caste difference within Muslim women or within Hindu women matters much less than the difference between Hindu and Muslim women as a whole. Women from other religions are not significantly different from the base category, as seen by the confidence intervals overlapping the zero line.
Increased availability of regular wage work is also reflected in a higher degree of intergenerational mobility. The most widely used method of measuring intergenerational mobility involves constructing a mobility matrix.
This intergenerational mobility (IGM) matrix displays the percentage of sons in each category, given that their father is in a particular category (Table 2). The diagonal cells in the mobility table show the percentage of sons in the same type of work as their father; that is, immobility or intergenerational persistence. Values above the diagonal indicate upward mobility and those below it represent downward mobility. Warmer colours represent higher values. Table 2 shows the IGM for two points in time: 2004–05 and 2018–19.
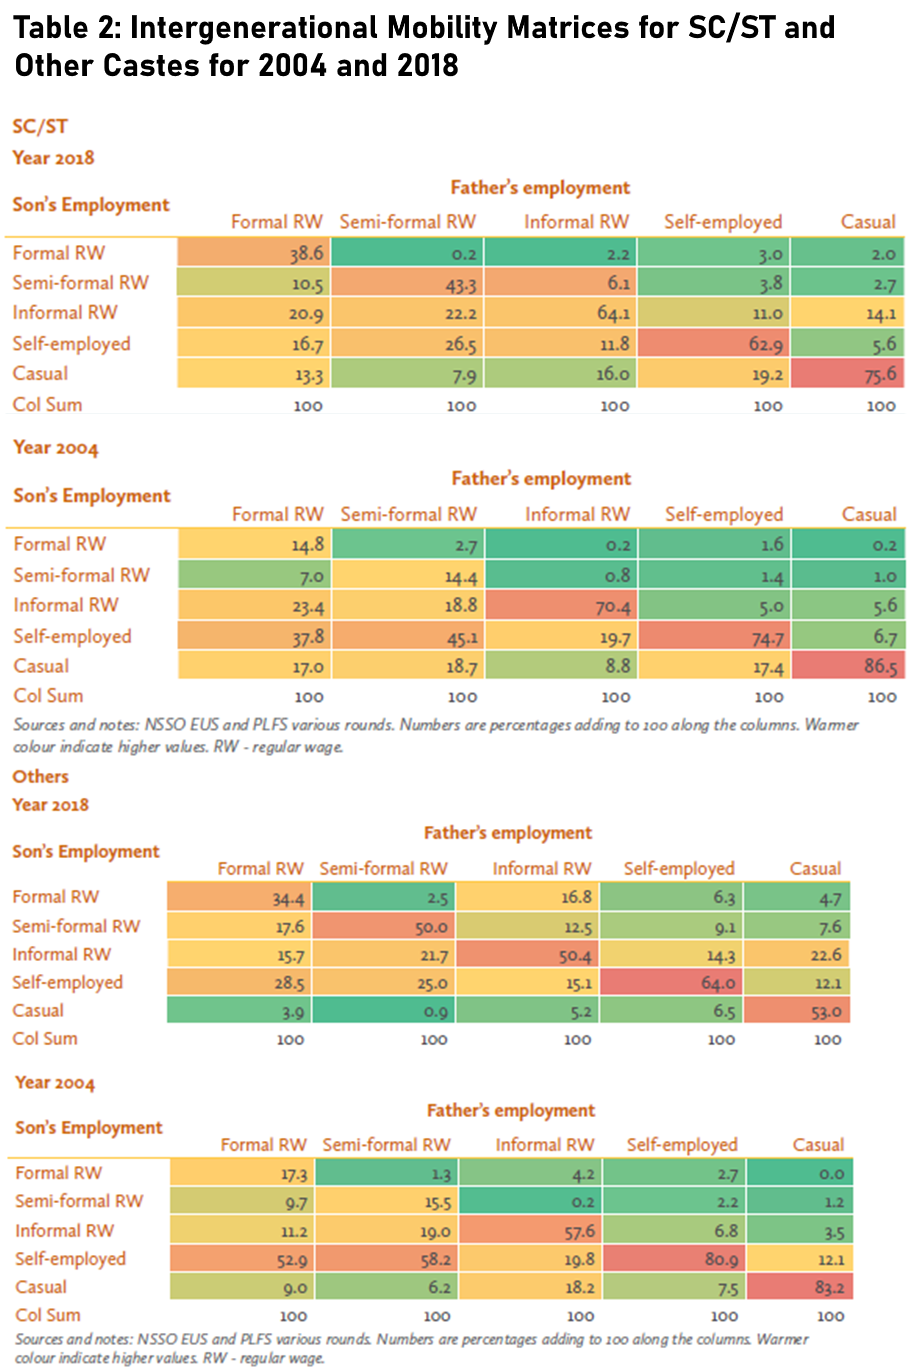
Encouragingly, overall mobility rose over the period of analysis. But there is a clear difference emerges across caste in the pace of this decline. In 2004, more than 80% of the sons of fathers working for a casual wage were themselves casual wage workers in all three caste groups. By 2018, this had declined the fastest for upper castes and slowest for SC/ST households, with OBCs in the middle.
In 2011, 87% of the sons of casual workers belonging to the SC/ST community were themselves casual workers and this had not changed substantially since 2004...
Within the General category, in 2018, only 53% remained in casual wage work like their fathers and about 23% moved into informal regular wage work. In contrast, a smaller proportion of lower caste households saw such mobility (about 14%).
The movement out of casual wage work carries particular significance for SC/ST workers due to their historical disadvantages in terms of access to property as well as education. In 2011, 87% of the sons of casual workers belonging to the SC/ST community were themselves casual workers and this had not changed substantially since 2004 (the number dropped to 75% in 2018).
Pandemic-induced reversal
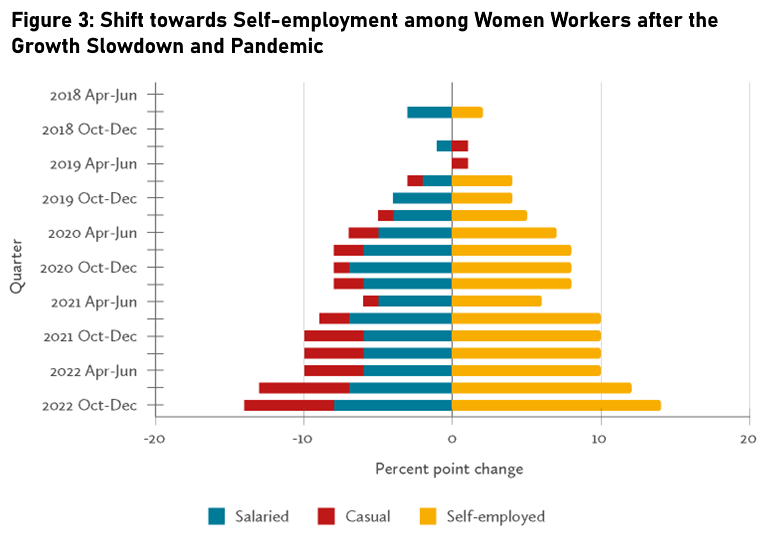
Finally, we come to an interesting aspect of the labour market in recent years. After falling or being stagnant since 2004, the female labour force and workforce participation rates have risen since 2019. But this was precisely the time that the economy had begun slowing down before being hit by the Covid-19 pandemic. Why did employment rise when growth slowed down?
The explanation is that it was mainly self-employment in agriculture that rose, led by distress. Compared with the April–June 2018 quarter, salaried employment for women was down a cumulative of 8 percentage points, according to the most recent available data (October–Dec 2022), while self-employment was up 14 percentage points.
Figure 3 shows this cumulative quarter-by-quarter change compared to the base (April–June 2018) quarter. Since both self-employment and agriculture constitute fallback options for workers who have lost work and cannot afford to remain unemployed, we can interpret these numbers as indicating a rise in distress. Taken together, the numbers paint the picture of an economy that was slowing down and was then hit by a massive shock, which resulted in a distress-led participation of women in paid work as well as a reversal of structural change.
This view is further supported by looking at what has happened to labour earnings over this period. Earnings from self-employment declined in real terms over this duration. Even in April–June 2022, two years after the 2020 lockdown, self-employment earnings were only 85% of what they were in the April–June 2019 quarter.
Overall, this episode is a cautionary note against placing too much emphasis on rising participation rates for women. If work participation rises due to economic growth and rising labour demand, this has very different implications than if it rises due to falling household incomes that force women into self-employment.
What we would like to see is an increase in the work participation rate alongside constant or increasing earnings in the subsistence sector. A key thing to watch out for in the coming quarters is a return to the pre-slowdown sectoral structure of employment for women accompanied by rising earnings in self-employment, signalling the return to a healthier labour market.
In conclusion, the State of Working India 2023 report offers some reasons to be hopeful about India’s developmental journey but it also clearly delineates the many short- and long-term challenges that lie ahead.
Amit Basole, Akshit Arora, and M.K. Shravan are with Azim Premji University, Bengaluru. The content and opinions expressed are that of the authors and do not necessarily reflect the views of the university.